Intensity Modulation of Fluorescent Line by a Finite Light Speed Effect in Accretion-Powered X-ray Pulsars
Abstract
The X-ray line diagnostic method is a powerful tool for an investigation of plasma around accretion-powered X-ray pulsars. We point out an apparent intensity modulation of emission lines with their rotation period of neutron stars, due to the finite speed of light (we call this effect ”finite light speed effect”), if the line emission mechanism is a kind of reprocessing, such as fluorescence or recombination after ionization by X-ray irradiation from pulsars. The modulation amplitude is determined by the size of the emission region, in competition with the smearing effect by the light crossing time in the emission region. This is efficient if the size of the emission region is roughly comparable to that of the rotation period multiplied by the speed of light. We apply this effect to a symbiotic X-ray pulsar, GX 1+4, a spin modulation of the intense iron line of which has been reported. The finite light speed effect can explain the observed intensity modulation, if its fluorescent region has a size of cm.
1 Introduction
Many of the accretion powered X-ray pulsars exhibit prominent iron emission lines from neutral atoms or ions. A detailed investigation of these emission lines is useful for diagnostics of their emission mechanism. Identification of emission lines (element and its ionization state) and their observed variability in the line parameters with time and with source luminosity provide important information on the line emission mechanism and their emission regions. Several possible line-emission regions have been considered such as inhomogeneous and clumpy stellar wind from the companion star (Sako et al., 2002; Wojdowski et al., 2003), surface or photosphere of the companions star, and the accreting matter around the Alfvén shell (Basko, 1980; Vrtilek et al., 2005; Kohmura et al., 2001).
Bright Neon and Oxygen emission lines (OVII) from 4U 1626-67 first reported by Angelini et al. (1995), which is a low mass X-ray binary pulsar with 7.7 s spin-period. supporting the warped accretion-disk origin (Schulz et al., 2001). Hercules X-1 is another X-ray pulser with spin period of 2.3 s. Its iron line shows an intensity modulation with its spin period (Vasco et al., 2013; Zane et al., 2004; Choi et al., 1994). Zane et al. (2004) and Choi et al. (1994) reported that the intensity modulation of the emission line is roughly represented by a sinusoidal function, the bottom phase of which is corresponding to the peak phase of the pulse shape of the hard X-ray continuum. But, Vasco et al. (2013) reported disappearance of the iron line flux around the peak phase of the pulse shape of the hard X-ray continuum, and speculated a hollow cone geometry for the accretion column. For these fast rotators,
The Fe fluorescent line is notable in the spectrum of GX 301-2, the spin period of which is 700 s, but the question of the fluorescent region is in a vigorous debate. Endo et al. (2002) analyzed the line shape of the intense Fe emission line from GX 301-2 and they found a significantly broader width of the line than that estimated based on the terminal velocity of the stellar wind. Fürst et al. (2011) reported a significantly small pulse fraction of the Fe emission lines but a strong pulse-to-pulse variation in its intensity. They investigated a correlation with the continuum flux and the Fe emission line flux, and showed that the Fe emission region is not far from the X-ray source, which is consistent with the result by Endo et al. (2002). On the other hand, Suchy et al. (2012) reported results by Suzaku observation and they argued that the line flux did not change significantly throughout the pulse phase, and concluded that the Fe fluorescence region was greater than 700 lt-s ( cm) from the neutron star, although where the pulse profile of the continuum X-rays shows the second peak, with an amplitude of 10 %.
The origin of emission lines in GX 1+4, which is a symbiotic X-ray pulsar with s spin period, was discussed by Kotani et al. (1999) and Yoshida et al. (2017) (hereafter Paper I). The size of emitting region of cm in radius was estimated with Suzaku observation adopting the similar method. It was also suggested that the size of fluorescent region can be reduced to cm by introducing inhomogeneity of matter (see Paper I). Paper I also reported that the iron emission line shows its intensity modulation with an amplitude of %, according to the pulse phase.
In this paper, we point out an importance of the following two effects in the discussion of the observed time variation of the line flux. If the fluorescent lines are emitted from such a large region, the observed time variation should be smeared with the light crossing time of the region, which is roughly 100 s, for the size of 3.41012 cm. On the other hand, we should take into account an apparent intensity modulation of the fluorescent lines by an effect of the finite light speed, as described in the next section.
2 Finite Light Speed Effect
We are now considering fluorescent lines from matter exposed to X-rays from an X-ray pulsar, the emission profile of which is not spherically symmetric. Therefore, the fluorescent region, which is illuminated by X-rays from the X-ray pulsar, changes according to the rotation of the neutron star. As a consequence, the fluorescent region appears to show an apparent movement to the observer. The apparent movement affects the observed intensity per unit time of the fluorescent lines, since the speed of light is finite, even if the circumstellar matter around the neutron star is homogenous and uniform and the intensity of X-rays from the neutron star stays constant. If the fluorescent region is going away from an observer with a velocity of , along the line of sight, emitted photons at the fluorescent region in 1 s is observed in s by the observer. Therefore, the intensity of the fluorescent line observed in 1 s decreases with a factor of . On the other hand, the intensity observed in 1 s increases by a factor of at the moment when the emission region is approaching to the observer. This phenomenon is similar to the Doppler boosting but the wave length of fluorescent lines does not change. Because the gas in the fluorescent matter is not moving but the region of the fluorescent is changing. We call this the finite light speed effect.
As mentioned in the previous section, the fluorescent region of GX 1+4 is thought to extend greater than 1012 cm. Since the pulse period of GX 1+4 is 150 s, the speed of the change of the fluorescent region is comparable to the speed of light. Therefore, a significant effect of this finite light speed effect can be expected.
2.1 Model Calculation and Results
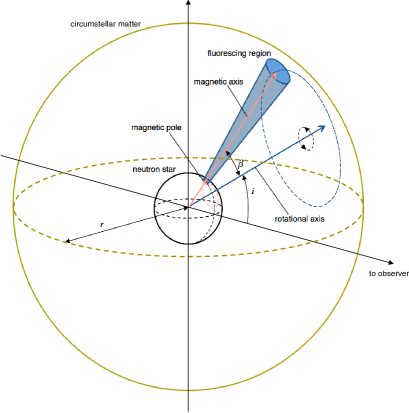
We demonstrated the finite light speed effect using Monte Carlo simulation. Figure 1 shows a schematic drawing of a configuration of the simulation. In the simulation, a neutron star is located at the center of spherically uniform and homogeneous matter. We assume that X-rays are emitted at magnetic poles and the magnetic axis is assumed to be tilted with an angle of from the rotational axis. The inclination angle of the rotational axis is denoted by an angle between the rotation angle and the line of sight. Intensity of the photons from a magnetic pole is assumed to be proportional to , where is the angle of direction of each photon from the magnetic axis. Although the illuminated region is indicated by the conic geometry for simplicity, the X-rays from the pulsar are emitted with the above given intensity distribution from the pole in our calculation. We calculate the propagation time of individual photons from the magnetic pole to the observer. By assuming a constant emission rate of the photons from the magnetic pole, we generate an expected light curve by enumerating the arrival time of photons.
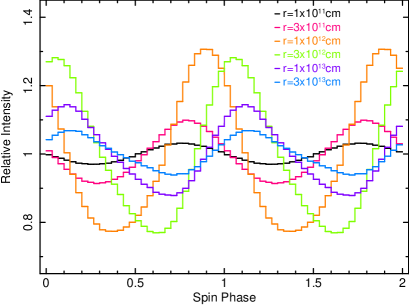
We calculated six cases of the radius of the circumstellar matter, , , , , and cm, with a spin period s, deg, and deg. We folded the six generated light curves on the spin period by assuming the time origin to be a time when a direct photon from a magnetic pole was detected by the observer. Intensities of the folded light curves were normalized as the average intensity to be unity and plotted as a function of the spin phase in Figure 2. We can see the intensity modulation by the finite light speed effect. The amplitude of the intensity modulation becomes larger with increasing radius of the circumstellar matter up to cm, while, in the cases of cm, the amplitude gradually becomes smaller than that of cm as the radius becomes larger. We can also see phase shifts as a change of the radius of the circumstellar matter, , where a larger phase delay is seen in the larger radius.
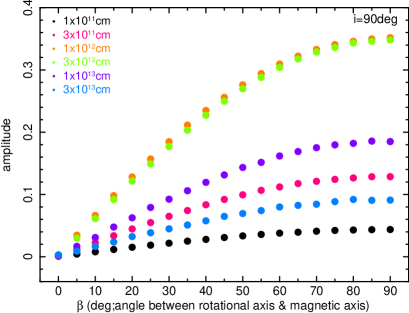
In Figure 3, the modulation amplitude as a function of is plotted for the six cases of the radius of the matter for deg. We can recognize that the modulation amplitude becomes larger with increasing the angle of from 0-deg to 90-deg. The dependence on the radius of matter is again found as the same to that shown in Figure 2, i.e. the amplitude is the largest at the radius of cm.
If deg, the velocity of the apparent movement of the center of fluorescent region along the line of sight, , is calculated as , for an optically thin case, where (=0.0–1.0) is the phase of the rotation of fluorescent region from the origin defined as the direction of the observer. Therefore, becomes large at large and at large , and hence the modulation amplitude of line intensity by the finite light speed effect becomes larger. The delay of the maximum phase is also understood by a long light travel time in the large size of the matter.
At a radius of cm, the light crossing time becomes s, which is roughly two times larger than the spin period. Therefore, the intensity modulation by the finite light speed effect is smeared with the light crossing time. This smearing decreases the amplitude of the modulation. The competition, between the finite light speed effect and the smearing effect, determines the amplitude of the modulation and causes phase-shifts and waveform-variations as we can see in Figure 2.
2.2 Application to GX 1+4
We used the simulation framework described in previous section to mimic intensity modulation of the fluorescent line observed in the symbiotic X-ray pulsar GX 1+4. Using Suzaku observation, Paper I found that iron Kα emission line shows the intensity modulation according to the pulse period, with an amplitude of %, peaking at around 0.7–1.1 in phase.
We calculated the arrival time at the observer for each photon considering six cases for a radius of the circumstellar matter, , , , , , and cm, and the spin period, 150 s. The mean free path of the circumstellar matter was fixed at the optical depth of the neutral iron K-edge, derived in Paper I with Suzaku observation. The simulation was conducted for different angle of and in a range between 0 deg and 90 deg with a 5 deg step, respectively.
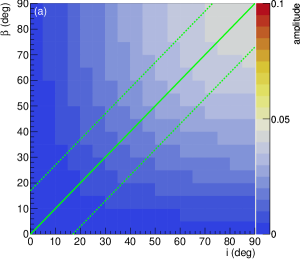
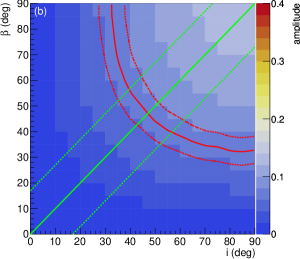
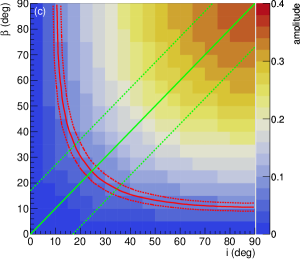
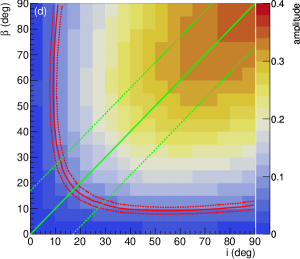
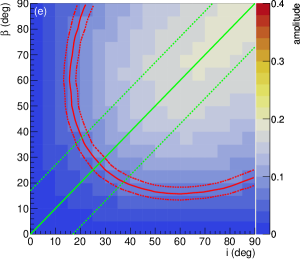
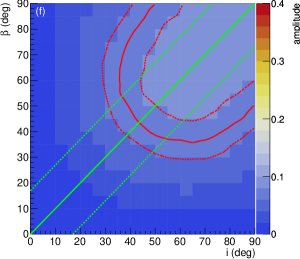
Figure 4 shows the calculated amplitude of intensity modulation of fluorescent line on two dimensional maps of the angles, and for each radius. The calculated amplitude of the time variation for cm is less than 7 % in any combination of the angles, while in cases of cm, a modulation amplitude of 7 % level can be seen in some combinations of and . The red-solid lines indicate the position of the amplitude of 7 % and the red-dotted lines indicate the acceptable region by uncertainty (1 %) of the observed amplitude, which were obtained from Suzaku observation (see Paper I).
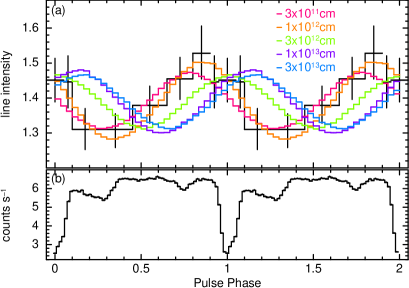
The combination of the two angles, and , can also be restricted by an interpretation of the pulse profile. The pulse profile of GX 1+4 in lower energy range (up to 10 keV) has a prominent sharp dip, as shown in Figure 5 (b). This sharp dip is interpreted as an obscuration or eclipse of X-ray emitting region at a vicinity of a neutron star surface by the accretion column to the magnetic poles of the pulsar (Galloway et al., 2000). Thus, the hot spot (i.e. magnetic pole) of the pulsar being at a base of the accretion column should face in the direction along the line of sight at least once a period. Therefore, should be equal to , with a certain acceptable range. We estimated an angle of accretion column viewed from a magnetic pole from the duration of the dip in the pulse profile. The dip was fitted by a Gaussian function and we got a width of the dip as (FWHM) in a unit of phase. This value is equivalent to deg in angle. We therefore estimated the acceptable range as . In Figure 4, the green-solid lines indicate and the green-dotted lines indicate the acceptable range between and .
The finite light speed effect constrains the modulation phase of the fluorescent line with regard to the pulse shape of the continuum emission. In the case of GX 1+4, the sharp dip is considered to occur when a direct photon from a magnetic pole is detected by the observer. In Figure 5, intensity-modulation of iron Kα emission line of GX 1+4 obtained from Suzaku and five typical calculated modulation samples, with amplitude of approximately 7 % and satisfy , are plotted as a function of the pulse phase. The simulated modulation curve with cm can reproduce the data modulation reasonably, but those with cm mismatch the data plots because of their inconsistent phase shifts. On the other hands, the modulation with amplitude of 7 % can not be reproduced with cm (see Figure 4).
In conclusion, even if the fluorescent matter is homogenous and uniform, the observed intensity modulation can be explained by the matter extending up to cm from the neutron star. This distance is much larger than the co-rotation radius and the Alfvén radius, even for the extremely strong magnetic field of G.
Here we discussed only one fluorescent region, though the emission from the neutron star arises from its two poles. Several previous works suggest the existence of an accretion disk in GX 1+4. Chakrabarty & Roche (1997) argued that the optical emission lines suggests the existence of thermal ultraviolet radiation from an accretion disk. Rea et al. (2005) discussed reflection by a torus-like accretion disk. Galloway et al. (2001) interpreted the dip in pulse profile as being due to the eclipse of the X-ray emitting region by the accretion curtain, which is formed by accretion flow along with magnetic field from inner edge of the accretion disk, showing a schematic figure of accretion geometry. The size of the accretion disk can be expected to be cm from its orbital period (Pereira et al., 1999), and thus the fluorescent emission from the other side of the neutron star may be hidden by the accretion disk.
3 Discussion
The finite light speed effect causes an intensity modulation of fluorescent lines, with the rotation period of X-ray pulsars. This is due to the apparent movement of the fluorescent region which is exposed to X-rays from a pulsar. Therefore, for an interpretation of the intensity modulation of fluorescent lines from X-ray pulsars, this effect should be taken into account. This effect is efficient, if the size of the fluorescent matter is comparable to the pulse period multiplied by the speed of light or, in other words, the apparent movement speed of the fluorescent region is comparable to the speed of light.
In the case of GX 1+4, the previously estimated fluorescent size ( cm) by Kotani et al. (1999), if it is true, matches to the above condition and relatively strong effect can be expected. Actually, the intensity modulation was detected and could be explained by this finite light speed effect.
However, in practice, the matter is not spherically symmetric and there should be various causes of the time variation of the fluorescent line. Several authors have reported the variations of the emission line parameters depending on the orbital phase of the binary system contained X-ray pulsar, such as Centaurus X-3, GX 301-2 and Vela X-1 (Ebisawa et al. 1996; Naik et al. 2011; Endo et al. 2002; Odaka et al. 2013). On the other hand the modulation due to the finite light speed effect should not change with the orbital phase. Therefore, the observation of the spin phase modulation at the various orbital phase would help to distinguish them.
It might be possible that the emission lines from photo-ionized plasma, exposed by a variable X-ray sources, also show similar effect by the finite speed of light. In this case we have to consider the smearing effect by a re-combination time scale as well as the light crossing time of the emission region. Also even in pulsars with a short spin period such as Hercules X-1 and 4U 1626-67, if the emission region is comparable to the pulse period multiplied by the speed of light and if the line photons are created by the fluorescence or by the photo-ionization, we have to examine the finite light speed effect for the discussion of the line flux modulation.
References
- Angelini et al. (1995) Angelini, L., White, N. E., Nagase, F., et al. 1995, ApJ, 449, L41
- Basko (1980) Basko, M. M. 1980, A&A, 87, 330
- Beri et al. (2015) Beri, A., Paul, B., & Dewangan, G. C. 2015, MNRAS, 451, 508
- Chakrabarty & Roche (1997) Chakrabarty, D., & Roche, P. 1997, ApJ, 489, 254
- Choi et al. (1994) Choi, C. S., Nagase, F., Makino, F., et al. 1994, ApJ, 437, 449
- Ebisawa et al. (1996) Ebisawa, K., Day, C. S. R., Kallman, T. R., et al. 1996, PASJ, 48, 425
- Endo et al. (2002) Endo, T., Ishida, M., Masai, K., et al. 2002, ApJ, 574, 879
- Fürst et al. (2011) Fürst, F., Suchy, S., Kreykenbohm, I., et al. 2011, A&A, 535, A9
- Galloway et al. (2000) Galloway, D. K., Giles, A. B., Greenhill, J. G., & Storey, M. C. 2000, MNRAS, 311, 755
- Galloway et al. (2001) Galloway, D. K., Giles, A. B., Wu, K., & Greenhill, J. G. 2001, MNRAS, 325, 419
- Kohmura et al. (2001) Kohmura, T., Kitamoto, S., & Torii, K. 2001, ApJ, 562, 943
- Kotani et al. (1999) Kotani, T., Dotani, T., Nagase, F., et al. 1999, ApJ, 510, 369
- Naik et al. (2011) Naik, S., Paul, B., & Ali, Z. 2011, ApJ, 737, 79
- Odaka et al. (2013) Odaka, H., Khangulyan, D., Tanaka, Y. T., et al. 2013, ApJ, 767, 70
- Pereira et al. (1999) Pereira, M. G., Braga, J., & Jablonski, F. 1999, ApJ, 526, L105
- Rea et al. (2005) Rea, N., Stella, L., Israel, G. L., et al. 2005, MNRAS, 364, 1229
- Sako et al. (2002) Sako, M., Kahn, S. M., Paerels, F., et al. 2002, in High Resolution X-ray Spectroscopy with XMM-Newton and Chandra, ed. G. Branduardi-Raymont
- Schulz et al. (2001) Schulz, N. S., Chakrabarty, D., Marshall, H. L., et al. 2001, ApJ, 563, 941
- Suchy et al. (2012) Suchy, S., Fürst, F., Pottschmidt, K., et al. 2012, ApJ, 745, 124
- Vasco et al. (2013) Vasco, D., Staubert, R., Klochkov, D., et al. 2013, A&A, 550, A111
- Vrtilek et al. (2005) Vrtilek, S. D., Raymond, J. C., Boroson, B., & McCray, R. 2005, ApJ, 626, 307
- Wojdowski et al. (2003) Wojdowski, P. S., Liedahl, D. A., Sako, M., Kahn, S. M., & Paerels, F. 2003, ApJ, 582, 959
- Yoshida et al. (2017) Yoshida, Y., Kitamoto, S., Suzuki, H., et al. 2017, The Astrophysical Journal, 838, 30
- Zane et al. (2004) Zane, S., Ramsay, G., Jimenez-Garate, M. A., Willem den Herder, J., & Hailey, C. J. 2004, MNRAS, 350, 506