Inductive spikes in the Crab Nebula — a theory of gamma-ray flares
Abstract
We show that the mysterious, rapidly variable emission at MeV observed from the Crab Nebula by the AGILE and Fermi experiments could be the result of a sudden drop in the mass-loading of the pulsar wind. The current required to maintain wave activity in the wind is then carried by very few particles of high Lorentz factor. On impacting the Nebula, these particles produce a tightly beamed, high luminosity burst of hard gamma-rays, similar to those observed. This implies (i) the emission is synchrotron radiation in the toroidal field of the Nebula, and, therefore, linearly polarized and (ii) this mechanism potentially contributes to the gamma-ray emission from other powerful pulsars, such as the Magellanic Cloud objects J05376910 and B054069.
pacs:
95.30.Jx, 95.30.Qd, 95.83.Sz, 97.60.GbThe detection of powerful gamma-ray flares from the Crab Nebula by the AGILE satellite and the Large Area Telescope on the Fermi satellite Tavani et al. (2011); Abdo et al. (2011); Buehler et al. (2012) has provided theorists with three major puzzles: How are particles able to emit synchrotron radiation well above the astrophysical “upper-limit” Guilbert et al. (1983)? What is the geometry and location of the source, given that it varies on a timescale of hours, whereas the Nebula has a light-crossing time of months? By which mechanism can such a small source achieve a power only one order of magnitude less than that of the entire Nebula? Many theories have addressed these issues (for a review see Bühler and Blandford (2014)), but none has yet achieved general acceptance. In this Letter a novel theory is proposed, based on the properties of relativistic winds that are dominated by Poynting flux: the frequency, variability and power of the flares emerge as natural consequences of a sharp reduction of the supply of electron-positron pairs to the wind of the Crab pulsar, an effect closely analogous to the voltage spikes generated when the current in an inductive electrical circuit is interrupted. Although the underlying cause remains a mystery, such interruptions are not implausible, since the electromagnetic cascades responsible for creating the pairs are thought to be highly erratic Cerutti and Beloborodov (2017), a conclusion supported by strong pulse-to-pulse fluctuations in the radio emission, that presumably originates in this region Hankins et al. (2016). The new theory predicts the polarization properties of the flares, which may be measurable in the near future Tatischeff et al. (2016), and suggests that similar emission may be detectable from other pulsar wind nebulae.
The Crab Nebula is powered by an electron-positron wind that is energetically dominated by electromagnetic fields. These oscillate at the pulsar period and have a finite phase-averaged (DC) component Rees and Gunn (1974), the necessary currents being carried by the pairs. Such winds propagate radially Kirk et al. (2009) up to a termination shock at radius , where the ram pressure balances that of the surroundings. Because the particle density drops off as , non-MHD effects become important at sufficiently large radius. These can lead to the conversion of the oscillations into electromagnetic waves Usov (1975); Arka and Kirk (2012), for which there is no observational evidence, or to damping of the oscillations, accompanied by radial acceleration of the plasma.
This latter process was originally modeled as magnetic reconnection in a “striped wind”— one with oppositely directed bands of toroidal magnetic field separated by hot current sheets Coroniti (1990); Lyubarsky and Kirk (2001). Dissipation in the current sheets releases the magnetic tension, leading to radial acceleration of the flow. However, in the case of the Crab, complete dissipation of the wave energy occurs only for a relatively high pair density Kirk and Skjæraasen (2003), which implies a terminal Lorentz factor . An additional acceleration mechanism is then needed for the flares Zrake (2016). Conversely, lower density flows reach higher bulk Lorentz factors, even though they do not achieve complete dissipation. However, in the Crab, hot plasma cannot be confined in the sheets up to the termination shock Lyubarsky and Kirk (2001), which invalidates this model, and leaves the ultimate fate of the waves uncertain. Here, we present a solution to this problem: assuming that the pulsar wind is launched as a mildly supersonic MHD flow with embedded magnetic fluctuations, we demonstrate that inductive acceleration converts of the power into kinetic energy. When the supply of electron-positron pairs is severely limited, the few particles that are present achieve very high Lorentz factors.
Dissipation is not essential for acceleration Spruit and Drenkhahn (2004), as was shown using a static, sinusoidal, magnetic shear (a “sheet-pinch”) as a wave model Kirk and Mochol (2011). This wave contains neither a current sheet nor hot plasma. The transverse magnetic field has constant magnitude and rotates at a uniform rate as a function of phase. The current is carried by cold electron and positron fluids which, in the co-moving frame, flow along the magnetic field. Provided the transverse flow speed , remains small, the wave propagates at constant speed, as expected in MHD. But towards larger radius the drop in density causes to increase to maintain the wave currents. When , particle inertia causes a small misalignment of current and field, leading to a net radial acceleration. Because resistive dissipation is absent, and the underlying cause is the maintenance of a current flow, this mechanism is appropriately described as inductive acceleration.
Reference Kirk and Mochol (2011) identified the location of the inductive acceleration zone, and gave an approximate solution in which the Lorentz factor of the plasma is proportional to . This result is not immediately applicable to a pulsar wind, because it does not allow for a DC component. However, it is straightforward to generalize the model to that of a striped wind that contains two sheet pinches instead of two hot current sheets. Each pinch causes the magnetic field to rotate through radians, so that the field outside of the pinches is purely toroidal, and the magnitude of the DC component is controlled by the location in phase of the pinches. The analysis is particularly simple if the thickness of the pinches is small — i.e., they become rotational discontinuities. This wave displays the same radial evolution as the single, sinusoidal pinch studied by Kirk and Mochol (2011) (for details, see supplemental material), the only difference is that the DC component is , which causes the pinches to migrate in phase. Ultimately, when the wave energy has been completely converted into kinetic energy, the pinches merge. However, provided their initial separation is not small, merging occurs only towards the end of the acceleration phase, when the kinetic energy flux is already comparable to the Poynting flux.
Pulsar winds are usually modeled as either isotropic or axisymmetric, with the power concentrated towards the equator Porth et al. (2017), but the estimates presented below are not sensitive to this distinction. Assuming isotropy, two parameters characterize the wind: (i) the ratio at the light cylinder, , of the gyrofrequency of a non-relativistic electron to the rotation frequency of the neutron star, given, for a magnetically dominated flow, by
| (1) |
where is the spin-down power of the neutron star, and (ii) the energy carried per particle in units of
| (2) |
where is the rate at which electrons and positrons are transported into the nebula by the wind. For the Crab, , but is uncertain. It can be related to the “multiplicity” parameter used in modeling pair production near the pulsar Cerutti and Beloborodov (2017) (conventionally, one sets Lyubarsky and Kirk (2001)), but this should not be interpreted too literally. A latitude-dependent mass-loading of the wind can be defined by generalizing (2), which enables detailed modeling of the radio to X-ray emission of the Crab Nebula Olmi et al. (2015). The tightest constraints, however, refer to the average of over the entire wind and over the lifetime of this object: , which corresponds to – and Bucciantini et al. (2011).
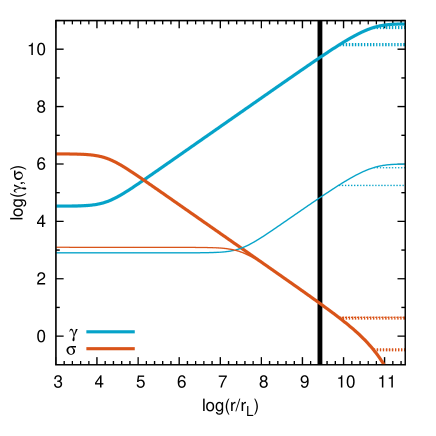
The radial evolution of the wind is governed by three equations derived in Ref. Kirk and Mochol (2011) and in the supplemental material (where they are numbered (35), (37) and (38)). These can be integrated numerically to find the three unknown functions of , which are the fluid Lorentz factor , the “magnetization parameter” , with the proper number density of the fluids, and the magnetic field strength, and the transverse component of the dimensionless fluid four-velocity . Despite impressive progress based on 3D MHD and force-free simulations Tchekhovskoy et al. (2016), the nature of the wind at launch, and, therefore, the initial conditions remain uncertain. Fundamental properties of axisymmetric flows suggest they accelerate steadily up to the sonic point, and thereafter coast at constant speed (Kirk et al. (2009), see supplemental material). Assuming the wave is launched as a mildly supersonic MHD flow, Fig. 1 shows results for and two different values of mass-loading: , the time-averaged value needed to provide the optical to X-ray emitting particles in the Crab Nebula, and , a severely charge-depleted value with . The latter is a plausible upper limit on , since it corresponds to the charge density at which light-like waves can propagate already at radius . If these predominate, the solutions shown in Fig. 1 lose validity. However, embedded fluctuations could, in principle, be preserved at even lower density — a more rigorous but higher upper limit, , is derived in equation (40) of the supplemental material. Note that a fluctuation in pair loading need not be isotropic, and is advected radially with the flow. Sectors of the wind separated by an angle evolve essentially independently of each other, since a light signal launched by a fluid element in one sector does not reach the equivalent element in the other until it has more than doubled its radius.
The results shown in Fig. 1 exhibit three phases. In order of increasing radius, these are (i) the MHD phase, in which is small, and both and are constant; (ii) an acceleration phase in which , and the inertia of the charge carriers causes to increase and to decrease at the expense of the oscillating component of the field; (iii) a coasting phase in which the wave again proceeds at constant , which begins either when the current sheets merge (for a finite DC component) or is approached asymptotically as .
An approximate solution for the acceleration phase is Kirk and Mochol (2011):
| (3) |
valid for , where is the initial Lorentz factor of the wind. According to (3), inductive acceleration is a relatively slow process requiring an undisturbed pulsar wind that extends to very large radius. For the Crab, Fig. 1 shows that at the termination shock, independent of . Thus, only of the Poynting flux is converted into kinetic-energy flux before the wind reaches the inner boundary of the Nebula.
Taking into account that for a magnetically dominated flow, and that the termination shock compresses it by roughly a factor of three, the synchrotron emission of an electron that enters the nebula with given by Eq. (3) peaks at a photon energy of
| (4) |
Thus, for the Crab under average conditions (, , ), particles that cross the shock initially radiate at , and are subsequently accelerated, either close to the shock or elsewhere in the Nebula, to produce the time-averaged optical to hard X-ray synchrotron emission. However, the situation changes dramatically if the supply of particles in some section of the wind is interrupted. The arrival at the termination shock of a low-density pocket with , as depicted in Fig. 1, causes the injection into the Nebula of a radially directed beam that initially radiates photons of energy .
An electron injected at pitch angle into a homogeneous magnetic field with a Lorentz factor such that its synchrotron peak is , is deflected through an angle
| (5) |
whilst cooling to the point at which its peak emission has decreased to . Thus, if energetic electrons are injected radially by a pulsar wind into the surrounding nebula, synchrotron photons of energy will appear to an observer with sufficient angular resolution to emerge from a finite-sized patch on the termination shock, centered on the pulsar. The precise size and shape of this patch depend on the configuration of the magnetic field downstream of the termination shock, which is expected to be turbulent on length scales of Porth et al. (2016), but, nevertheless, predominantly toroidal. A rough upper limit on the area of the patch, , follows from assuming random deflections through an angle of at most that given in Eq. (5). For , this implies . However, a weaker dependence on frequency is found if the beam diverges diffusively.
This has important implications for the spectrum, time-dependence and overall power of the emission: Assume the pulsar wind is depleted of charges in a cone that occupies a solid angle and includes the line-of-sight to the observer. Then, photons with energy , that are radiated by electrons crossing the termination shock in this cone, remain within it, and their steady-state, differential flux has the form typical of mono-energetically injected, cooling electrons. On the other hand, lower frequency photons emerge from a patch with , and are radiated into a solid angle that exceeds . This depletes the observed flux, leading to a turnover at . Using (5) to estimate the rate at which the beam of cooling electrons diverges, and employing a crude, monochromatic approximation for the synchrotron emissivity, gives, for the differential energy flux :
| (10) |
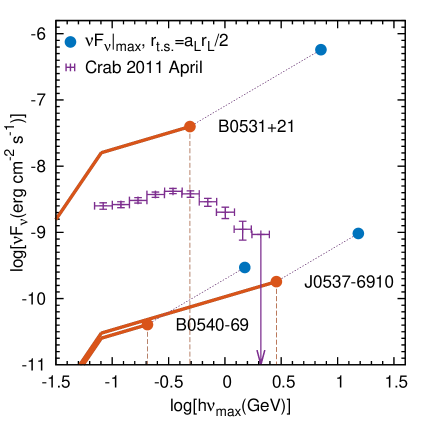
where is the distance to the source, and the filling factor, , () is the fraction of the flow containing charge-depleted regions. As shown in Fig. 2, observations of powerful gamma-ray flares from the Crab Nebula show a spectral form roughly consistent with (10), provided given by Eq. (4) is , and is about . Furthermore, the available power is more than adequate to explain the most powerful flare observed to date (that of April 2011Buehler et al. (2012)): within the uncertainties in the distance to this object, and the angular distribution of power in the pulsar wind, this flare is consistent with and at the termination shock, as indicated in Fig. 1. Gamma-ray flares from the Crab are seen with a range of powers and peak photon energies, and collations of their spectra, as presented, for example, in Figs. 6 and 7 of Ref. Buehler et al. (2012), can, in principle, be been used to test model predictions. However, although the crude model of synchrotron radiation plotted in Fig. 2 suggests rough agreement with the data, a more sophisticated approach would be needed to fit details of the spectrum.
Since electron-positron pairs are injected into the wind relatively close to the pulsar, the relevant timescale of variations is roughly the rotation period. A reduction in the injection rate on this timescale causes the wind to propagate at a higher Lorentz factor. At the termination shock, the transition between the two flow states is broadened in time to roughly , where refers to the slower flow, but this is still very short (s for the Crab) compared to the variation time of the flares. Therefore, both the leading edge and the trailing edge of a cone of charge-depleted wind can be treated as sharp transitions, and the observed rise and decay-times of the emission are dominated by the variation in travel time from different parts of the illuminated patch on the termination shock. This patch appears larger at lower photon energy, and the timescale of variation is, correspondingly, energy dependent:
where, in the second equation, the value of for the Crab has been inserted. Thus, the timescale of eight hours observed in the powerful 2011 April Crab flare Buehler et al. (2012) suggests a patch of angular extent . This is consistent with , provided , which is also suggested by the spectrum shown in Fig. 2.
Although it provides an attractive scenario, the main shortcoming of the theory presented above is that it does not explain why the supply of charged particles to small parts of a magnetically dominated, relativistic outflow should suffer interruptions. The reason is assumed to lie in the physics of the electromagnetic cascades that are responsible for producing the pairs we observe when the flows terminate. These are known to be non-stationary, both in pulsars and in black hole magnetospheres Cerutti and Beloborodov (2017); Levinson and Segev (2017), but a detailed understanding of their 3D spatial and temporal properties is not currently within reach. On the other hand, as long as the theory provides a reasonable fit to the data, it can be used to infer the properties of these cascades. Indeed, the fact that flares from the Crab can last for several days or longer implies that during this time, pockets of depleted charge in a small cone of outflow directed at the observer have a spatial or temporal filling factor of several per cent, which, in turn, suggests that the global geometry of the cascade varies on a timescale much longer than the pulsar rotation period.
The Crab is the most powerful pulsar known in the Milky Way, but it is not unique. In our neighboring galaxy, the Large Magellanic Cloud, two pulsars of comparable power are known: PSR J05376910 and PSR B054069 Fermi LAT Collaboration et al. (2015). The predicted flare spectra for these objects are shown in Fig. 2, using estimates of the location of the termination shock given in Table 2 of reference Kargaltsev and Pavlov (2008). Flares from the gamma-ray pulsar B054069 are not expected at energies significantly larger than , and may, therefore, be difficult to detect. PSR J05376910, however, has a shorter pulse period and a longer undisturbed wind than the Crab. As a result, its nebula (PWN N 157B) should exhibit synchrotron flares with photons of up to , as suggested by a recent analysis of Fermi-data Saito et al. (2017). Thus, inductive spikes may be a common property of young, powerful pulsars, and enable more detailed modeling and a deeper understanding of the way in which they energize their surrounding nebulae. Furthermore, inasmuch as they are also powered by low density, magnetically dominated, relativistic outflows, both blazars and gamma-ray bursts may exhibit analogous phenomena Kirk and Mochol (2011).
Acknowledgements.
This research was supported by a Grant from the GIF, the German-Israeli Foundation for Scientific Research and Development.References
- Tavani et al. (2011) M. Tavani, A. Bulgarelli, V. Vittorini, A. Pellizzoni, E. Striani, P. Caraveo, M. C. Weisskopf, A. Tennant, G. Pucella, A. Trois, and et al, Science 331, 736 (2011), arXiv:1101.2311 [astro-ph.HE] .
- Abdo et al. (2011) A. A. Abdo, M. Ackermann, M. Ajello, A. Allafort, L. Baldini, J. Ballet, G. Barbiellini, D. Bastieri, K. Bechtol, R. Bellazzini, and et al, Science 331, 739 (2011), arXiv:1011.3855 [astro-ph.HE] .
- Buehler et al. (2012) R. Buehler, J. D. Scargle, R. D. Blandford, L. Baldini, M. G. Baring, A. Belfiore, E. Charles, J. Chiang, F. D’Ammando, C. D. Dermer, S. Funk, J. E. Grove, A. K. Harding, E. Hays, M. Kerr, F. Massaro, M. N. Mazziotta, R. W. Romani, P. M. Saz Parkinson, A. F. Tennant, and M. C. Weisskopf, Astrophys. J. 749, 26 (2012), arXiv:1112.1979 [astro-ph.HE] .
- Guilbert et al. (1983) P. W. Guilbert, A. C. Fabian, and M. J. Rees, MNRAS 205, 593 (1983).
- Bühler and Blandford (2014) R. Bühler and R. Blandford, Reports on Progress in Physics 77, 066901 (2014), arXiv:1309.7046 [astro-ph.HE] .
- Cerutti and Beloborodov (2017) B. Cerutti and A. M. Beloborodov, Space Science Reviews 207, 111 (2017), arXiv:1611.04331 [astro-ph.HE] .
- Hankins et al. (2016) T. H. Hankins, J. A. Eilek, and G. Jones, Astrophys. J. 833, 47 (2016), arXiv:1608.08881 [astro-ph.HE] .
- Tatischeff et al. (2016) V. Tatischeff, M. Tavani, P. von Ballmoos, L. Hanlon, U. Oberlack, A. Aboudan, A. Argan, D. Bernard, A. Brogna, A. Bulgarelli, and et al, in Space Telescopes and Instrumentation 2016: Ultraviolet to Gamma Ray, Proc. SPIE, Vol. 9905 (2016) p. 99052N, arXiv:1608.03739 [astro-ph.IM] .
- Rees and Gunn (1974) M. J. Rees and J. E. Gunn, MNRAS 167, 1 (1974).
- Kirk et al. (2009) J. G. Kirk, Y. Lyubarsky, and J. Petri, in Astrophysics and Space Science Library, Astrophysics and Space Science Library, Vol. 357, edited by W. Becker (2009) p. 421, arXiv:astro-ph/0703116 .
- Usov (1975) V. V. Usov, Astrophysics & Space Science 32, 375 (1975).
- Arka and Kirk (2012) I. Arka and J. G. Kirk, Astrophys. J. 745, 108 (2012), arXiv:1109.2756 [astro-ph.HE] .
- Coroniti (1990) F. V. Coroniti, Astrophys. J. 349, 538 (1990).
- Lyubarsky and Kirk (2001) Y. Lyubarsky and J. G. Kirk, Astrophys. J. 547, 437 (2001), arXiv:astro-ph/0009270 .
- Kirk and Skjæraasen (2003) J. G. Kirk and O. Skjæraasen, Astrophys. J. 591, 366 (2003), arXiv:astro-ph/0303194 .
- Zrake (2016) J. Zrake, Astrophys. J. 823, 39 (2016), arXiv:1512.05426 [astro-ph.HE] .
- Spruit and Drenkhahn (2004) H. C. Spruit and G. D. Drenkhahn, in Gamma-Ray Bursts in the Afterglow Era, Astronomical Society of the Pacific Conference Series, Vol. 312, edited by M. Feroci, F. Frontera, N. Masetti, and L. Piro (2004) p. 537, astro-ph/0302468 .
- Kirk and Mochol (2011) J. G. Kirk and I. Mochol, Astrophys. J. 729, 104 (2011), and Astrophys. J. 736, 165 (2011), arXiv:1012.0307 [astro-ph.HE] .
- Porth et al. (2017) O. Porth, R. Buehler, B. Olmi, S. Komissarov, A. Lamberts, E. Amato, Y. Yuan, and A. Rudy, Space Science Reviews 207, 137 (2017), arXiv:1703.05184 [astro-ph.HE] .
- Olmi et al. (2015) B. Olmi, L. Del Zanna, E. Amato, and N. Bucciantini, MNRAS 449, 3149 (2015), arXiv:1502.06394 [astro-ph.HE] .
- Bucciantini et al. (2011) N. Bucciantini, J. Arons, and E. Amato, MNRAS 410, 381 (2011), arXiv:1005.1831 [astro-ph.HE] .
- Hester et al. (2002) J. J. Hester, K. Mori, D. Burrows, J. S. Gallagher, J. R. Graham, M. Halverson, A. Kader, F. C. Michel, and P. Scowen, ApJ 577, L49 (2002).
- Tchekhovskoy et al. (2016) A. Tchekhovskoy, A. Philippov, and A. Spitkovsky, MNRAS 457, 3384 (2016), arXiv:1503.01467 [astro-ph.HE] .
- Porth et al. (2016) O. Porth, M. J. Vorster, M. Lyutikov, and N. E. Engelbrecht, MNRAS 460, 4135 (2016), arXiv:1604.03352 [astro-ph.HE] .
- Levinson and Segev (2017) A. Levinson and N. Segev, ArXiv e-prints (2017), arXiv:1709.09397 [astro-ph.HE] .
- Fermi LAT Collaboration et al. (2015) Fermi LAT Collaboration, M. Ackermann, A. Albert, L. Baldini, J. Ballet, G. Barbiellini, C. Barbieri, D. Bastieri, R. Bellazzini, and et al, Science 350, 801 (2015).
- Kargaltsev and Pavlov (2008) O. Kargaltsev and G. G. Pavlov, in 40 Years of Pulsars: Millisecond Pulsars, Magnetars and More, American Institute of Physics Conference Series, Vol. 983, edited by C. Bassa, Z. Wang, A. Cumming, and V. M. Kaspi (2008) pp. 171–185, arXiv:0801.2602 .
- Saito et al. (2017) S. Saito, D. Khangulyan, K. Hagiwara, and Y. Uchiyama, in 6th International Symposium on High Energy Gamma-Ray Astronomy, American Institute of Physics Conference Series, Vol. 1792 (2017) p. 040013.