Classification of extremely metal-poor stars: absent region in - plane and the role of dust cooling
Abstract
Extremely metal-poor (EMP) stars are the living fossils with records of chemical enrichment history at the early epoch of galaxy formation. By the recent large observation campaigns, statistical samples of EMP stars have been obtained. This motivates us to reconsider their classification and formation conditions. From the observed lower-limits of carbon and iron abundances of and for C-enhanced EMP (CE-EMP) and C-normal EMP (CN-EMP) stars, we confirm that gas cooling by dust thermal emission is indispensable for the fragmentation of their parent clouds to form such low-mass, i.e., long-lived stars, and that the dominant grain species are carbon and silicate, respectively. We constrain the grain radius of a species and condensation efficiency of a key element as and to reproduce and , which give a universal condition for the formation of every EMP star. Instead of the conventional boundary between CE- and CN-EMP stars, this condition suggests a physically meaningful boundary above and below which carbon and silicate grains are dominant coolants, respectively.
keywords:
dust, extinction — galaxies: evolution — ISM: abundances — stars: formation — stars: low-mass — stars: Population II
1 INTRODUCTION
Long-lived stars with metallicities lower than our neighborhood, so-called metal-poor (MP) stars, are discovered in our Galaxy and nearby dwarf galaxies. They are intensively studied as the clues to know the chemical evolution during the structure formation. This approach is called Galactic archeology or near-field cosmology. MP stars are classified into carbon-enhanced MP (CEMP) and carbon-normal MP (CNMP) stars, divided at the boundary conventionally defined as (Beers & Christlieb, 2005; Aoki et al., 2007).111The ratio between abundances of elements and are expressed as and for an element , where denotes the number fraction of relative to hydrogen nuclei. CEMP stars are further divided into CEMP-no without the enhancement of neutron-capture elements, and CEMP-r or -s with r- or s-process element enhancement, respectively (Beers & Christlieb, 2005).
By recent large observational campaigns,222e.g., the HK (Beers et al., 1985, 1992), Hamburg/ESO (Christlieb, 2003), SEGUE (Yanny et al., 2009), and LAMOST survey (Cui et al., 2012; Deng et al., 2012). we can access the statistical samples of MP stars. Yoon et al. (2016) report that CEMP stars are apparently subdivided into three groups on the - plane (Figure 1). While CEMP Group I stars residing in and are dominantly CEMP-s stars, Group II (with and ) and Group III (with and ) stars are mainly CEMP-no stars. Since almost all Group I stars show binary feature, they are considered to have acquired the gas rich with C and -capture elements from their evolved companions (Suda et al., 2004). On the other hand, the physical explanation of distinction between Group II and III stars has not been made so far.
MP stars with including CEMP Group II and III stars are particularly called extremely metal-poor (EMP) stars. The lower-limits of their elemental abundances indicate the existence of the critical metallicity above which their parent clouds become unstable to fragment into small gas clumps through efficient gas cooling by heavy elements so that low-mass stars which survive until the present day are likely to be formed (Bromm & Loeb, 2003; Frebel et al., 2005). Recent theoretical studies have shown that cooling by dust thermal emission is crucial to form low-mass fragments with (Omukai, 2000; Schneider et al., 2003).
Marassi et al. (2014) and Chiaki et al. (2015) predict that dust grains are important commonly for the formation of C-enhanced EMP (CE-EMP) and C-normal EMP (CN-EMP) stars. They show that the dominant grain species are carbon and silicate, respectively, and estimate the critical C and Si abundances. However, they resort to theoretical models of grain formation because the properties of grains such as radius and condensation efficiency can not be directly measured. Further, their analyses are based on the conventional classification of EMP stars, and do not explain the difference between Group II and III stars.
In this Letter, we reconsider the classification and formation conditions of EMP stars. From Figure 1, we point out three interesting features; (1) no EMP stars have so far been observed in the region of and , (2) Group III and II stars are distributed in the regions with high () and moderate () C-enhancement, respectively, and (3) the distribution of Group II stars appears continuously connected with CN-EMP stars.
We derive grain properties of carbon and silicate from the feature (1), and then present a formation condition applicable to every EMP star. Comparing the contributions of carbon and silicate grains to gas cooling, we propose the physically motivated boundary between EMP stars whose formation could be derived mainly by carbon and silicate grains. This boundary can simultaneously explain the features (2) and (3). Throughout this Letter, we use the solar abundance of Asplund et al. (2009) as , , and .
2 Critical elemental abundances
The critical condition for cloud fragmentation can be described by the comparison of gas cooling owing to dust thermal emission with gas compressional heating (Schneider et al., 2012). With condensation efficiency of a key element onto a grain species and a characteristic grain radius , the fragmentation condition can be written using the number abundance as
| (1) |
where denotes the molecular weight of a monomer, and is the bulk density of a grain (Chiaki et al., 2015).333 We here consider spherical grains. The radius is defined as characterizing the efficiency of gas cooling, where is the average of a physical quantity weighted by the size distribution of a grain species . Equation (1) is given at the gas density and temperature K where dust cooling is dominant over gas compressional heating in clouds with (Schneider et al., 2012). is the mass fraction of hydrogen nuclei, and throughout this Letter. This indicates that, once the key element and its abundance are specified, we can put a constraint on and in a form of , which we hereafter call the effective grain radius.
2.1 Critical C abundance and property of carbon grains
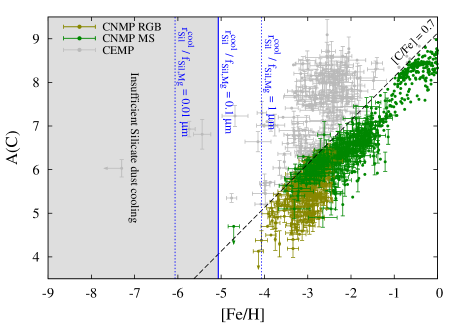
We first derive the effective radius for carbon grains. For carbon grains, the key element is carbon, and and . Then, from Equation (1), we can obtain the critical carbon abundance above which gas cooling by carbon grains exceeds gas compressional heating as
| (2) |
The horizontal red lines in the left panel of Figure 1 show the critical carbon abundances for , , and from bottom to top. CEMP Group III stars are distributed in a range of over a wide range of (). Hence, can be taken as the lower-limit of C abundances for CEMP Group III stars. Then, the effective grain radius is estimated to be . Taking the statistical uncertainties into consideration, we here adopt . Below the horizontal line corresponding to (shaded region in Figure 1), carbon dust cooling is inefficient to induce cloud fragmentation, and long-lived low-mass stars are unlikely to form. Some of CEMP Group II stars have lower carbon abundances than , which is discussed in the subsequent sections.
2.2 Critical Fe abundance and property of silicate grains
Next, we constrain the property of the other major grain species, silicate. For silicates, we consider enstatite () with its key element being Mg, and and . The result is unchanged for forsterite () whose key element is Si. From Equation (1), we can calculate the critical condition where gas cooling by silicate grains overcomes the compressional gas heating as
| (3) |
We convert this critical Mg abundance to the critical Fe abundance, using the average abundance ratio for stars with (from SAGA database), as
| (4) |
The vertical blue lines in the right panel of Figure 1 indicate the critical Fe abundances for , , and from left to right. To realize the critical abundance suggested by the distribution of CN-EMP stars, the effective grain radius is required. We set the fiducial value of the effective grain radius as , which is smaller than that of carbon grains by two orders of magnitude.
2.3 Combined criterion for CE- and CN-EMP star formation
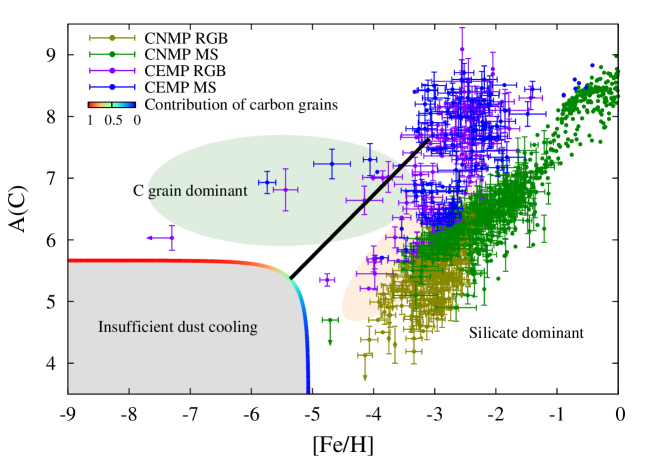
In the previous sections, we have considered separately the contributions of carbon and silicate grains to gas cooling, and derived their effective grain radii. In reality, both the grain species can contribute simultaneously to gas cooling in collapsing clouds. In this case, Equation (1) is reduced to
Using and derived in the previous sections gives
| (5) |
The critical condition is shown by the colored curve in Figure 2. The shaded region below the curve can successfully explain the region where no stars have been observed so far. Also, the figure suggests that the distribution of CEMP Group II stars shows the lower-limit of Fe abundance at as that of CN-EMP stars.
2.4 Boundary between CE- and CN-EMP stars
Equating the first and second terms in the left hand side of Equation (5), we can define the transition line on which the contributions of carbon and silicate grains to gas cooling are equal as
| (6) |
This condition is indicated by the black line in Figure 2 above which gas cooling by carbon grain is dominant over that by silicates. The boundary gives the physical explanation of the distinction between CEMP Group III and Group II stars.

3 Model calculations of grain properties in Pop III SN ejecta
We have shown that the effective grain radius of carbon must be larger than that of silicate by two orders of magnitude to reproduce the observed distributions of EMP stars. We in this section show this difference in grain radius with a dust formation model. In the early Universe, dust grains are mainly supplied by supernovae (SNe) arising from first-generation metal-free (Pop III) stars (Todini & Ferrara, 2001; Nozawa et al., 2003). While the elemental abundances of CE-EMP stars are well reproduced by faint core-collapse SNe (FSNe) with C enhancement due to large fallback of Fe peak elements, those of CN-EMP stars are reproduced by energetic core-collapse SNe (CCSNe) or hypernovae (HNe) (Umeda & Nomoto, 2003; Limongi & Chieffi, 2012; Marassi et al., 2014; Tominaga et al., 2014; Ishigaki et al., 2014).
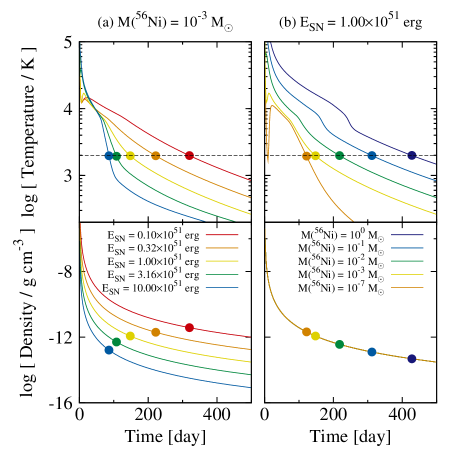
To estimate the properties of newly formed dust, we follow the temporal evolution of temperature and density of expanding SN ejecta with radiative transfer calculations including energy deposition from radioactive decay of 56Ni (Iwamoto et al., 2000). Applying the approximation formulae of Nozawa & Kozasa (2013), the average grain radius and condensation efficiency are calculated at each mass coordinate from the concentration of a key element and the cooling timescale at the onset time of dust formation when declines down to the condensation temperature (2000 K and 1500 K for carbon and silicate grains, respectively). A dominant fraction of grains will be formed at the mass coordinate where becomes largest because marks maximum there. We thus take as the fiducial value of the grain radius. At , turns to be . We take a progenitor model of the SN which reproduces the chemical composition of with an intermediate C-enhancement (Ishigaki14). The mass-cut is and progenitor mass is . The masses of C and Mg atoms are and , where is the mass of a hydrogen nucleus.
We first see the results for carbon grains. Since carbon grains are formed mainly in the layer rich with C, we set . Figure 3 shows the temporal evolutions of gas temperature and density. With a fixed 56Ni mass of , temperature and density for higher explosion energy decline more rapidly due to the higher expansion rate, and the time (indicated by circles) becomes earlier. With a fixed , temperature keeps higher, and becomes later for larger . Figure 4 shows the grain radius as a function of with various . For each , the grain radius is smaller for higher because the gas density is smaller at by more rapid expansion. For , declines rapidly with because is coincident with the finishing time of the plateau phase when the ejecta becomes optically thin and the temperature decline suddenly. With shorter cooling timescale, the larger number of grain seeds form, i.e, the radius of each grain becomes smaller.
With the same mass fraction , for carbon and silicate grains are similar for each and . However, in the formation region of silicate grains, Mg is dominated by O, and we set the fiducial value as , following nucleosynthesis calculations (Tominaga et al., 2014). With , the decreases by an order of magnitude for each and .
To reproduce the elemental abundance of the most iron-poor CE-EMP stars such as (Keller et al., 2014), and are favored (Marassi et al., 2014; Ishigaki et al., 2014). In our calculations, we estimate with and . The abundance ratio of the most metal-poor star (Caffau et al., 2011) is reproduced by HN models with and (Tominaga et al., 2014). We predict with , , and . These values are consistent with and .
4 Discussion
The observed lower-limits of C and Fe abundances of C-enhanced and C-normal EMP stars indicate that these stars form through the fragmentation of their parent clouds by gas cooling owing to thermal emission of two major grain species, carbon and silicate, respectively. We first derive the grain radius and condensation efficiency as and from the lower-limits of C and Fe abundances, respectively. The tendency that carbon grains are larger than silicates is qualitatively explained by our simple analyses of dust formation. Carbon grains grow more efficiently than silicate because the gas density remains higher at the time when temperature declines to the condensation temperature with the smaller and favored for CE-EMP stars, and because the mass fraction of C is higher than that of Mg in the dust formation region.
We can derive the critical condition for EMP star formation as Equation (5), which can well reproduce the region where no stars have so far been observed as indicated by the shaded region in Figure 2. Then, we find that the dominant coolant switches from carbon to silicate from above to below the boundary , which gives the physically motivated classification of CE- and CN-EMP stars. This simultaneously explain the discrimination of CEMP Group II and Group III stars (Yoon et al., 2016). Opposite to Group III stars, the dominant coolant for the formation of CEMP Group II stars is silicate grains as CN-EMP stars. Interestingly, the distribution of Group II stars is continuous with that of CN-EMP stars as indicated by Figure 2.
Our estimation of the effective grain radii is based on the observed elemental abundances of EMP stars. Our model presented in Section 3 predicts the larger values and for the fiducial cases. Although we here take the maximum grain radius at the corresponding mass coordinate , the mass fraction of smaller grains formed in other mass coordinates can non-negligible, and the average radius of grains will be smaller. Marassi et al. (2015) predict the smaller grain radii of by their grain formation models in FSN ejecta. It is still possible that stars with lower elemental abundances, which is permitted by smaller effective grain radii, are discovered by future observations. In the current state, although the number of samples in the Galactic halo is large ( stars), statistics of EMP stars with is still small (Hartwig et al., 2015). As the number of EMP stars increases by future observations, the accuracy of the estimation of grain property and the boundary between CE- and CN-EMP stars presented in this Letter will get improved.
acknowledgments
GC is supported by Research Fellowships of the Japan Society for the Promotion of Science (JSPS) for Young Scientists. This work is supported in part by the Grants-in-Aid for Young Scientists (S: 23224004) and for General Scientists (A: 16H02168, C: 26400223) by JSPS.
References
- Aoki et al. (2007) Aoki, W., Beers, T. C., Christlieb, N., et al. 2007, ApJ, 655, 492
- Asplund et al. (2009) Asplund, M., Grevesse, N., Sauval, A. J., & Scott, P. 2009, ARA&A, 47, 481
- Beers et al. (1985) Beers, T. C., Preston, G. W., & Shectman, S. A. 1985, AJ, 90, 2089
- Beers et al. (1992) Beers, T. C., Preston, G. W., & Shectman, S. A. 1992, AJ, 103, 1987
- Beers & Christlieb (2005) Beers, T. C., & Christlieb, N. 2005, ARA&A, 43, 531
- Bianchi & Schneider (2007) Bianchi, S., & Schneider, R. 2007, MNRAS, 378, 973
- Bromm & Loeb (2003) Bromm, V., & Loeb, A. 2003, Nat, 425, 812
- Caffau et al. (2011) Caffau, E., Bonifacio, P., François, P., et al. 2011, Nature, 477, 67
- Chiaki et al. (2015) Chiaki, G., Marassi, S., Nozawa, T., et al. 2015, MNRAS, 446, 2659
- Christlieb (2003) Christlieb, N. 2003, in Reviews in Modern Astronomy, Vol. 16, Reviews in Modern Astronomy, ed. R. E. Schielicke, 191
- Cui et al. (2012) Cui, X.-Q., Zhao, Y.-H., Chu, Y.-Q., et al. 2012, Research in Astronomy and Astrophysics, 12, 1197
- Deng et al. (2012) Deng, L.-C., Newberg, H. J., Liu, C., et al. 2012, Research in Astronomy and Astrophysics, 12, 735
- Frebel et al. (2005) Frebel, A., Aoki, W., Christlieb, N., et al. 2005, Nat, 434, 871
- Hartwig et al. (2015) Hartwig, T., Bromm, V., Klessen, R. S., & Glover, S. C. O. 2015, MNRAS, 447, 3892
- Ishigaki et al. (2014) Ishigaki, M. N., Tominaga, N., Kobayashi, C., & Nomoto, K. 2014, ApJ, 792, L32
- Iwamoto et al. (2000) Iwamoto, K., Nakamura, T., Nomoto, K., et al. 2000, ApJ, 534, 660
- Keller et al. (2014) Keller, S. C., Bessell, M. S., Frebel, A., et al. 2014, Nature, 506, 463
- Limongi & Chieffi (2012) Limongi, M., & Chieffi, A. 2012, ApJS, 199, 38
- Marassi et al. (2014) Marassi, S., Chiaki, G., Schneider, R., et al. 2014, ApJ, 794, 100
- Marassi et al. (2015) Marassi, S., Schneider, R., Limongi, M., et al. 2015, MNRAS, 454, 4250
- Nozawa et al. (2003) Nozawa, T., Kozasa, T., Umeda, H., Maeda, K., & Nomoto, K. 2003, ApJ, 598, 785
- Nozawa et al. (2007) Nozawa, T., Kozasa, T., Habe, A., et al. 2007, ApJ, 666, 955
- Nozawa & Kozasa (2013) Nozawa, T., & Kozasa, T. 2013, ApJ, 776, 24
- Omukai (2000) Omukai, K. 2000, ApJ, 534, 809
- Schneider et al. (2003) Schneider, R., Ferrara, A., Salvaterra, R., Omukai, K., & Bromm, V. 2003, Nature, 422, 869
- Schneider et al. (2012) Schneider, R., Omukai, K., Bianchi, S., & Valiante, R. 2012, MNRAS, 419, 1566
- Stacy & Bromm (2014) Stacy, A., & Bromm, V. 2014, ApJ, 785, 73
- Suda et al. (2004) Suda, T., Aikawa, M., Machida, M. N., Fujimoto, M. Y., & Iben, I., Jr. 2004, ApJ, 611, 476
- Suda et al. (2008) Suda, T., Katsuta, Y., Yamada, S., et al. 2008, PASJ, 60, 1159
- Suda et al. (2011) Suda, T., Yamada, S., Katsuta, Y., et al. 2011, MNRAS, 412, 843
- Suda et al. (2017) Suda, T., Hidaka, J., Aoki, W., et al. 2017, arXiv:1703.10009
- Todini & Ferrara (2001) Todini, P., & Ferrara, A. 2001, MNRAS, 325, 726
- Tominaga et al. (2014) Tominaga, N., Iwamoto, N., & Nomoto, K. 2014, ApJ, 785, 98
- Umeda & Nomoto (2003) Umeda, H., & Nomoto, K. 2003, Nature, 422, 871
- Yamada et al. (2013) Yamada, S., Suda, T., Komiya, Y., Aoki, W., & Fujimoto, M. Y. 2013, MNRAS, 436, 1362
- Yanny et al. (2009) Yanny, B., Rockosi, C., Newberg, H. J., et al. 2009, AJ, 137, 4377-4399
- Yoon et al. (2016) Yoon, J., Beers, T. C., Placco, V. M., et al. 2016, arXiv:1607.06336