Proceedings of the Fifth Annual LHCP CMS CR-2017/322
Top Quark Decay Properties
Prolay Kumar Mal
(On behalf of the ATLAS & CMS Collaborations)
School of Physical Sciences
National Institute of Science Education and Research
Bhimpur-Padanpur (Jatni), Dist Khurda, Odisha 752050, India
ABSTRACT
Due to the large production cross-section, many of the top quark properties can be measured very precisely at the LHC. A very few recent results, probed only through the top quark decay vertices are presented here. These results are based on proton-proton collision datasets recorded by the ATLAS and CMS experiments at =7, 8 and 13 TeV. All the measurements and observed limits are consistent with the Standard Model (SM) predictions, while strong bounds on anomalous Wtb couplings are established.
PRESENTED AT
The Fifth Annual Conference
on Large Hadron Collider Physics
Shanghai Jiao Tong University, Shanghai, China
May 15-20, 2017
1 Introduction
Measurement of top quark properties is one of unique ways to scrutinize the Standard Model (SM) predictions thoroughly, along with the possibility to probe new physics signature. At the LHC, the top quarks are produced through strong and electroweak processes at an unprecedented rate [3] and such a large statistics of top quark events provides the opportunity to explore both production and decay vertices. While the measurements directly related to the production mechanism are reported in a separate article (in this set of conference proceedings), this proceeding focuses only on the decay properties covering only a few recent results from the ATLAS[1] and CMS[2] experiments: W-boson helicity measurement, top quark decay width, top quark branching fraction (considering only the Flavor Changing Charge Current decays‡‡‡Flavor Changing Neutral Current decays or FCNC and other rare decays are discussed in another article in this set of proceedings) and anomalous Wtb coupling. These results are based on the proton-proton collision datasets at =7, 8 and 13 TeV recorded during 2011, 2012 and 2016 LHC operations respectively.
2 W-boson helicity
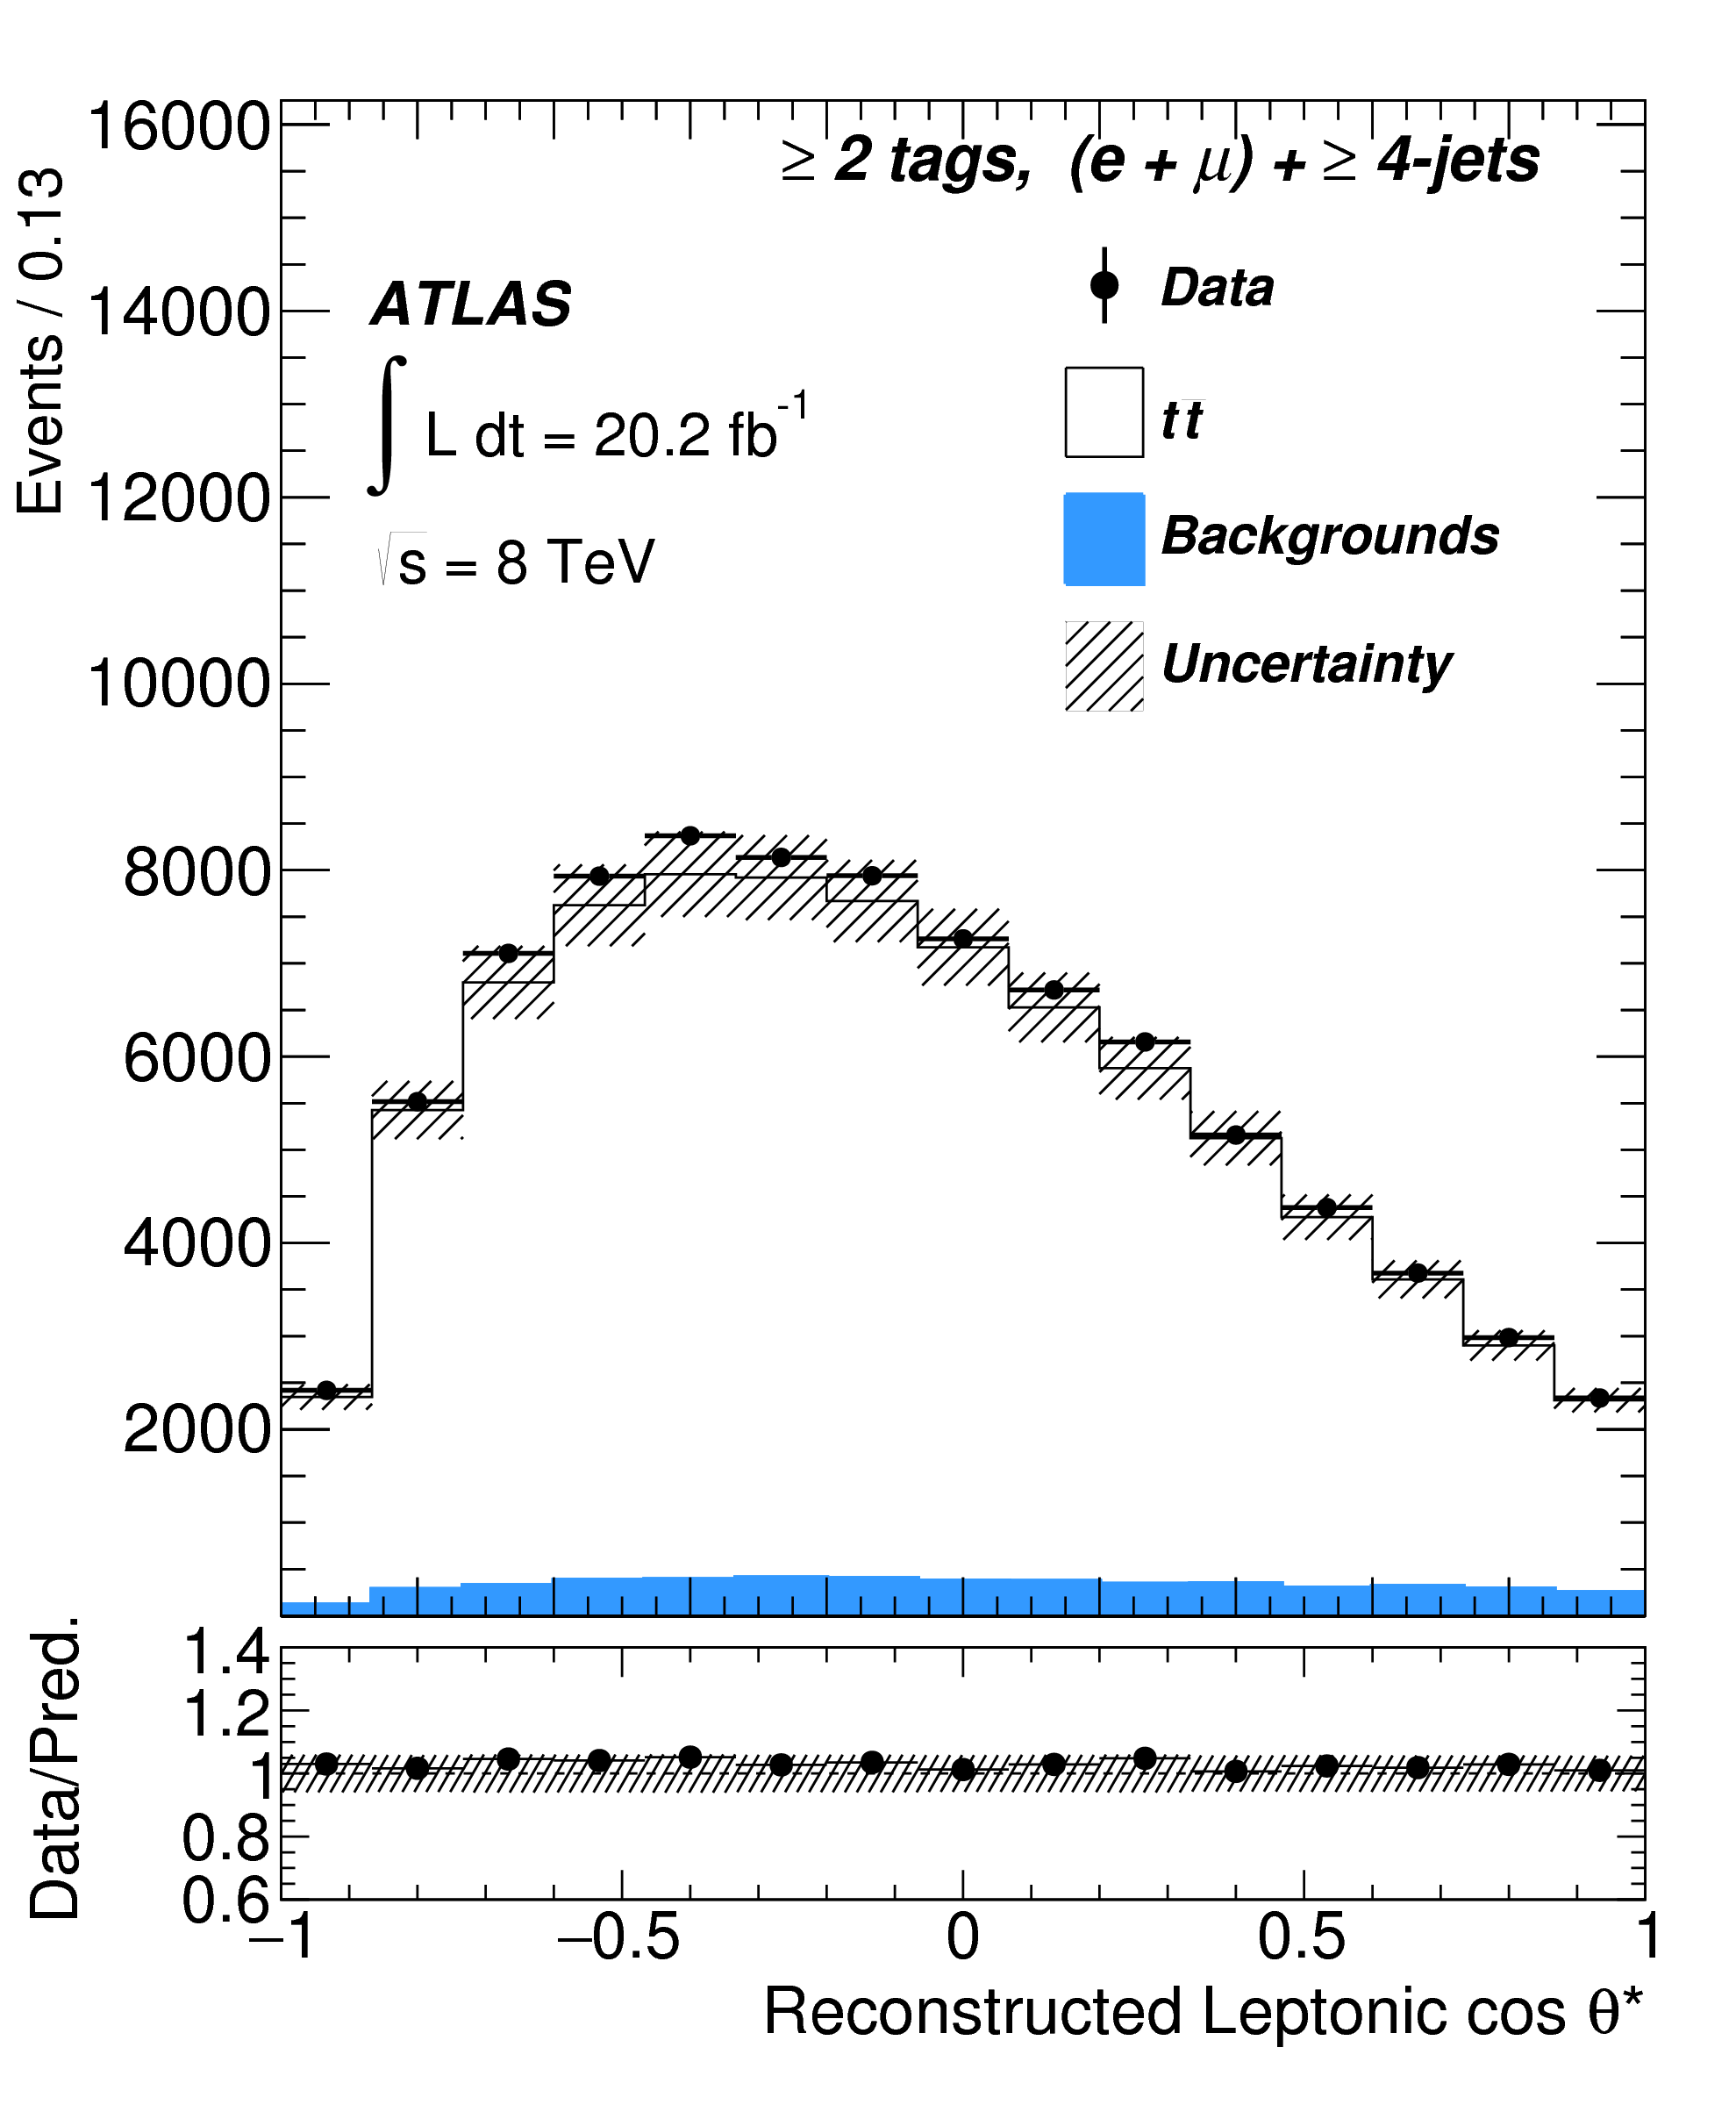
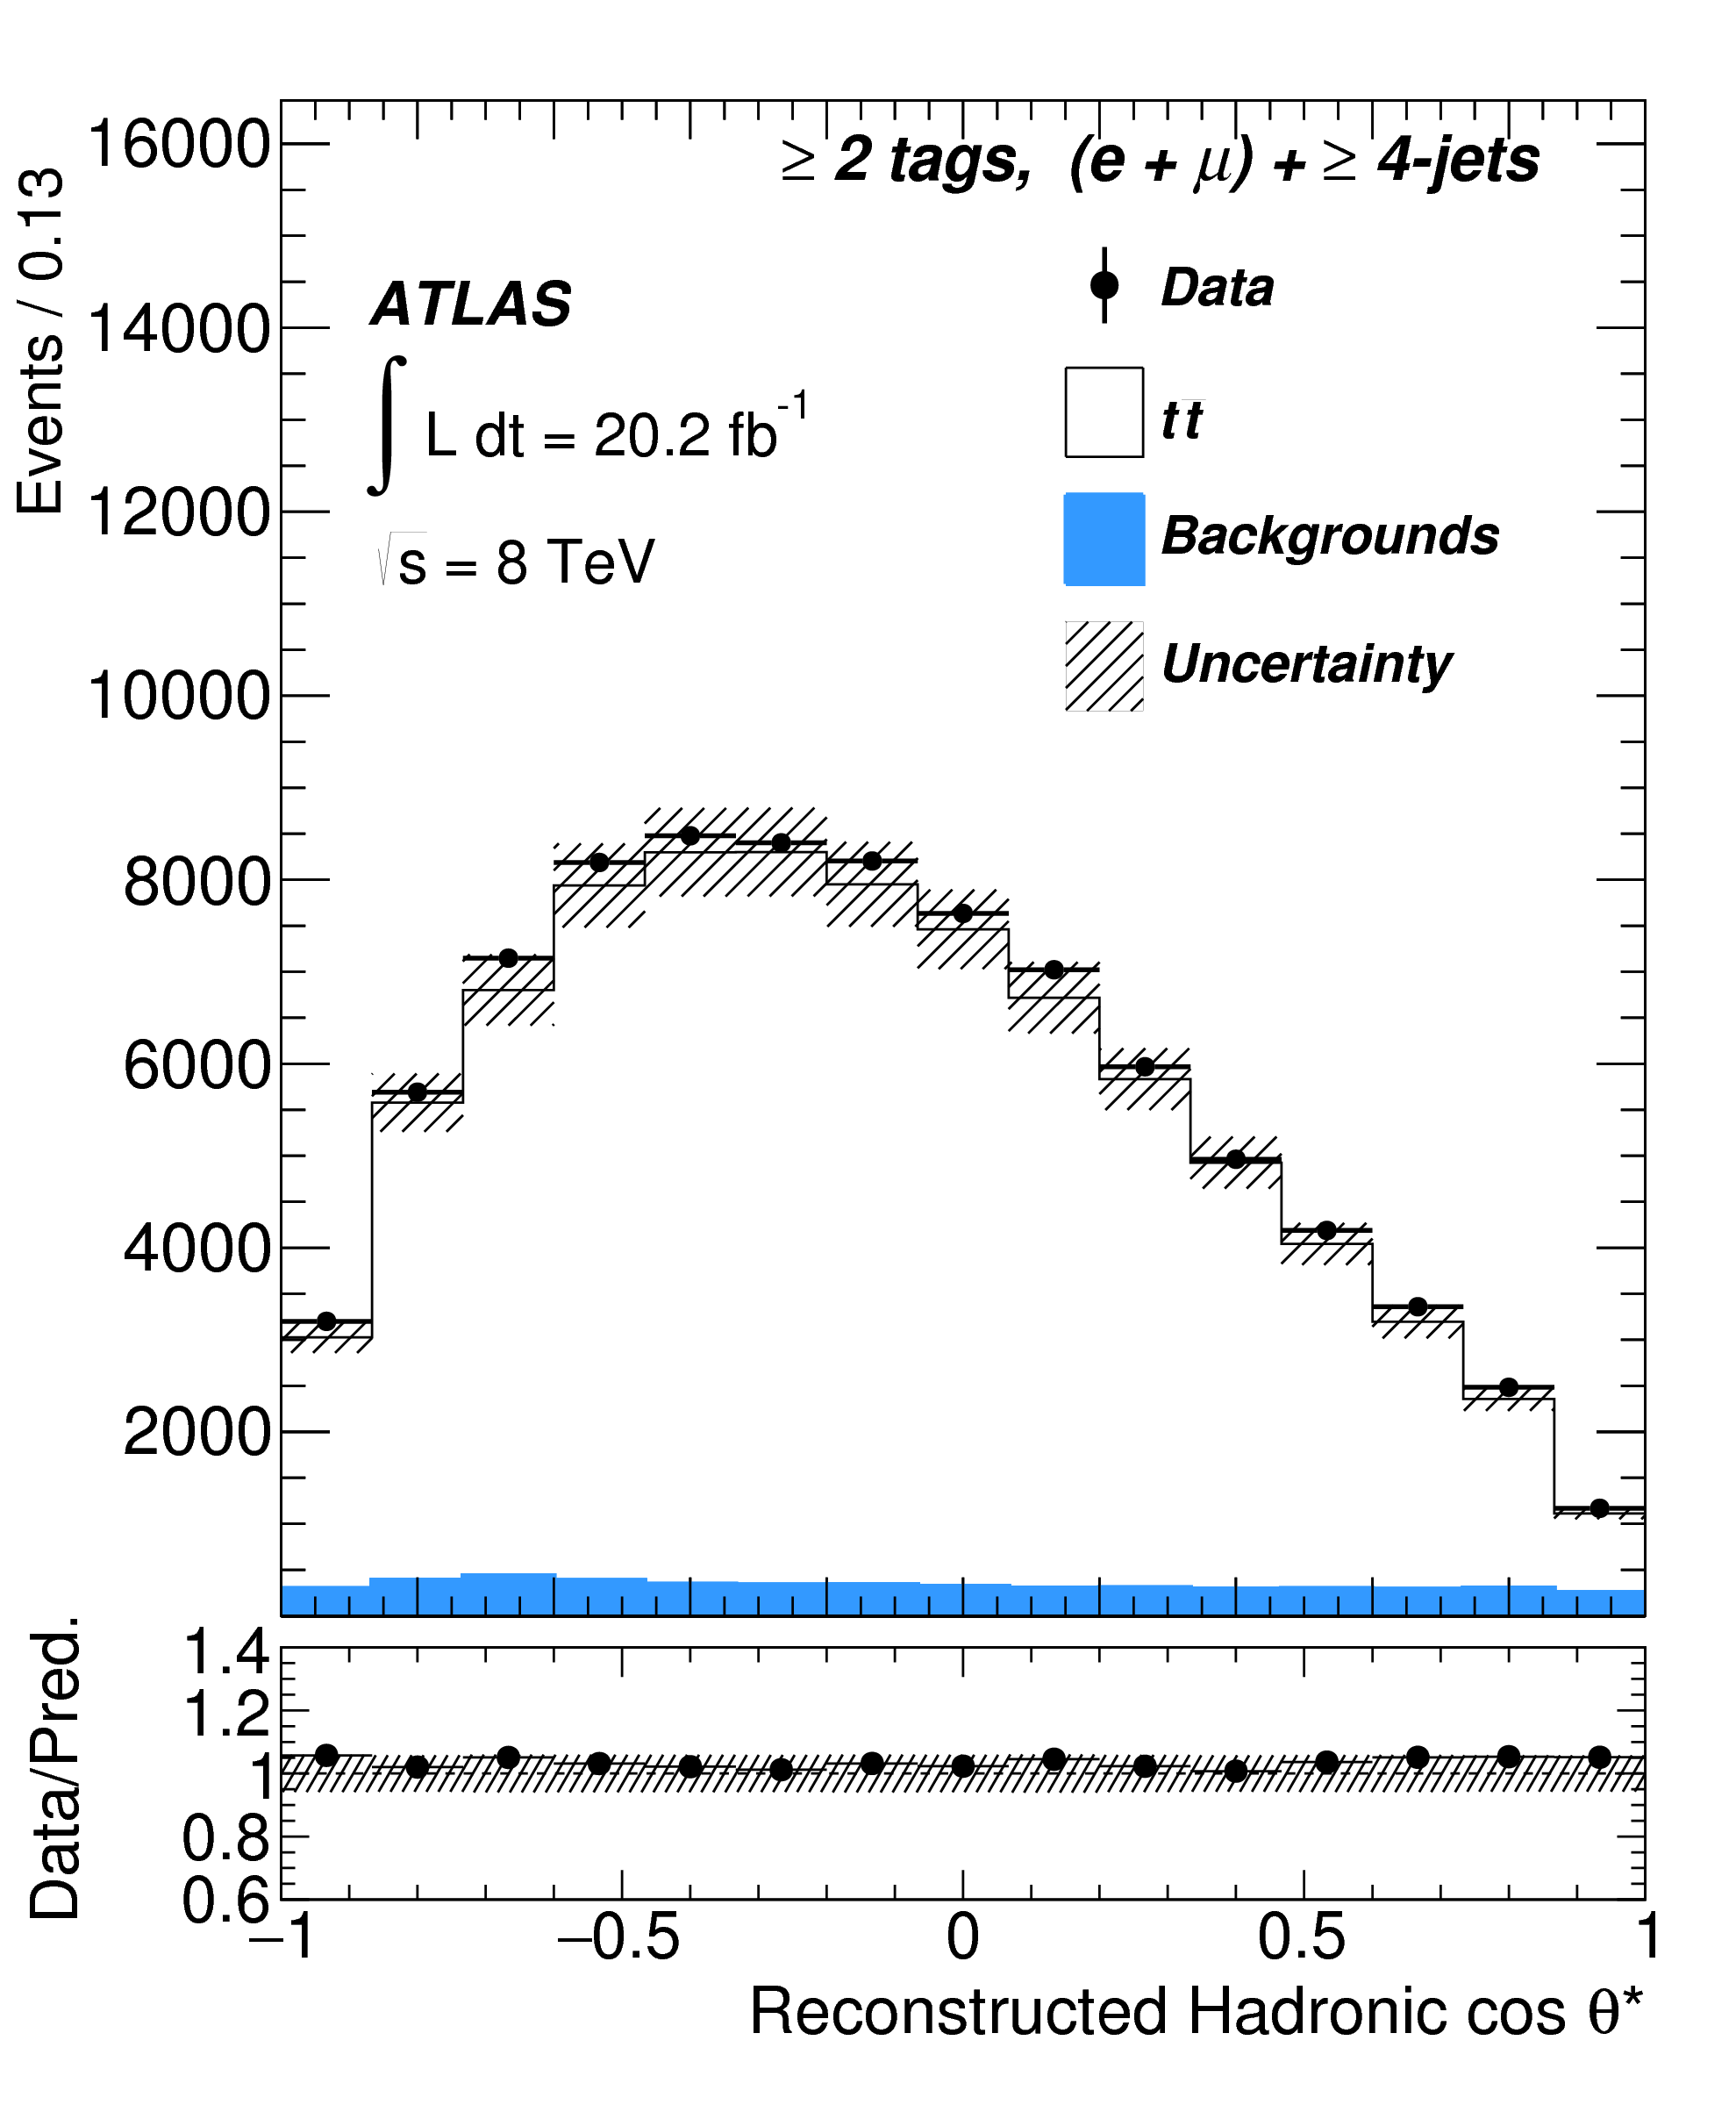
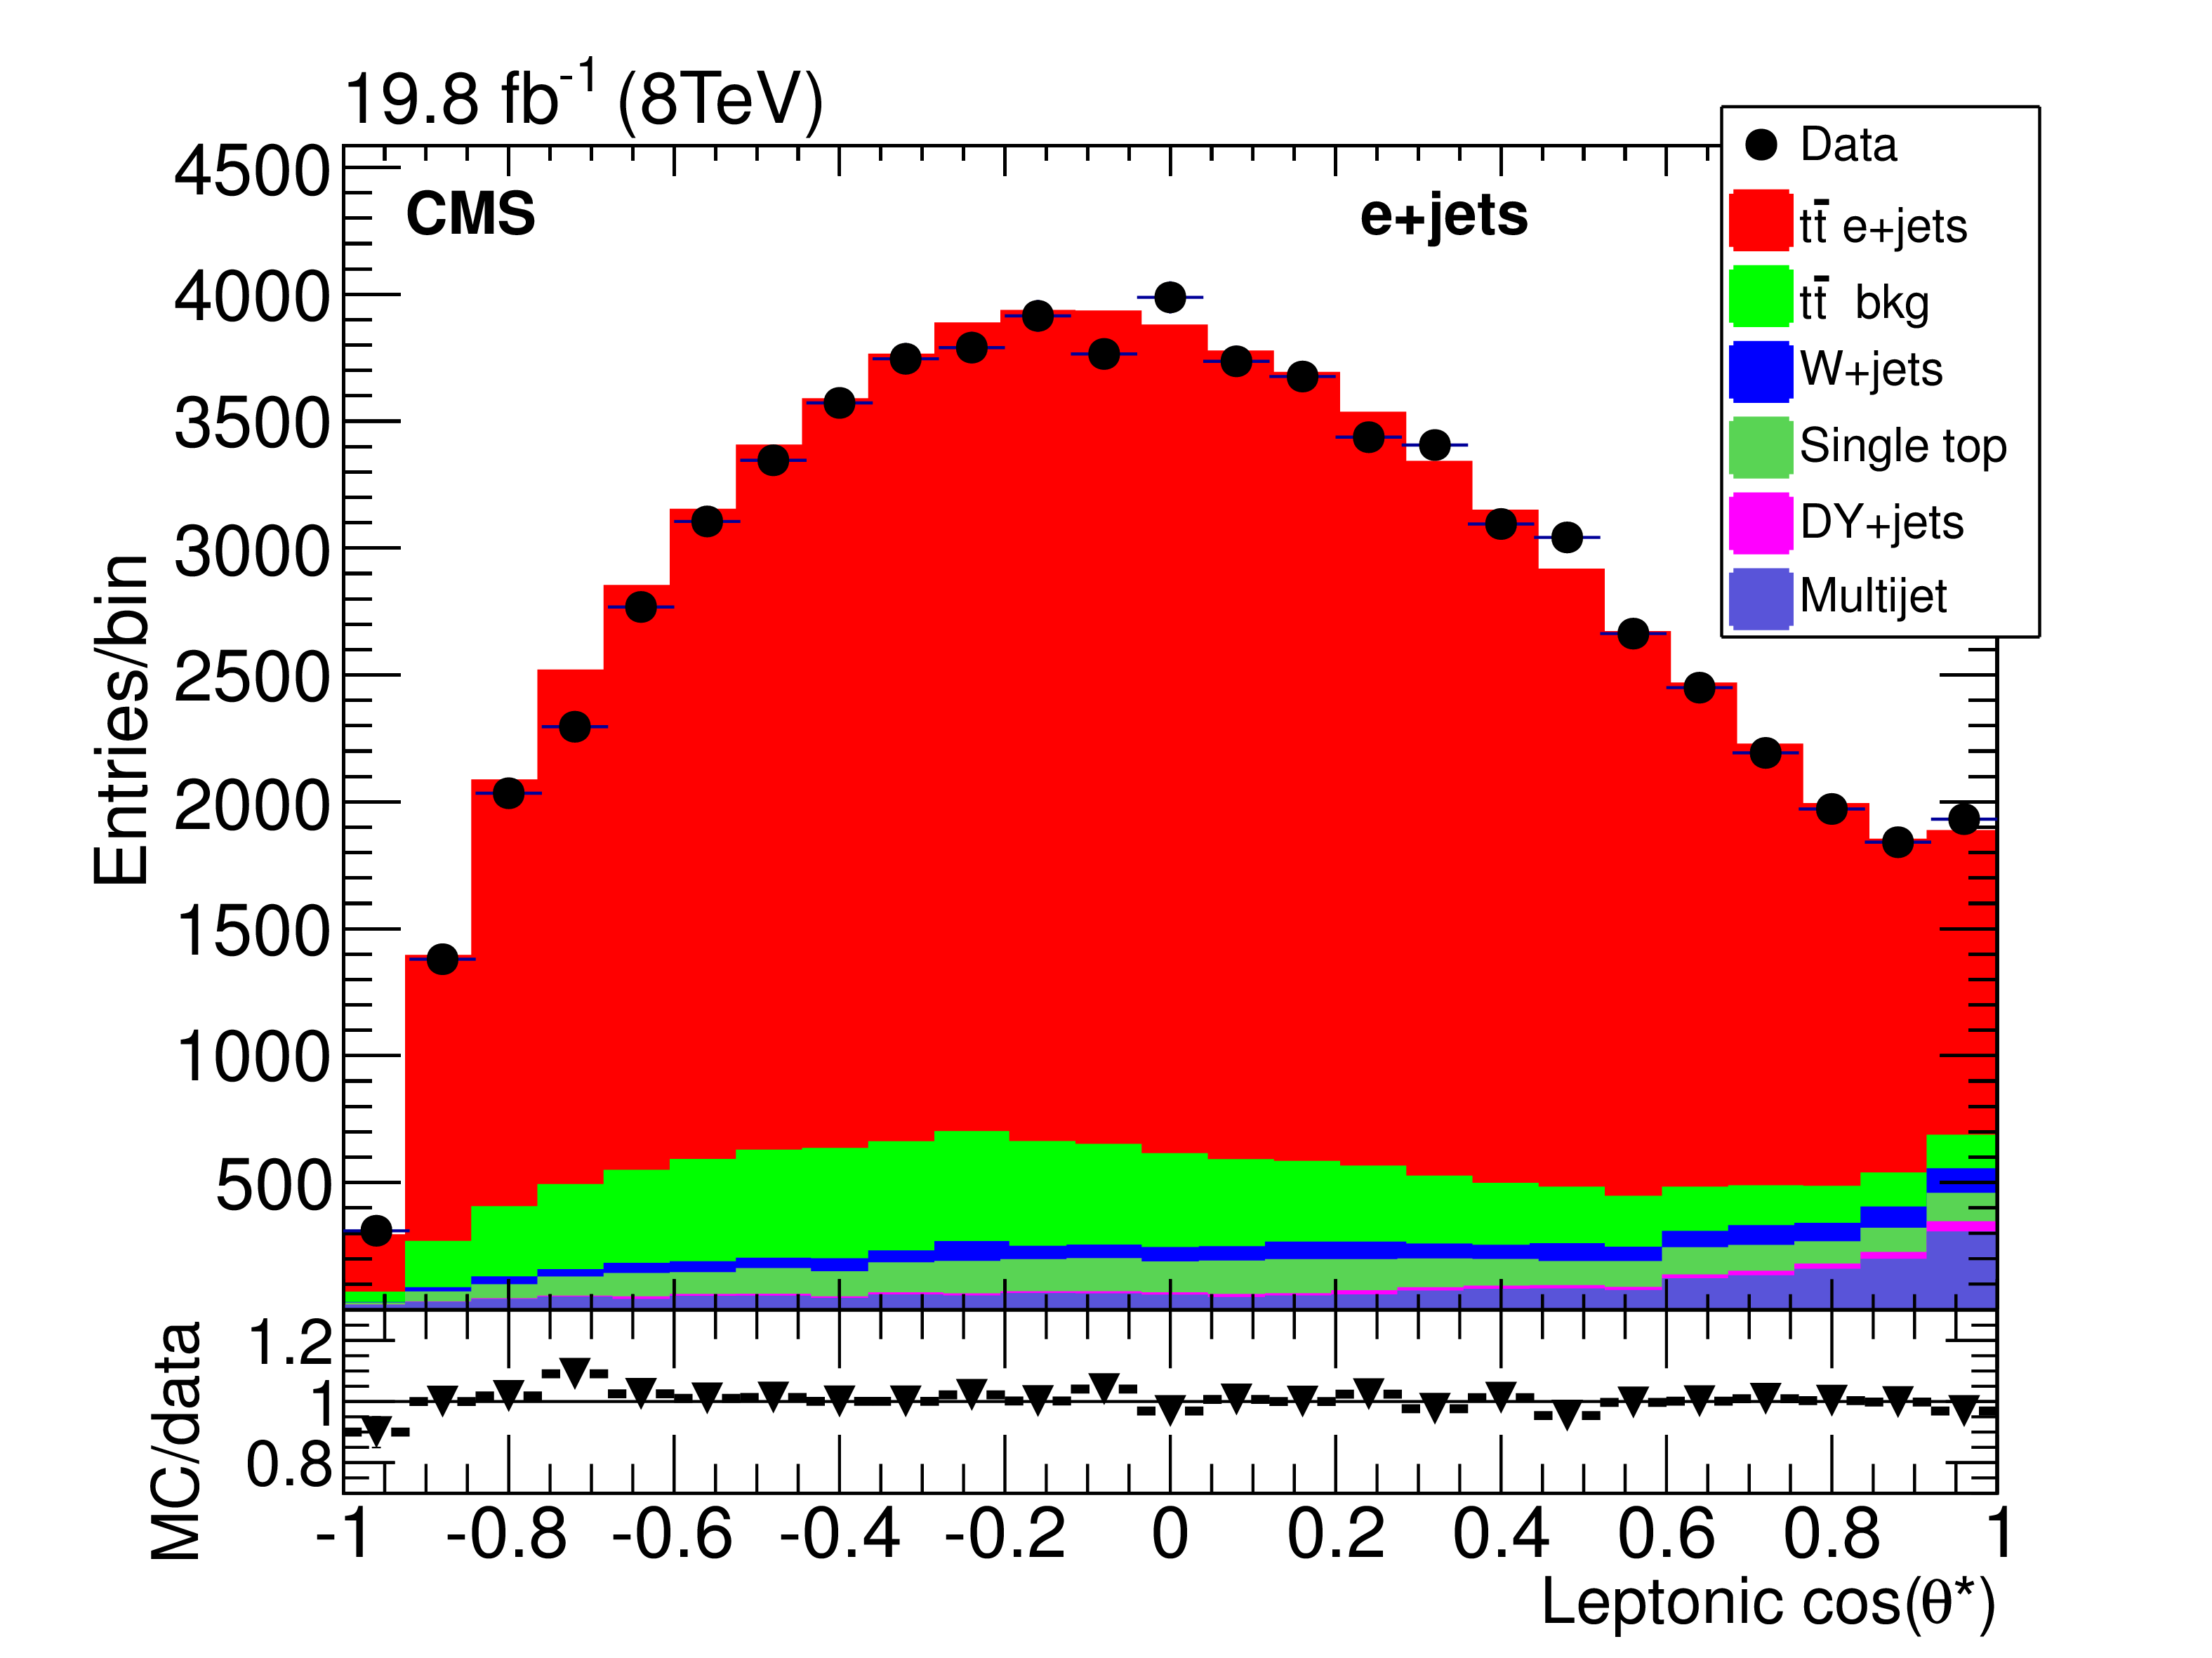
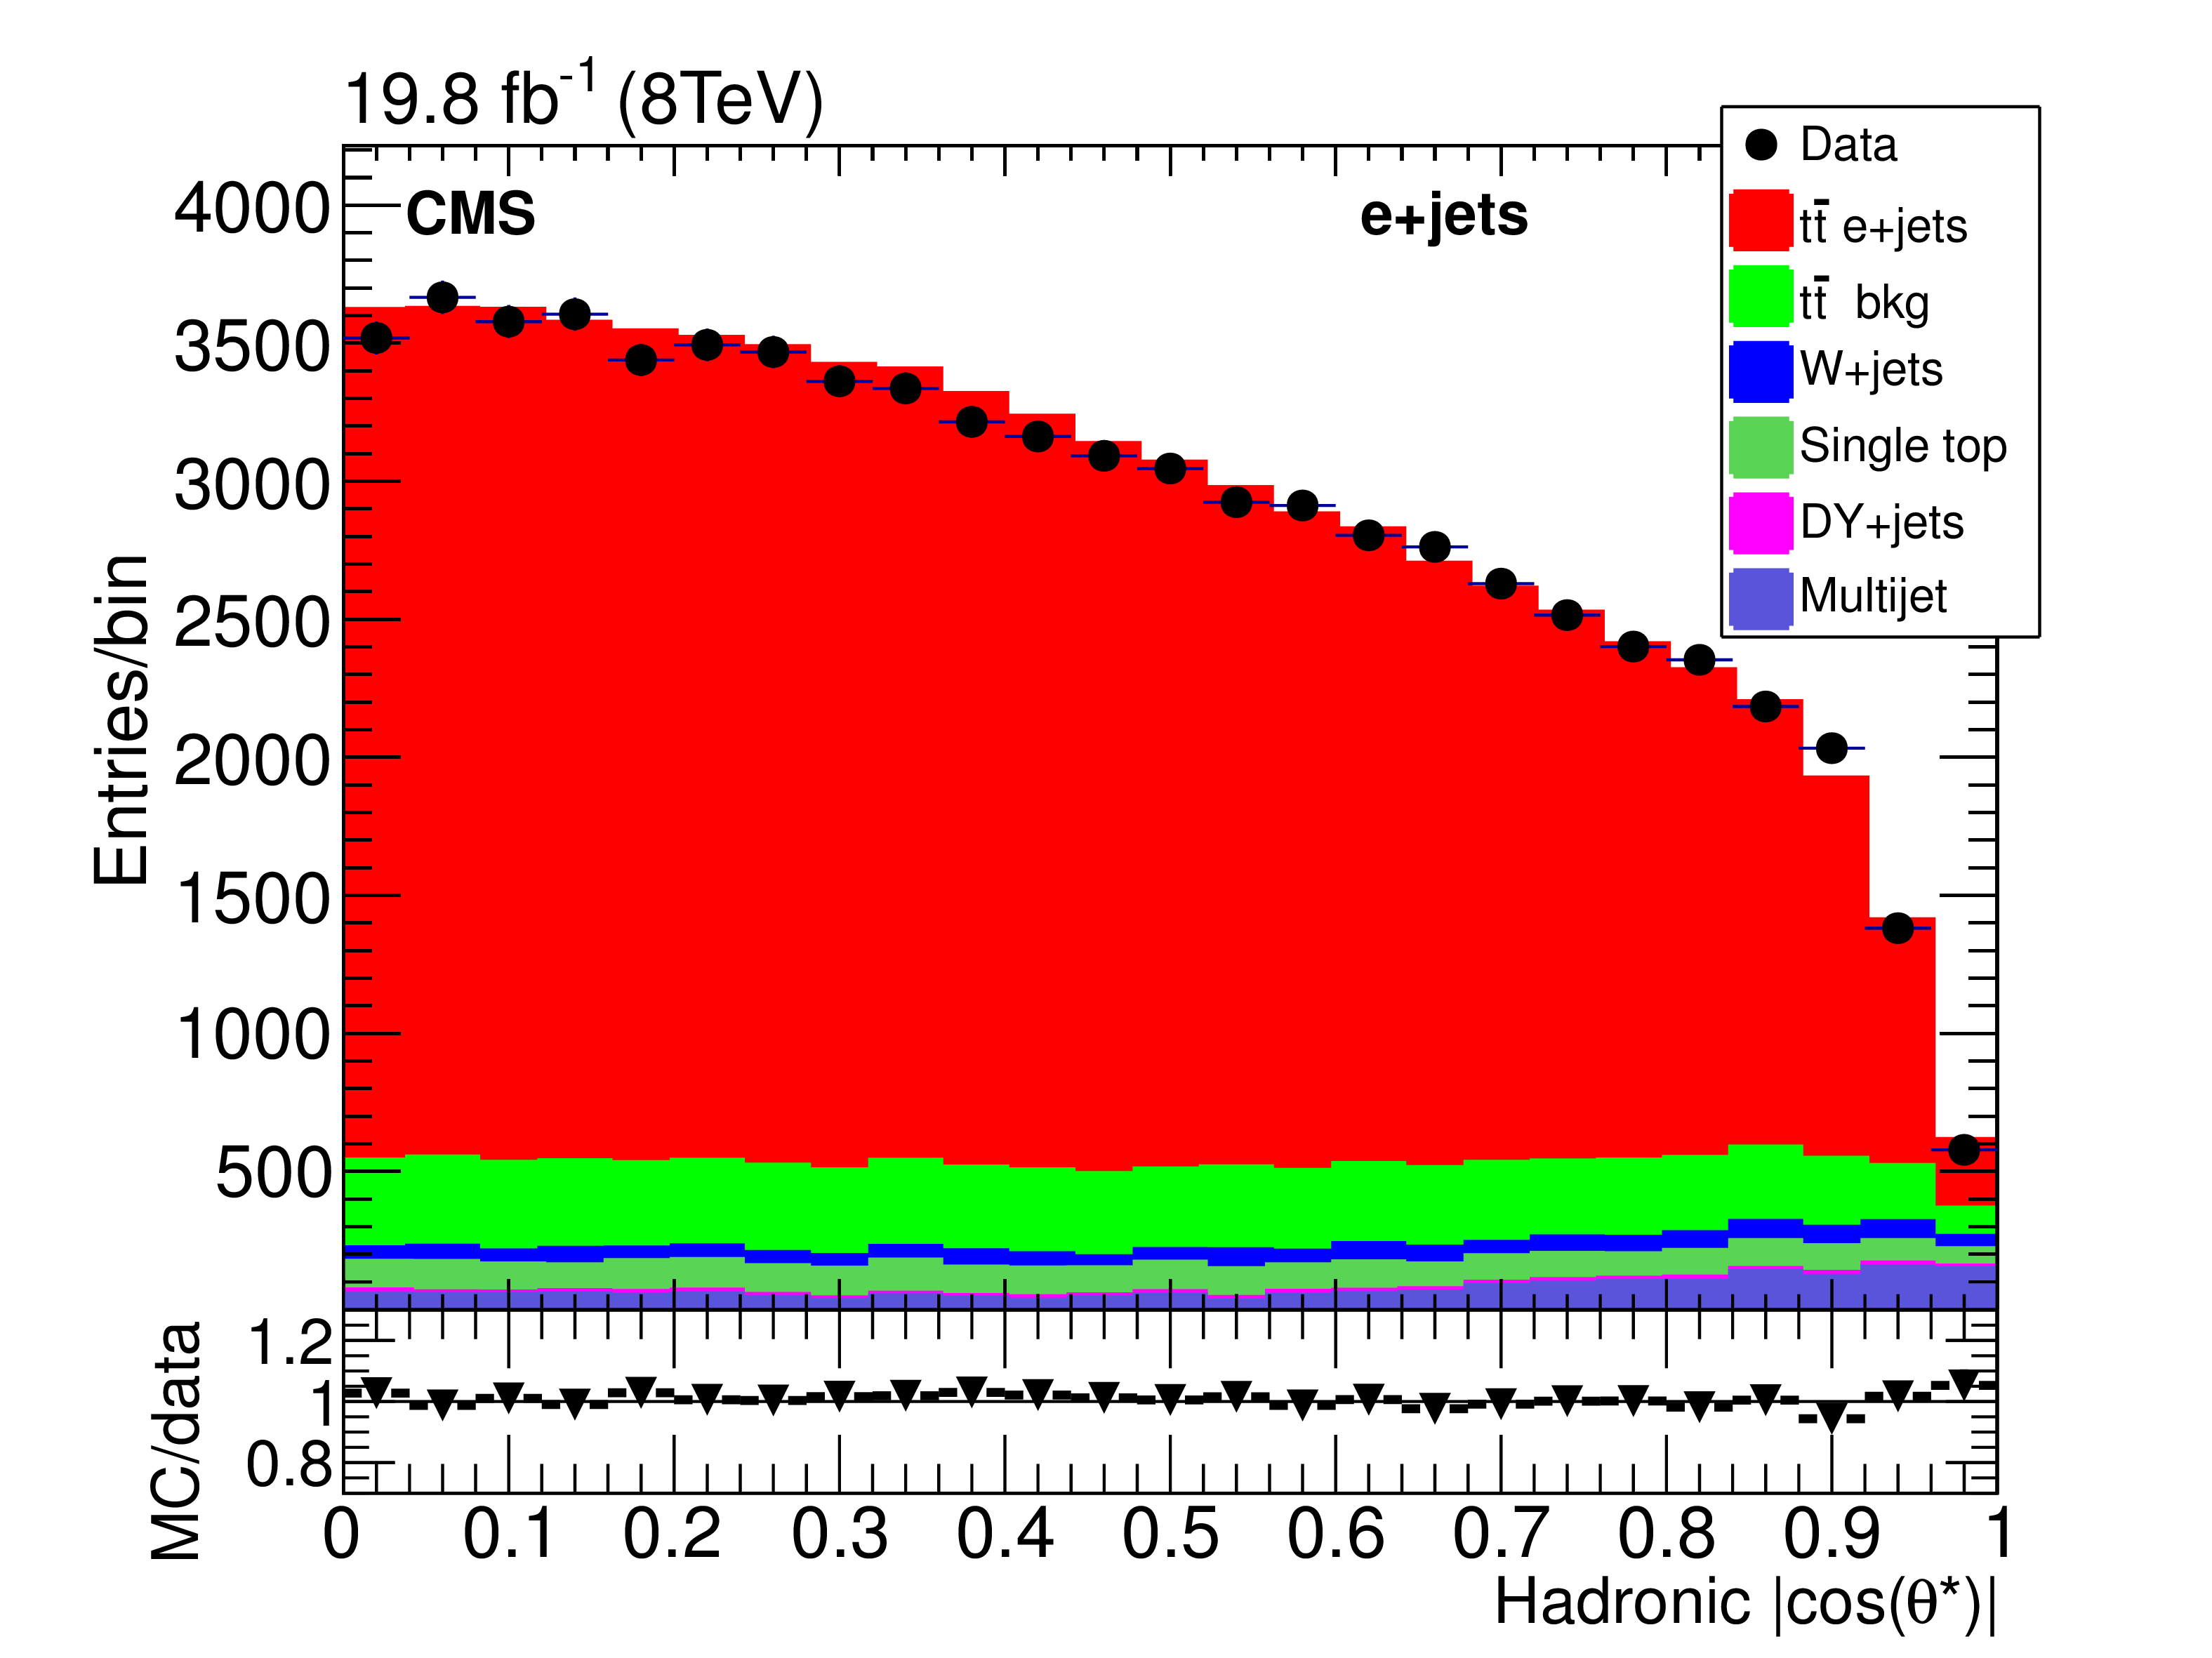
Within the SM the top quarks decays into a W-boson and a b-quark with almost 100% branching fraction and the polarization of the W-boson can be measured using the events. The W-boson helicity fractions (left-handed, right-handed and longitudinal) are defined as , where are the partial decay widths in left-handed, right-handed, and longitudinal helicity states respectively, with being the total decay width. The SM next-tonext-to-leading order (NNLO) calculations [4] including the electroweak effects predict the values of , and , for a top quark mass of GeV. Experimentally, the helicity angle can be defined as the angle between the direction of either the down-type quark or the charged lepton arising from the W-boson decay and the reversed direction of the top quark, both in the rest frame of the W-boson. The differential cross-sections as a function of can then be written as
ATLAS (CMS) have performed the measurements using lepton+jets events based on 20.2 (19.8 ) dataset from 2012 LHC operations. The observables for W-boson helicity fractions i.e., ‘’ are reconstructed using the leptonic () and hadronic () decay branches of the top quark, and the distributions are shown in Fig. 1. The CMS measurements [5] result in , and , while the ATLAS measurements[6] quote , and .
3 Top quark decay width
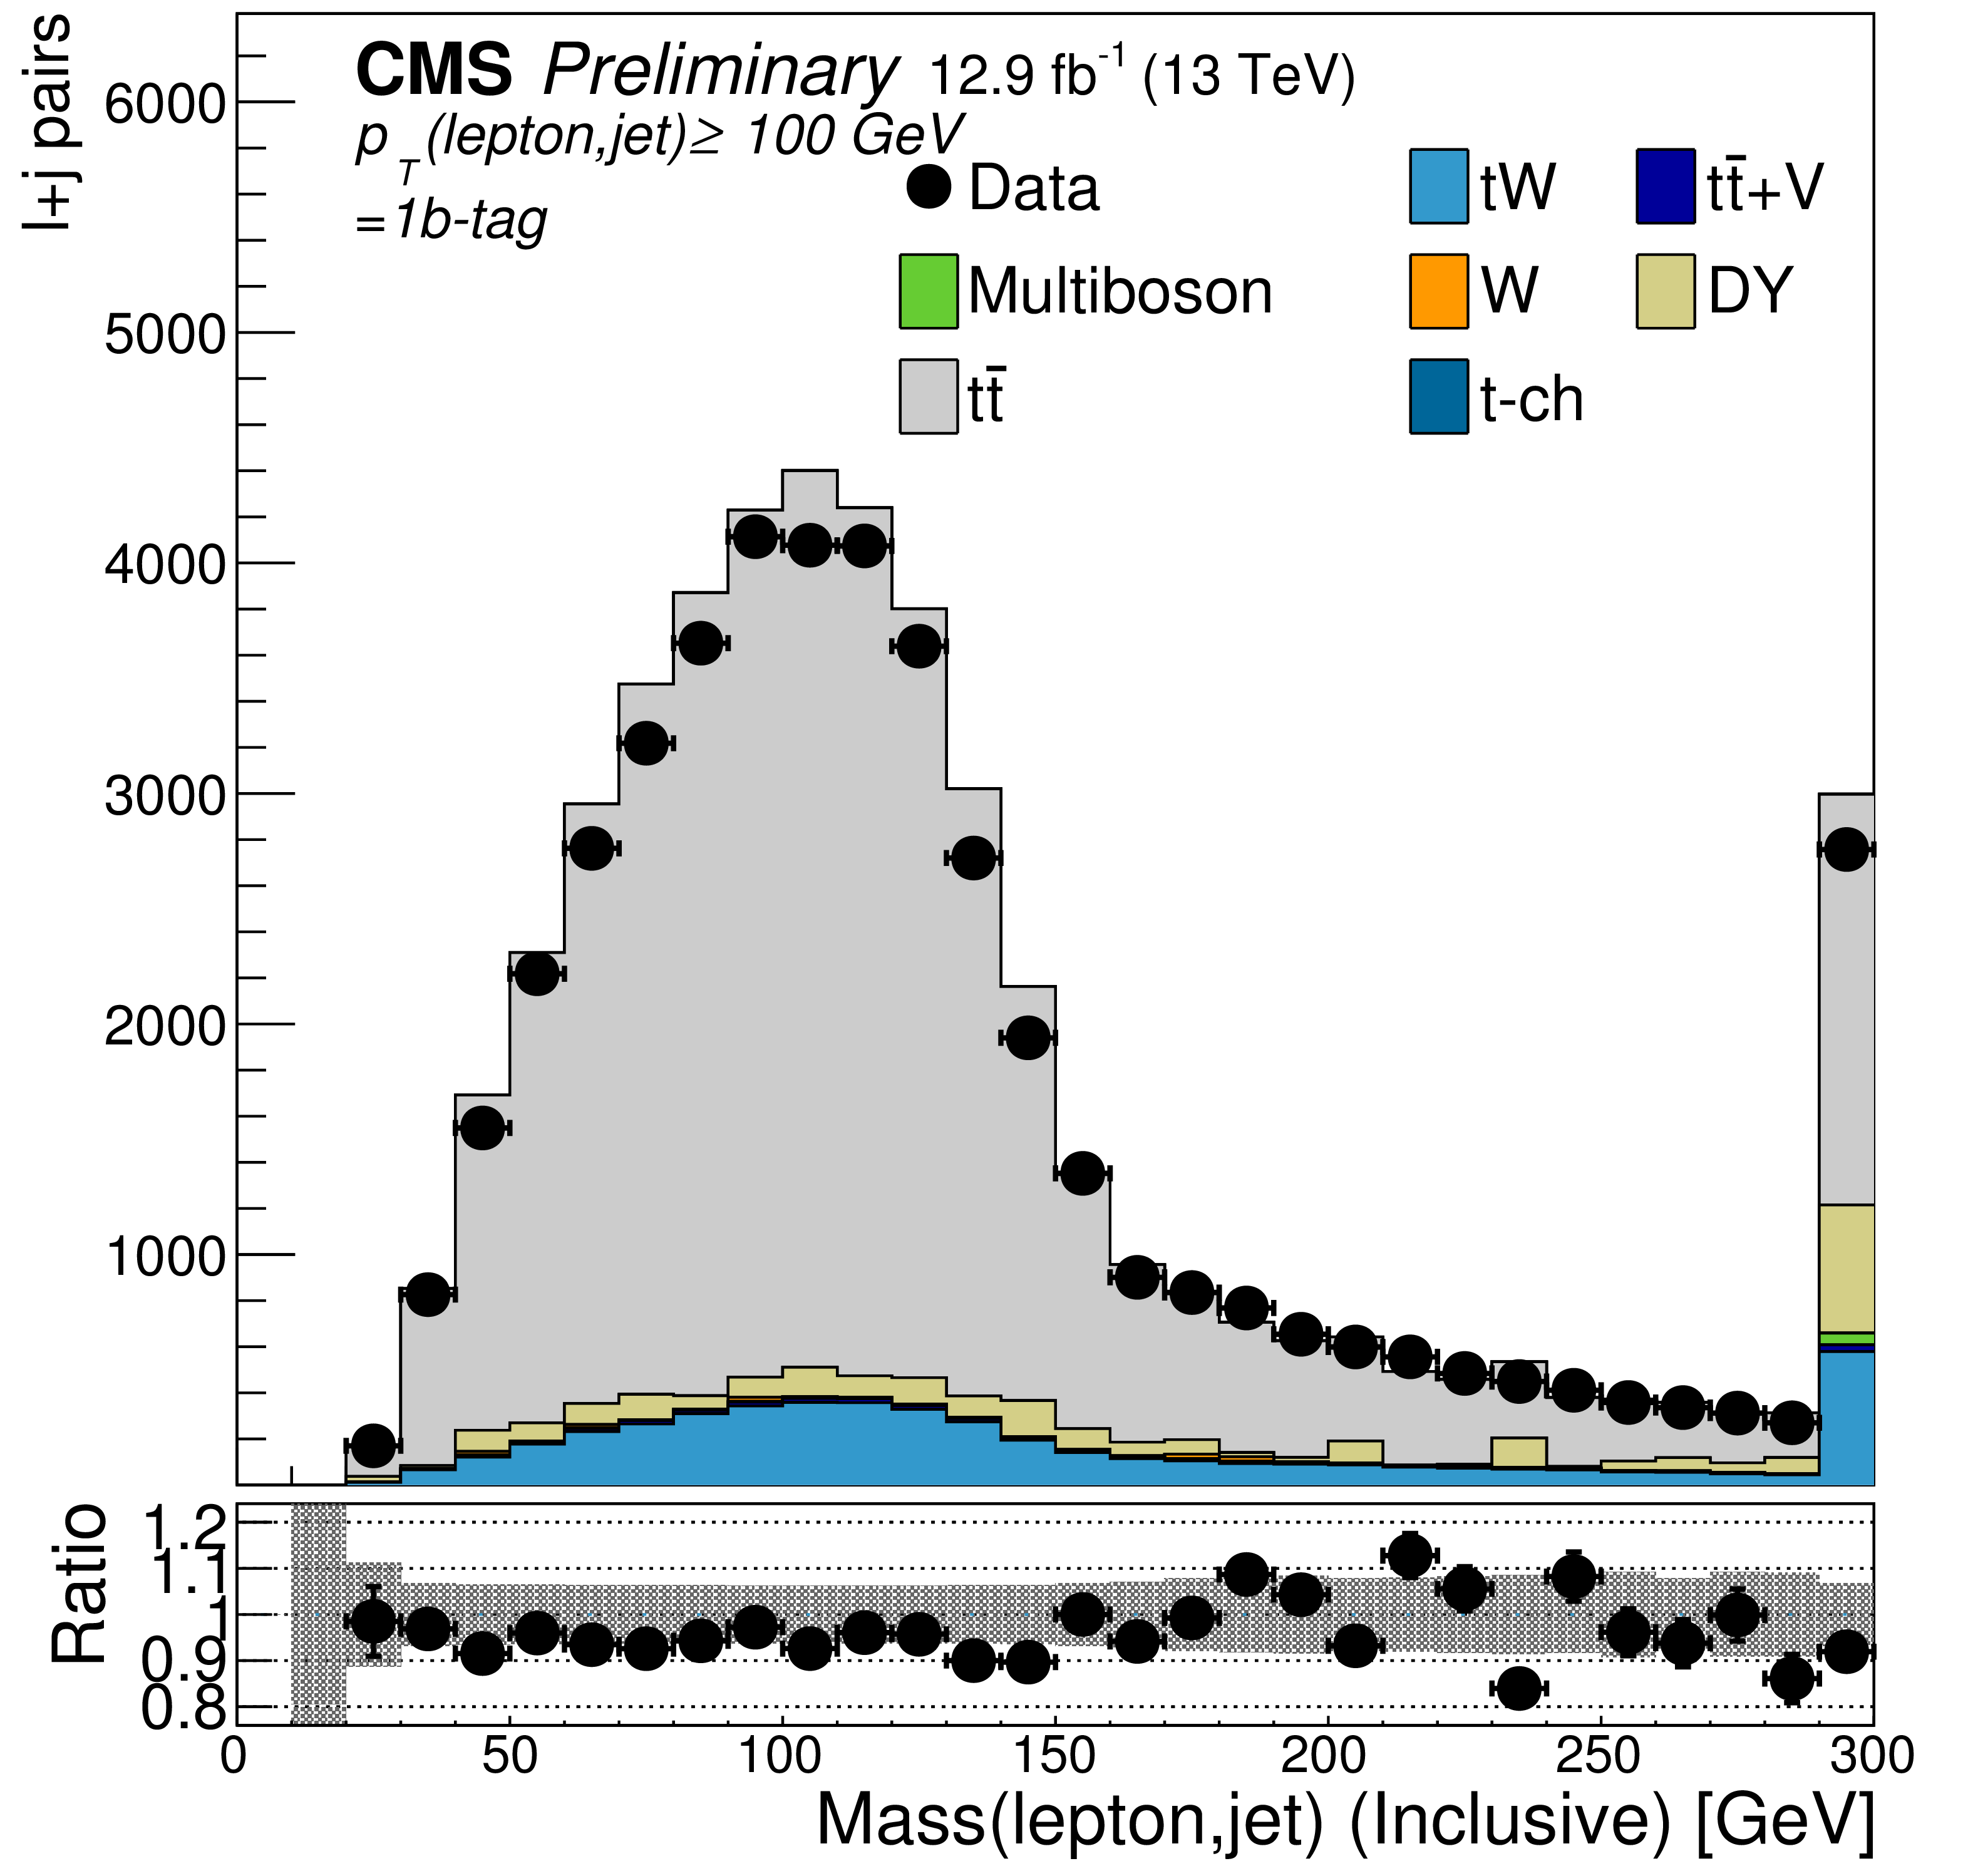
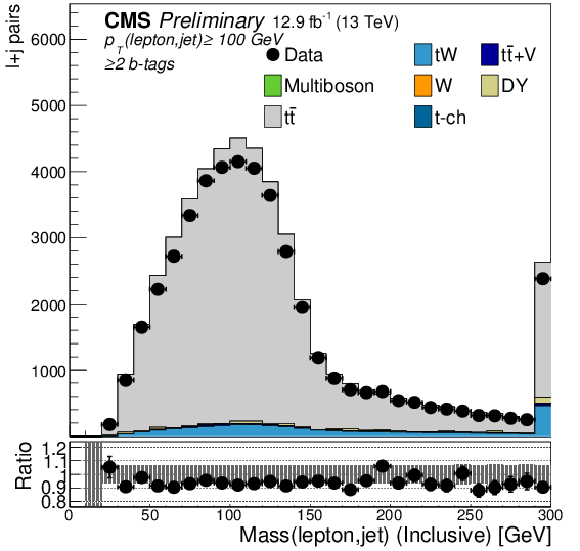
Top quark decay width () is inversely proportional to its life-time and any statistically significant deviation from its SM-predicted value would indicate non-SM decays of top quark. As presented in Sec. 4, the CMS measurement for the has been translated into an indirect measurement of , assuming = 1. The analysis resulted in (syst) GeV, which is in good agreement with the SM expectations (=1.324 GeV [8] for =172.5 GeV). Quite recently, CMS has performed a direct measurement of the same[9] using the dilepton events in 13.1 dataset at TeV. The selected events are categorized in terms b-jet multiplicity (1 b-tagged and b-tagged events). The analysis utilizes the reconstructed invariant mass of the lepton-b-tagged jet systems () as shown in Fig. 2.
In order to extract the limits on , a two dimensional likelihood fit is performed varying the signal strength () and the sample fraction for alternative width hypothesis (denoted x). For alternate hypothesis the the top decay width is considered to have values between and , where the signal events are modeled as
Here is the total number of expected signal events (+tW), while () represents expected numbers of the same in SM (alternate) hypothesis. The observed and expected limits provide bounds of GeV and GeV respectively at 95% confidence level.
4 Branching Fraction
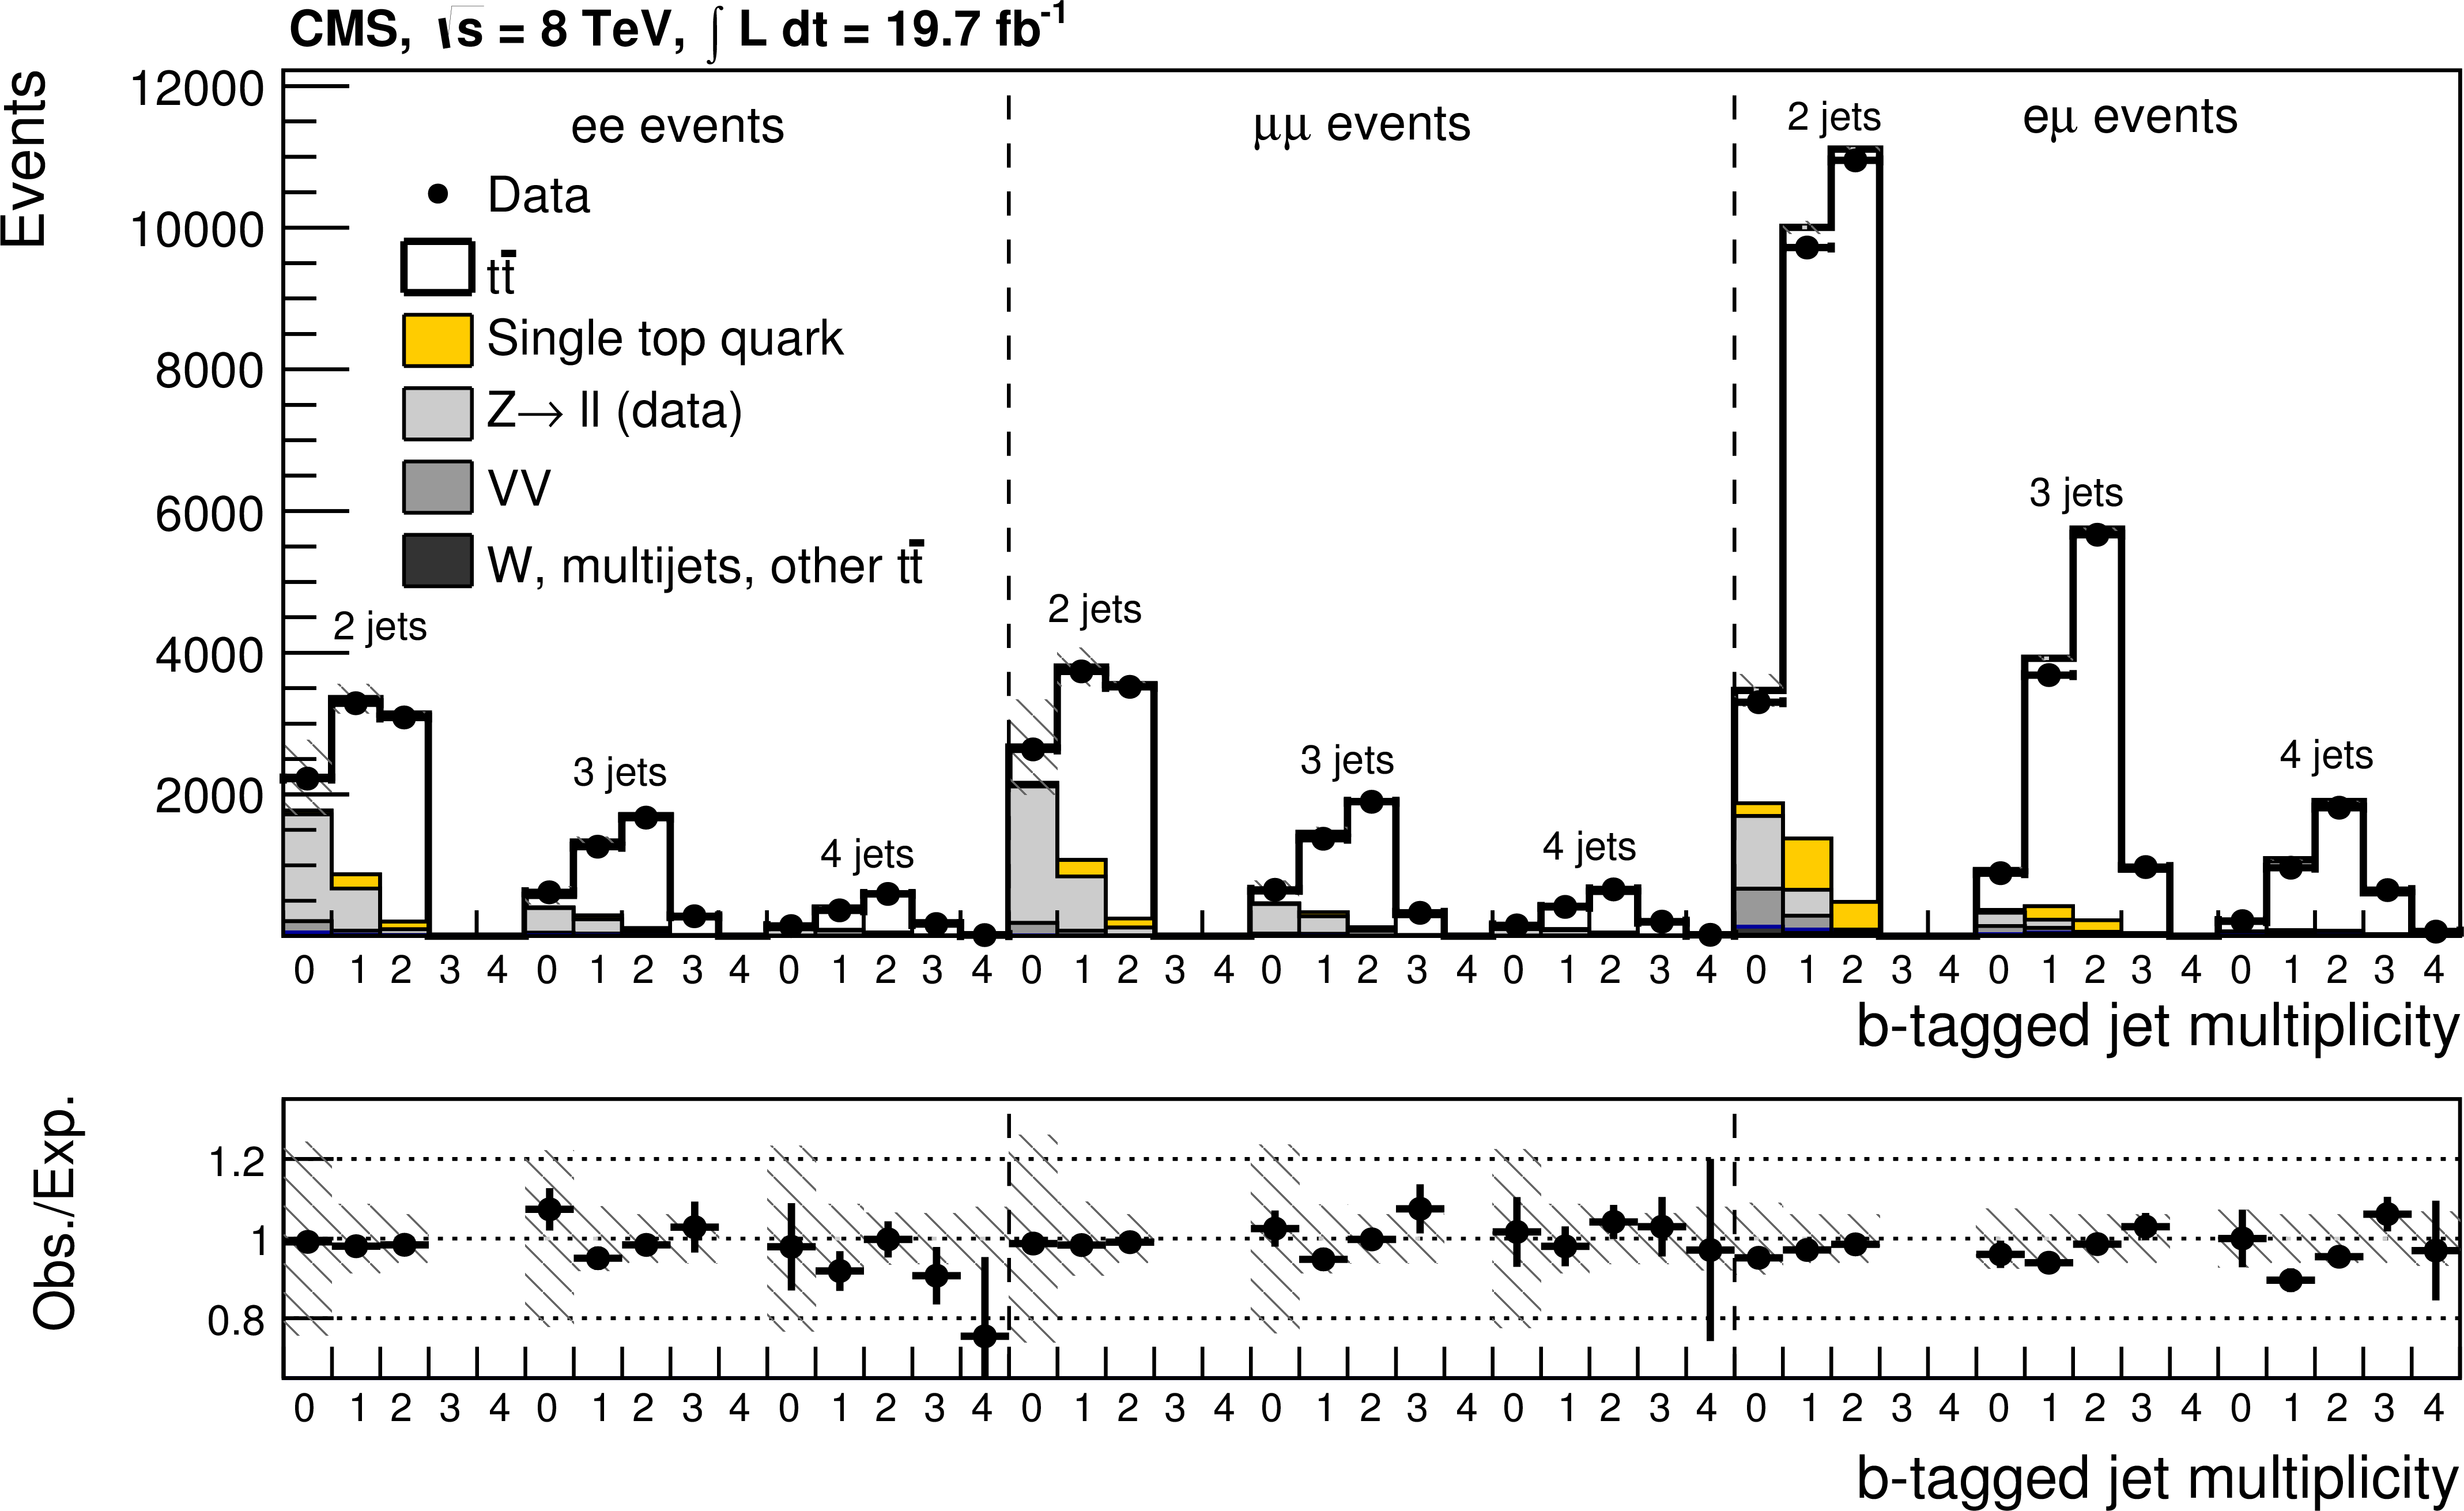
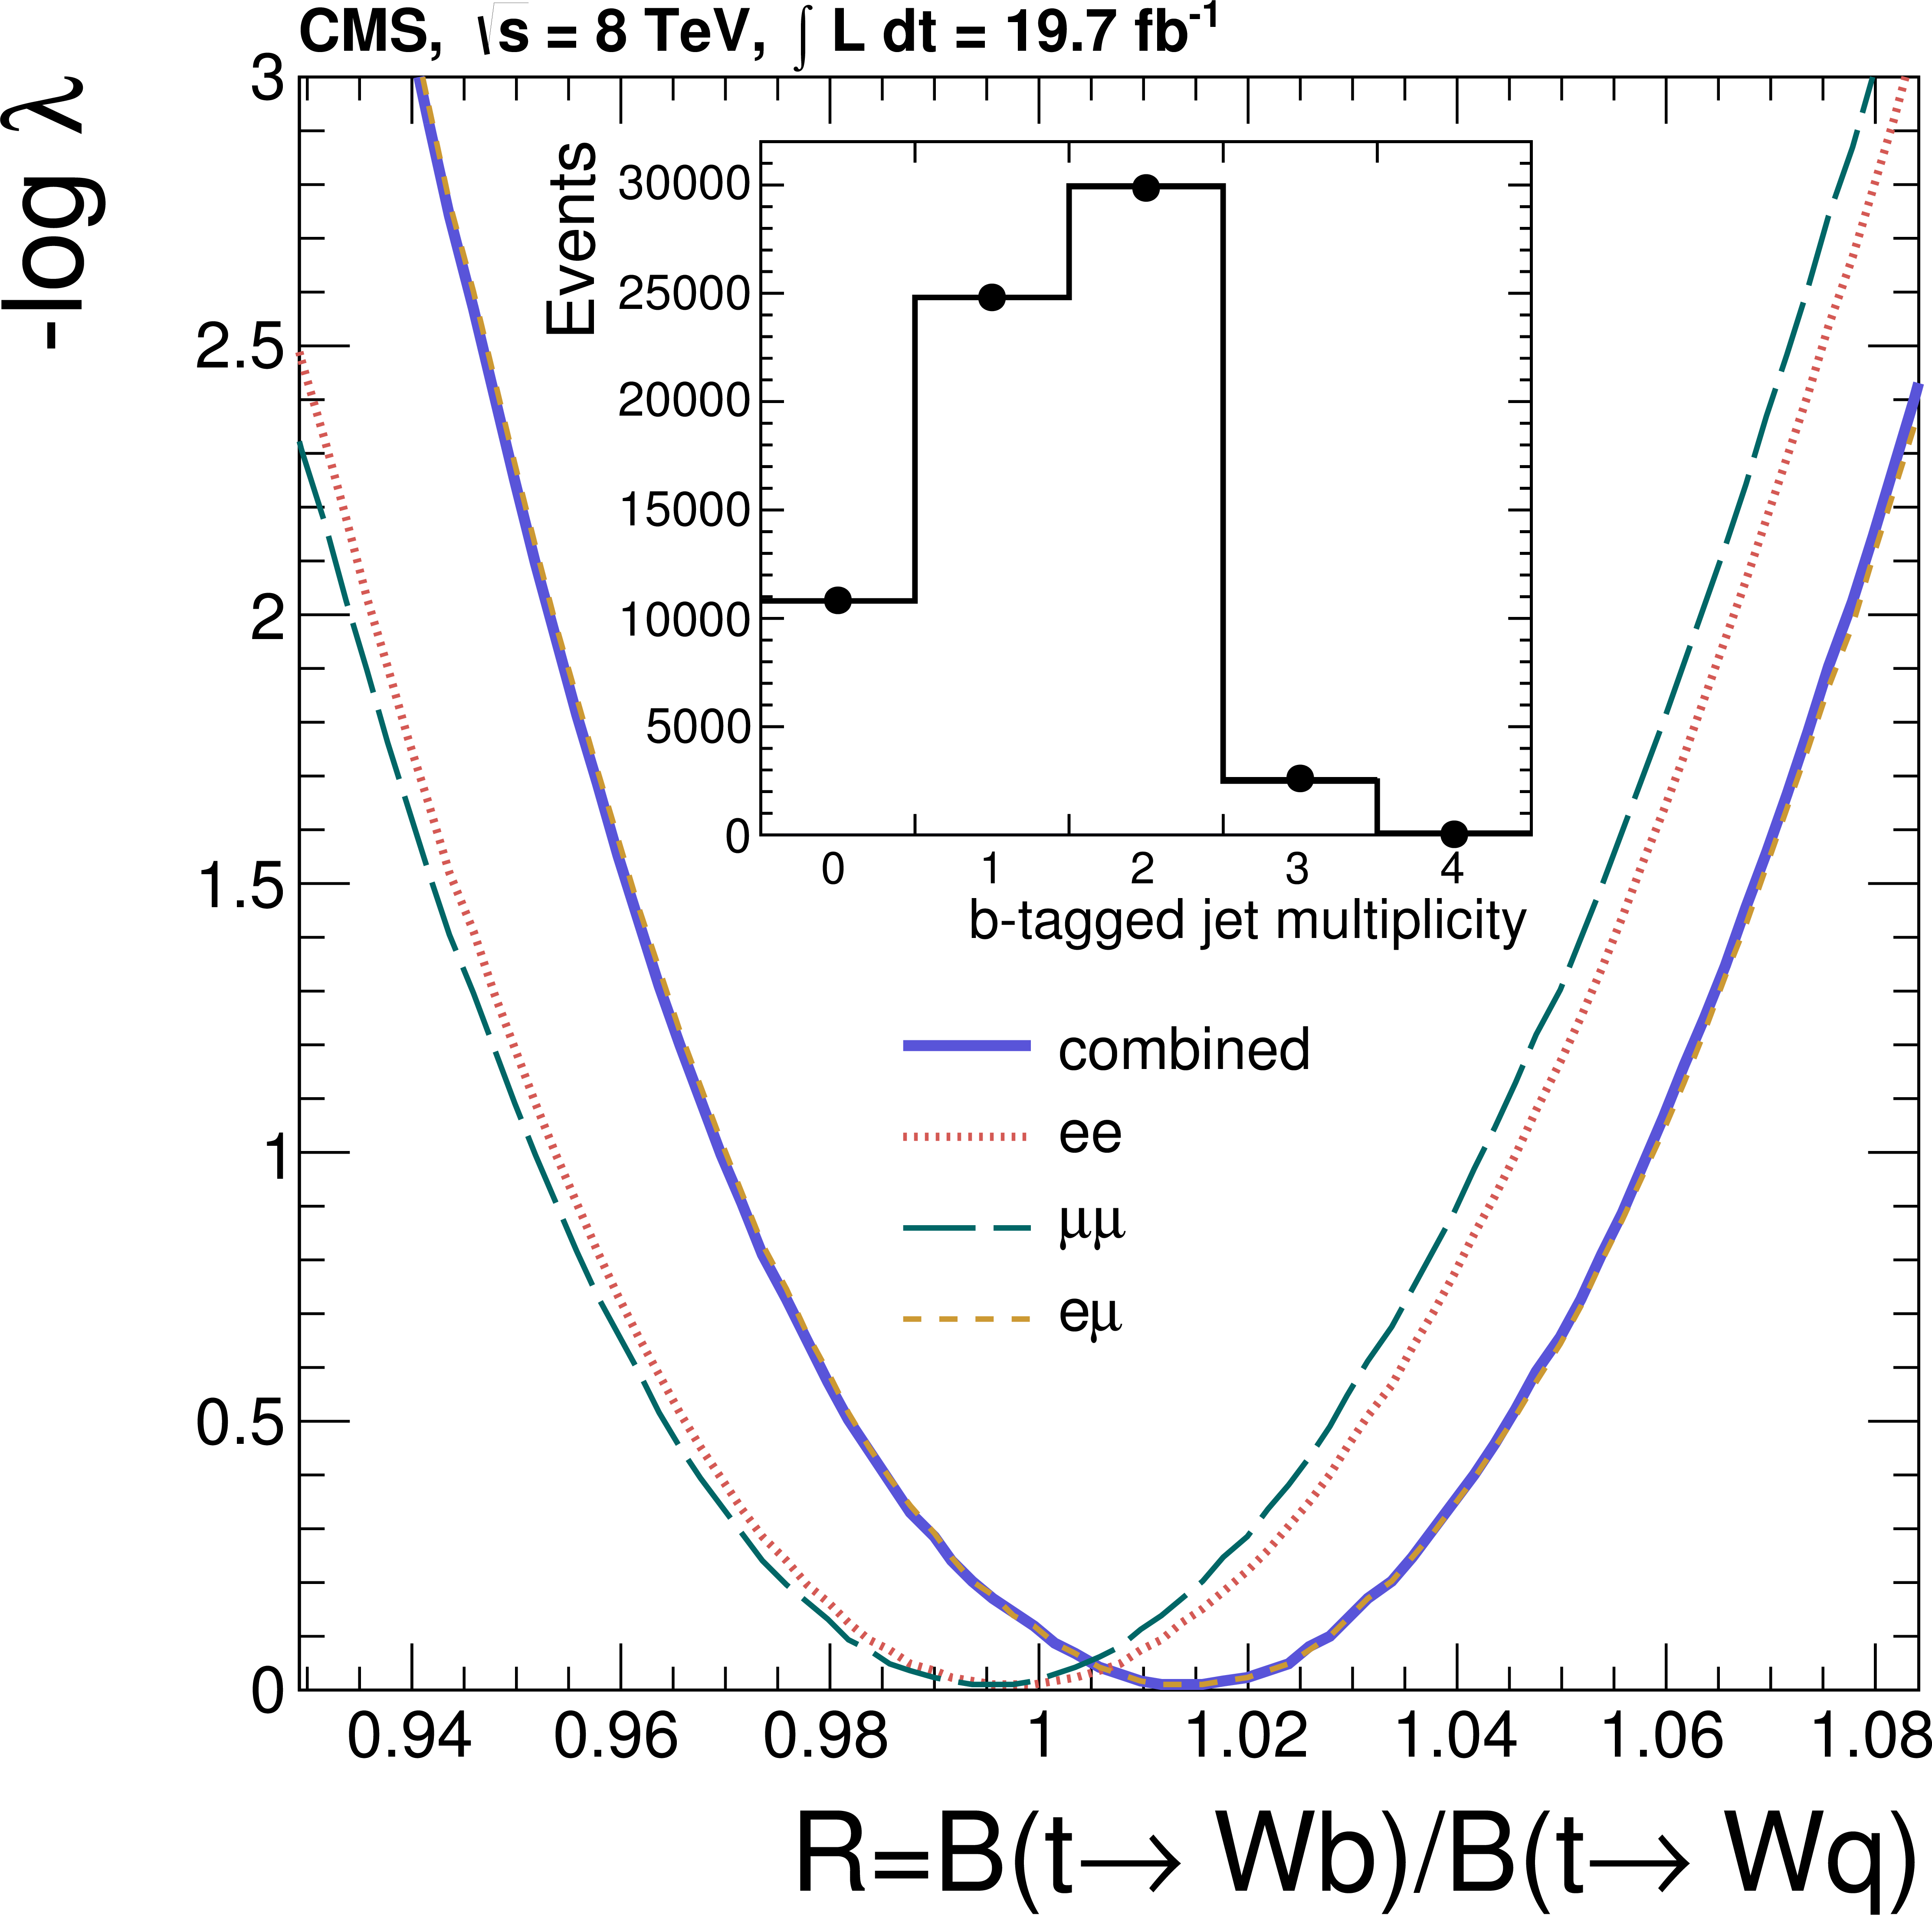
The charge current decays of the top quark i.e., with q=b, s, or d, are proportional to the corresponding CKM matrix elements viz., . However, assuming the unitarity of CKM matrix and given the measured values for and (or and ), and . Therefore, a measurement of the ratio of branching fractions with q=b, s, or d, would be an indirect measure of . CMS has completed a measurement of [7] with dilepton+jets events in 19.7 of proton-proton collisions dataset at = 8 TeV.
In order to have better discrimination against different background processes, the selection criteria are tuned further based on final state charged lepton flavors, number of jets and number of b-tagged jets. Fig 3(a) shows the agreement between data, SM background and signal processes ( and tW) in different event categories. The values of are extracted by maximizing the profile likelihood and the results are displayed in Fig. 3(b). A combined measurement of (syst) translates to a value of (stat+syst), which is consistent with the SM expectation. Furthermore, imposing a constraint of results in and at 95% confidence level.
5 Anomalous Wtb coupling
The V-A axial-vector structure of the Wtb vertex can be probed directly through single top production and in particular the t-channel production is quite sensitive to possible deviations from the SM. The most general CP-conserving Lagrangian can be written as
| (1) |
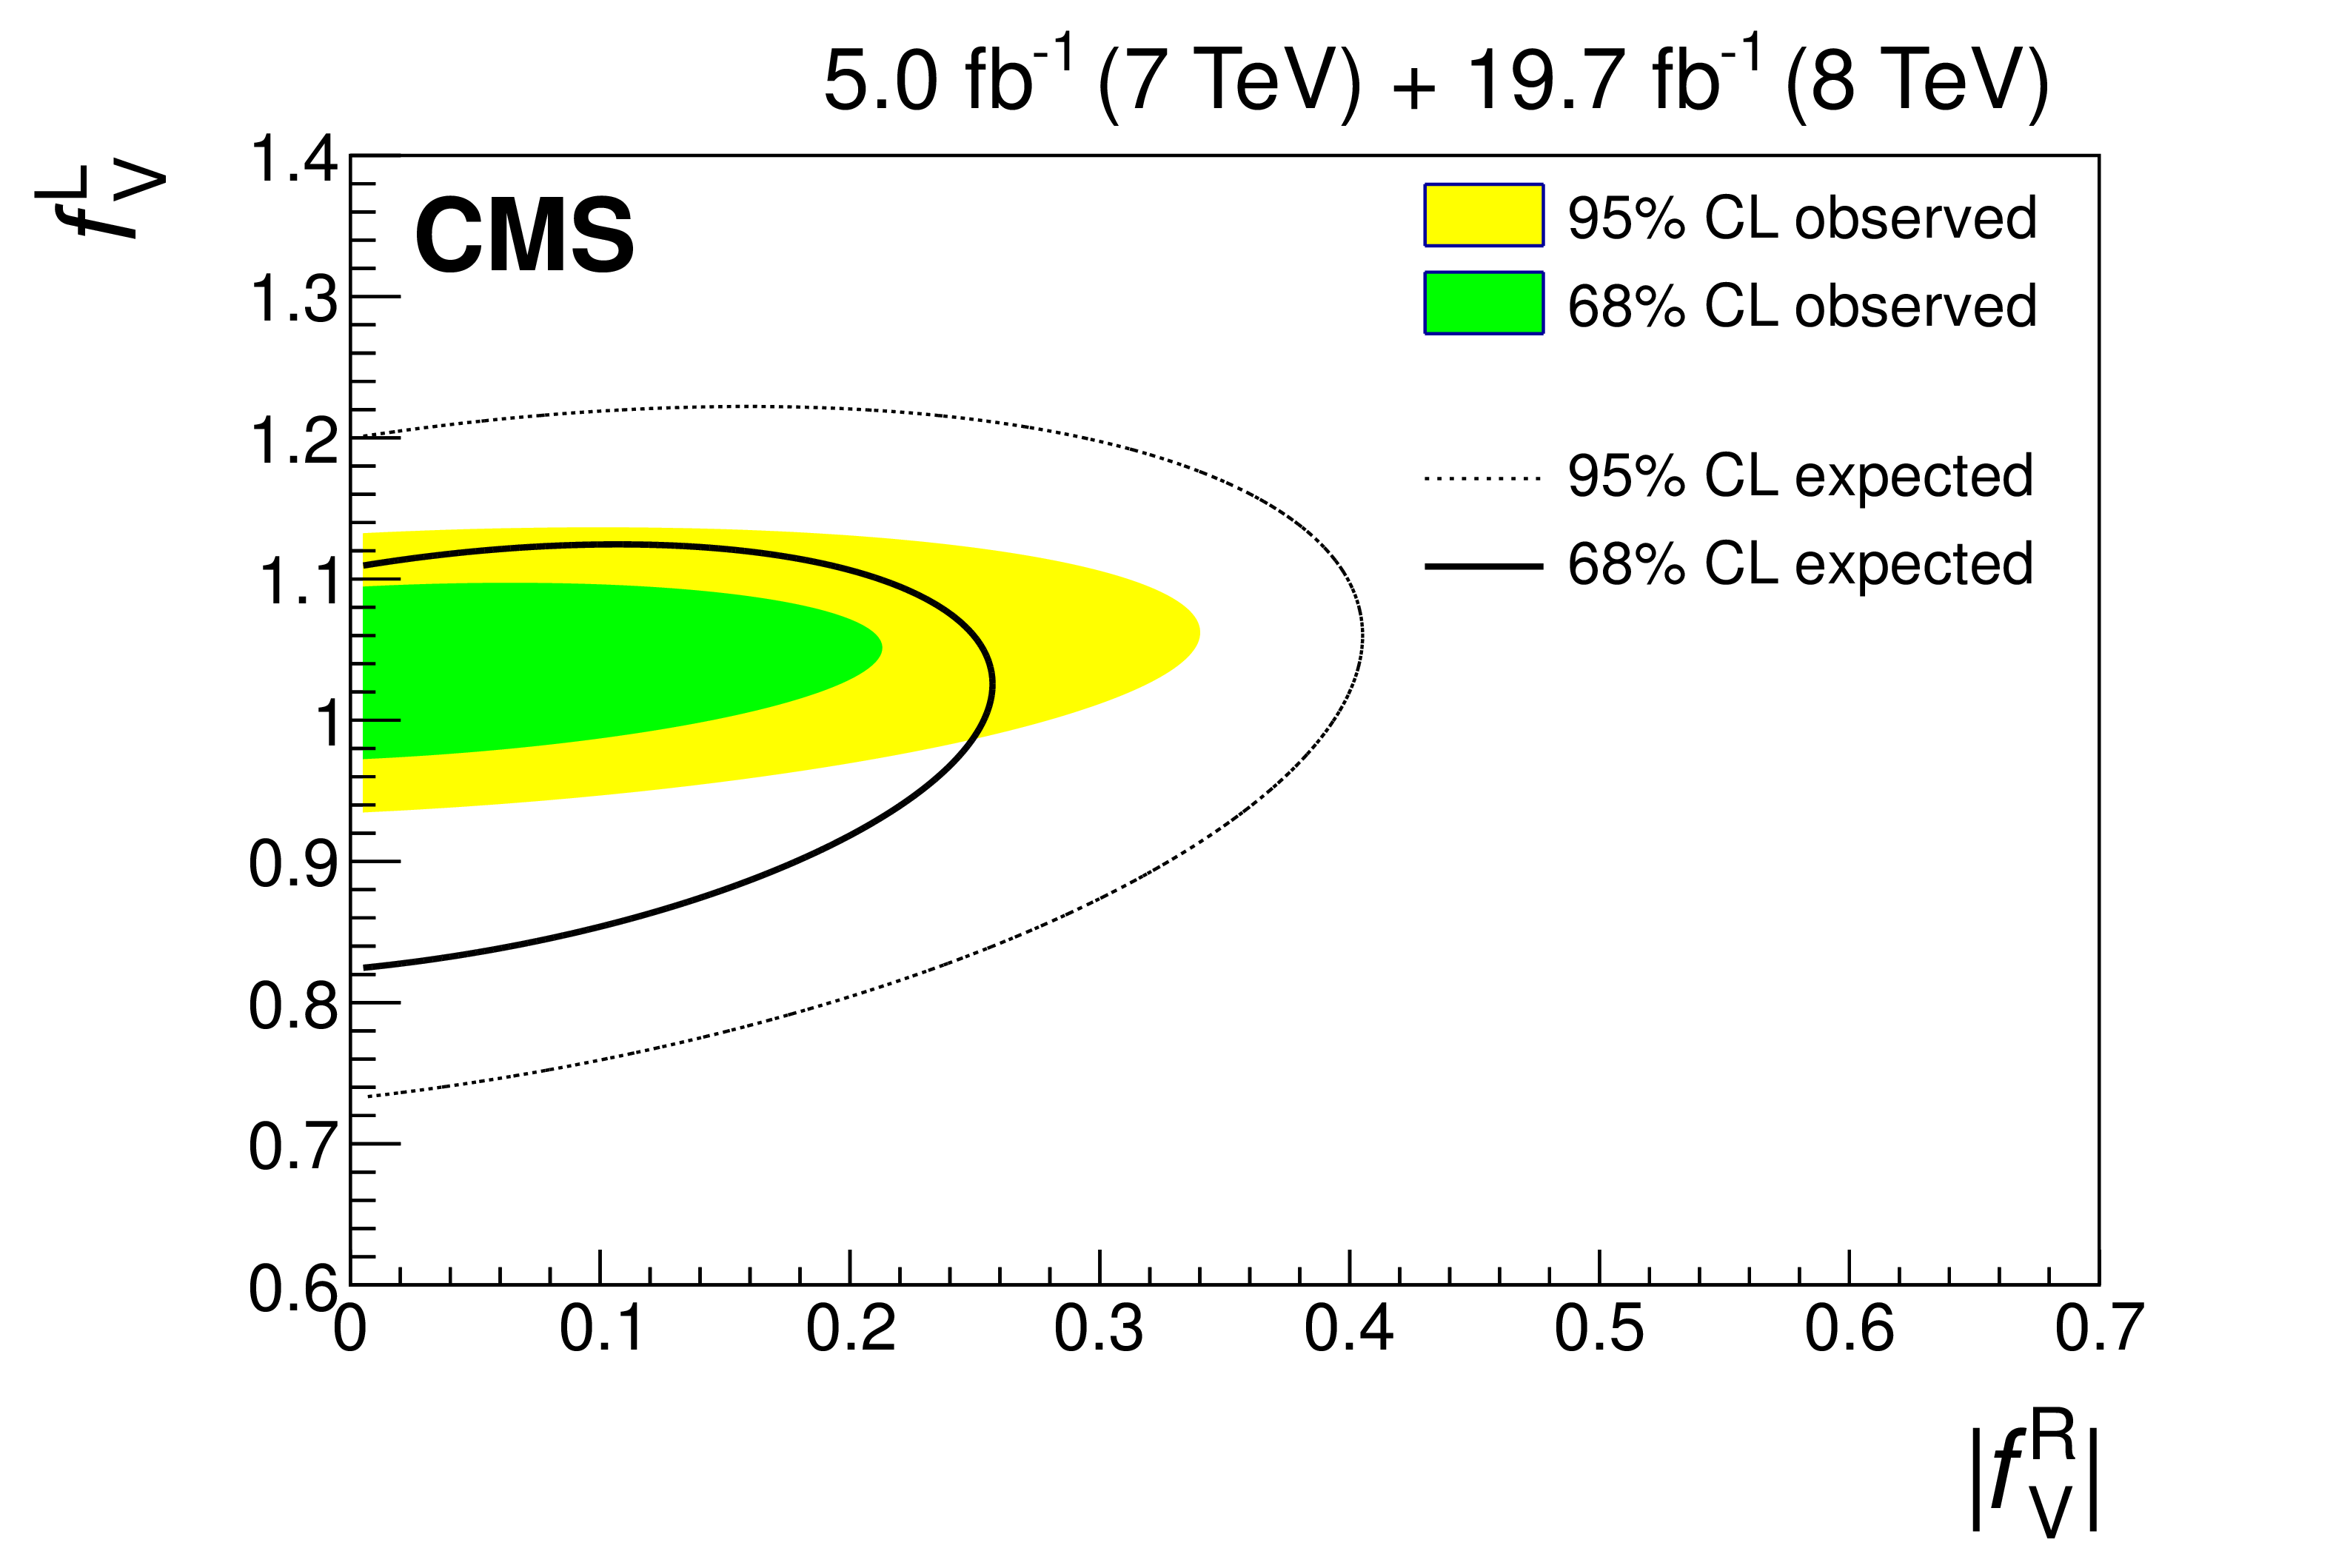
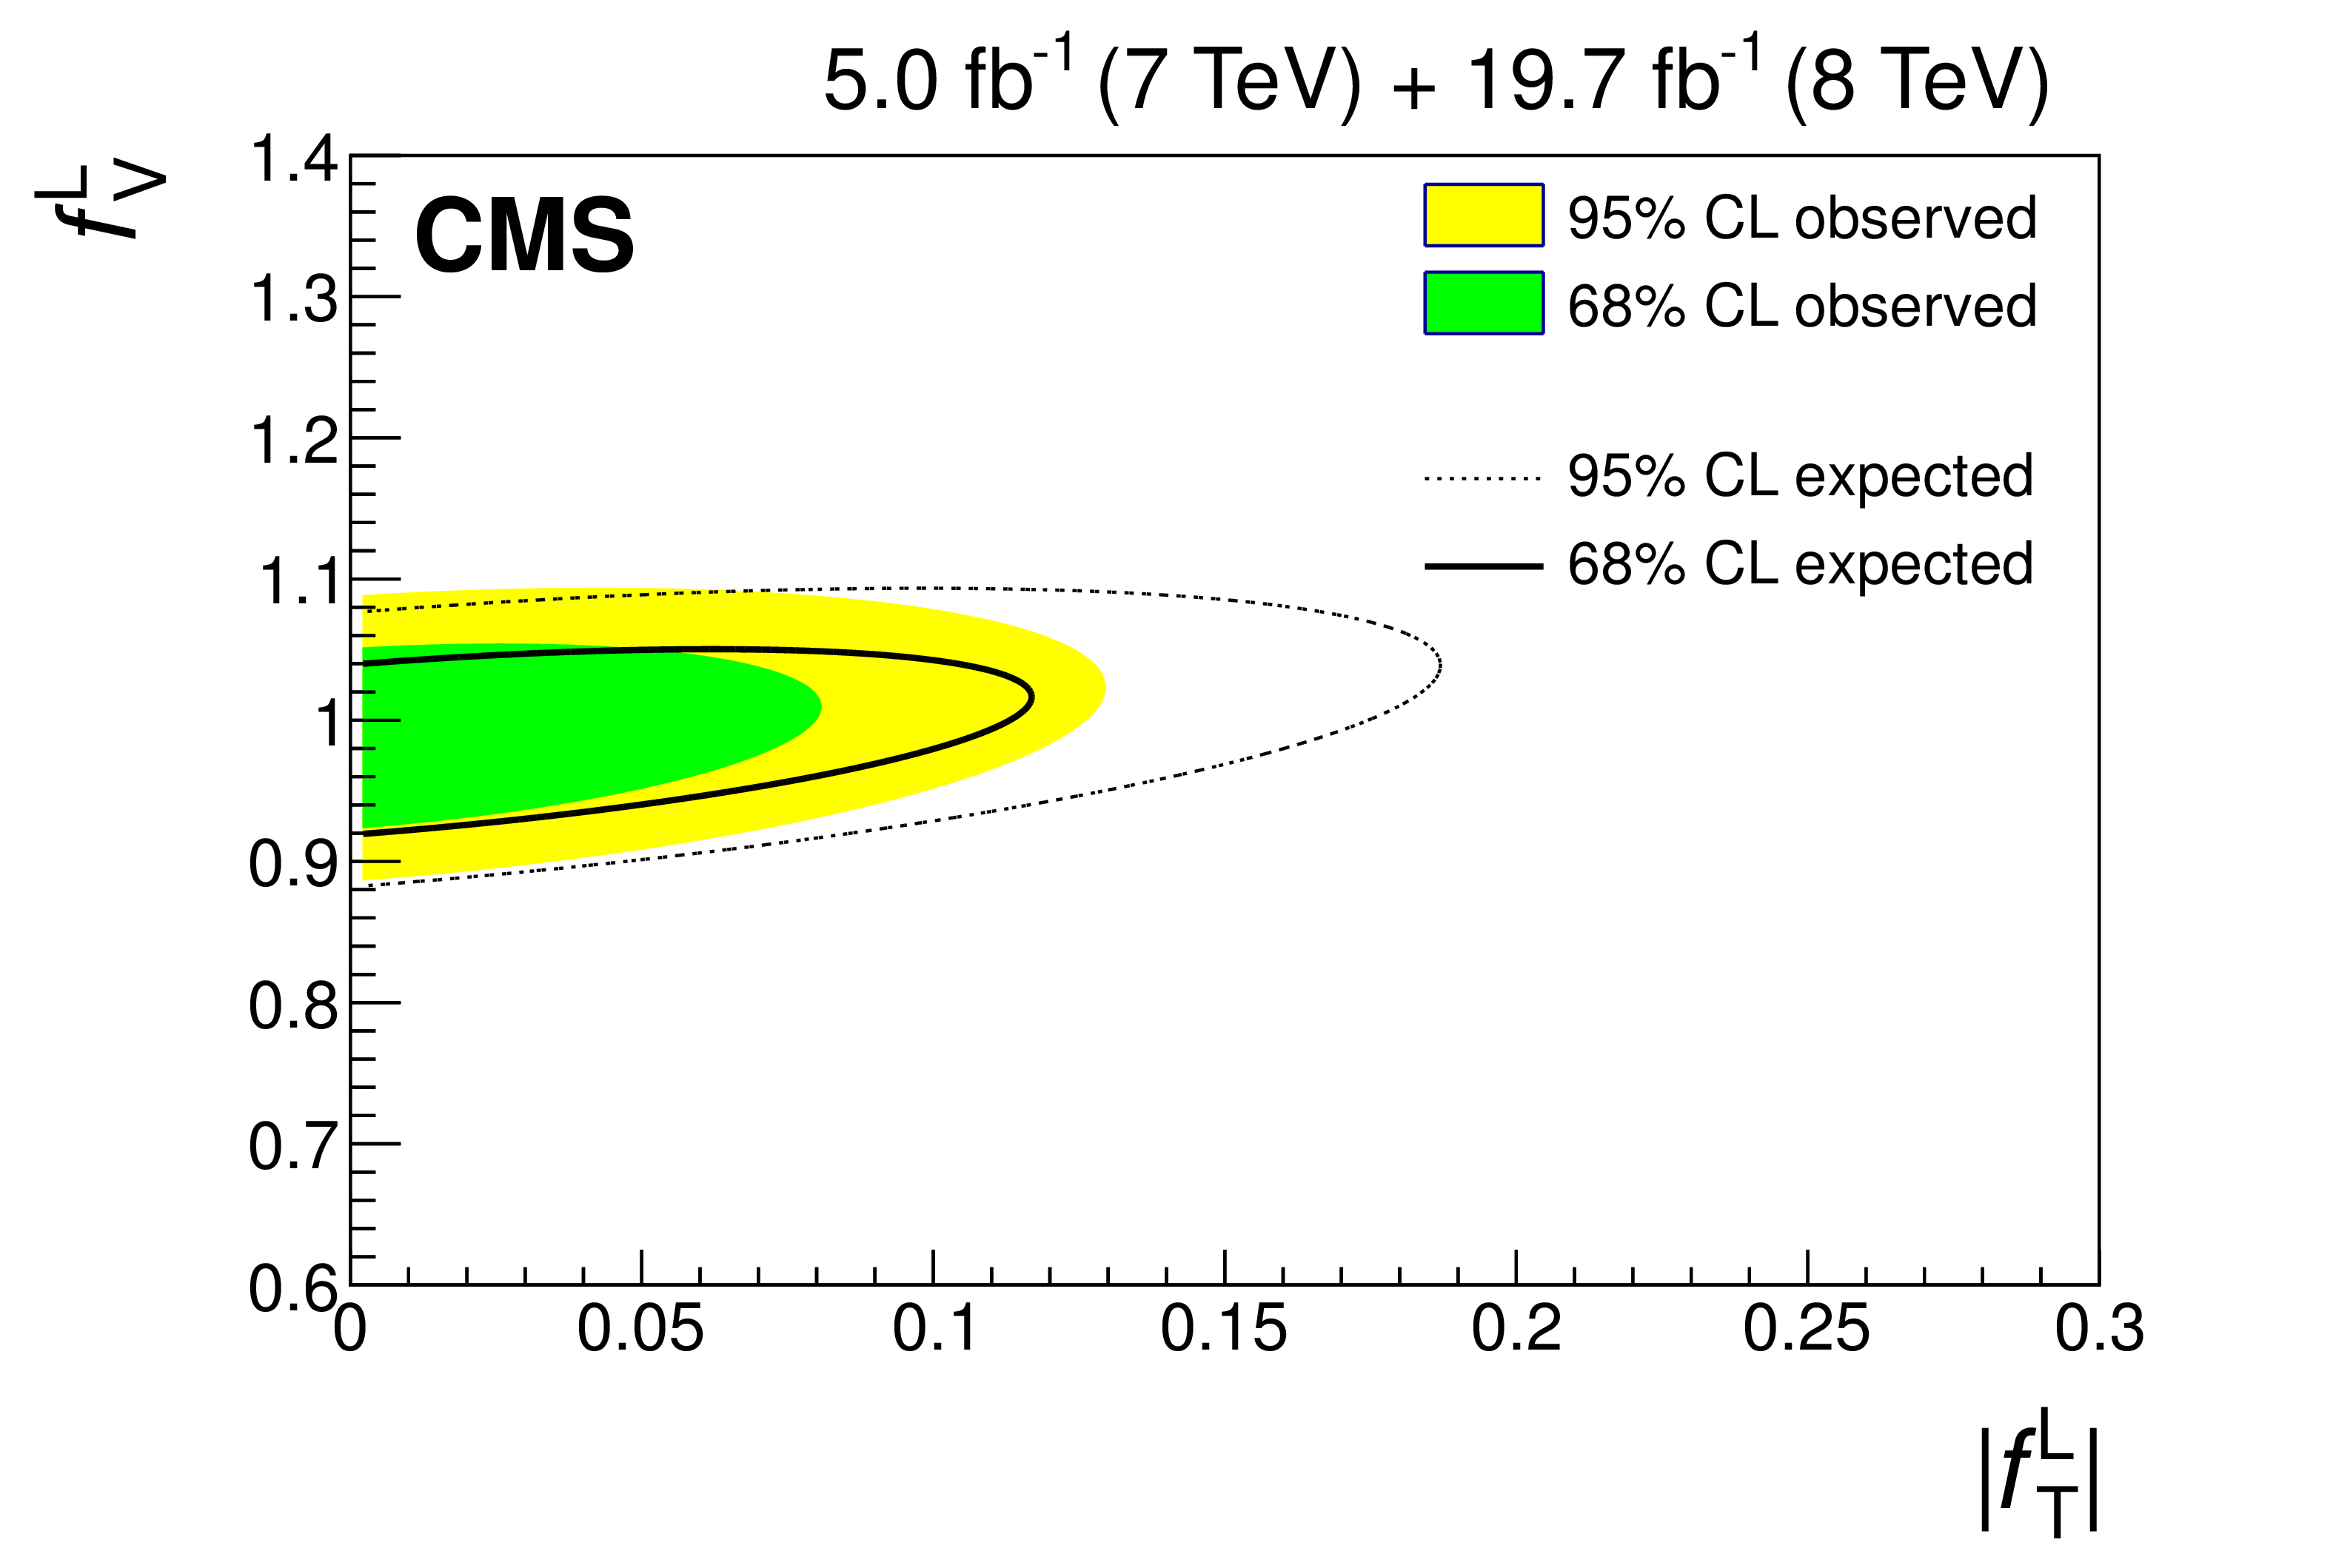
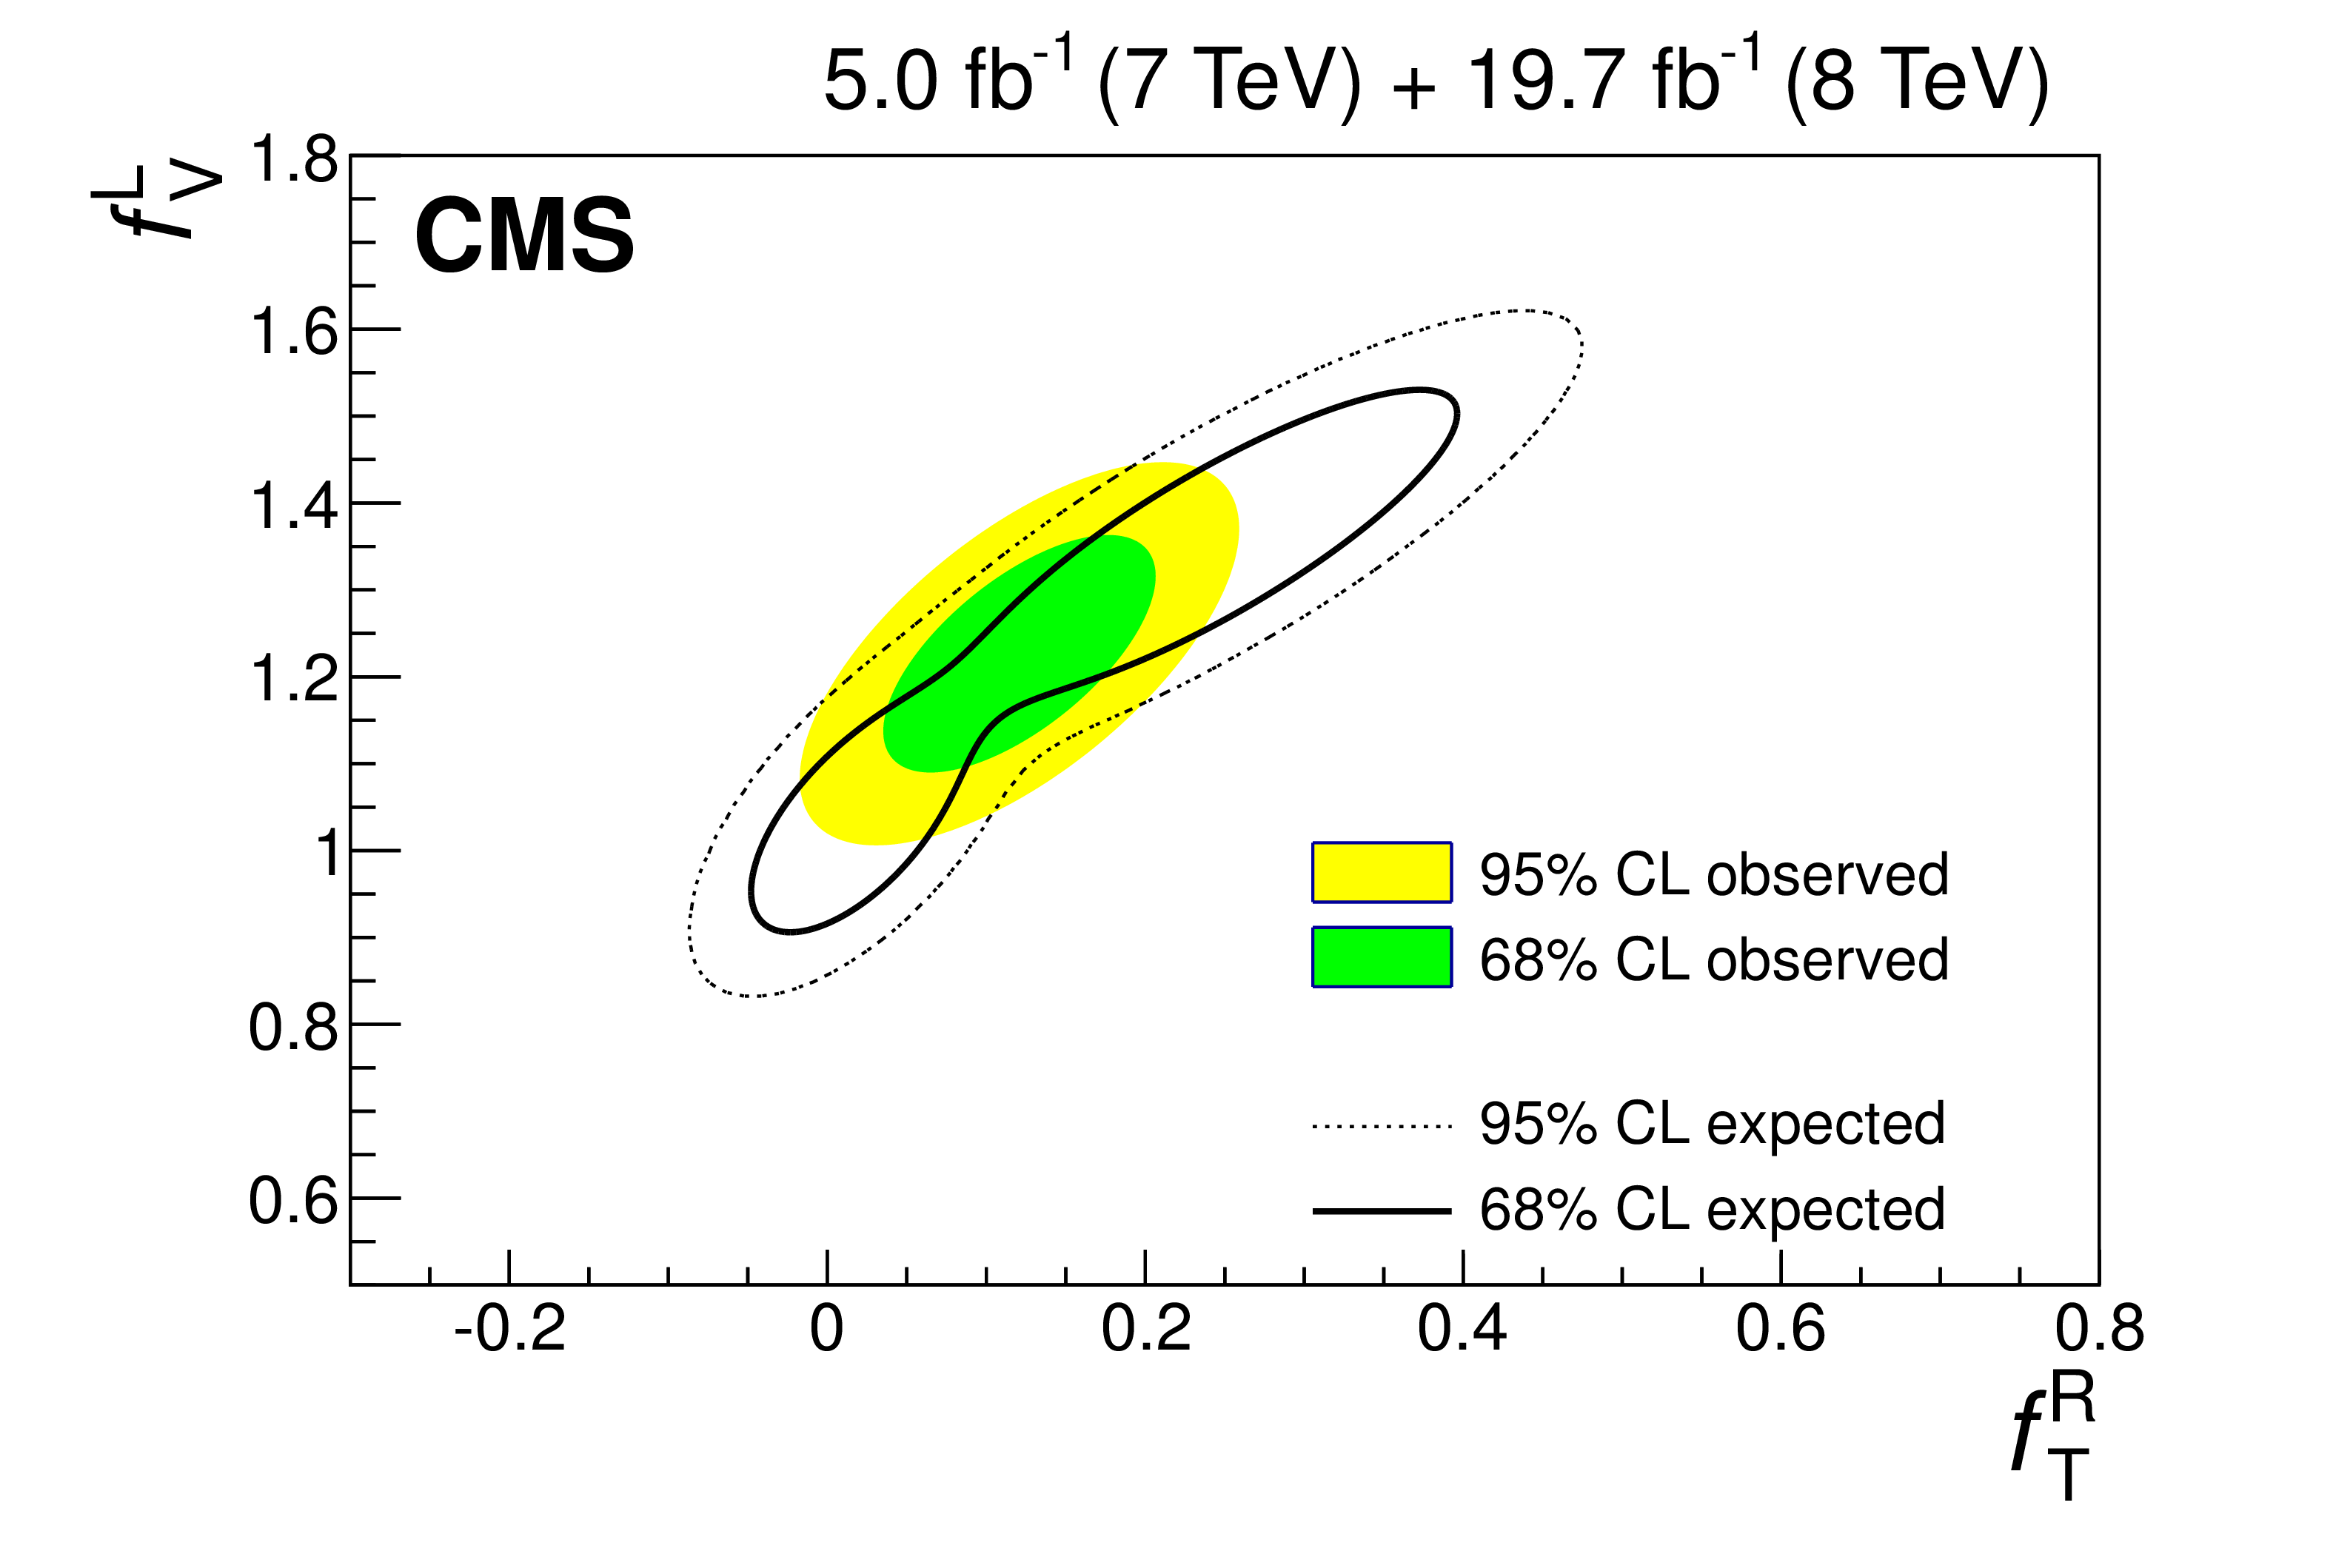
where and represent left-handed (right-handed) vector and tensor couplings respectively; within the SM, and = 0. CMS has completed a search[10] in muon + 2 or 3 jets signatures, using the full Run 1 dataset (5 at TeV and 19.7 at TeV). The search utilizes a Bayesian neural network technique to discriminate between the signal and background processes, which are observed to be consistent with the SM prediction. The exclusion limits on anomalous Wtb couplings, i.e., , and are shown in Fig. 4 and the observed limits at 95% confidence level are set on , and .
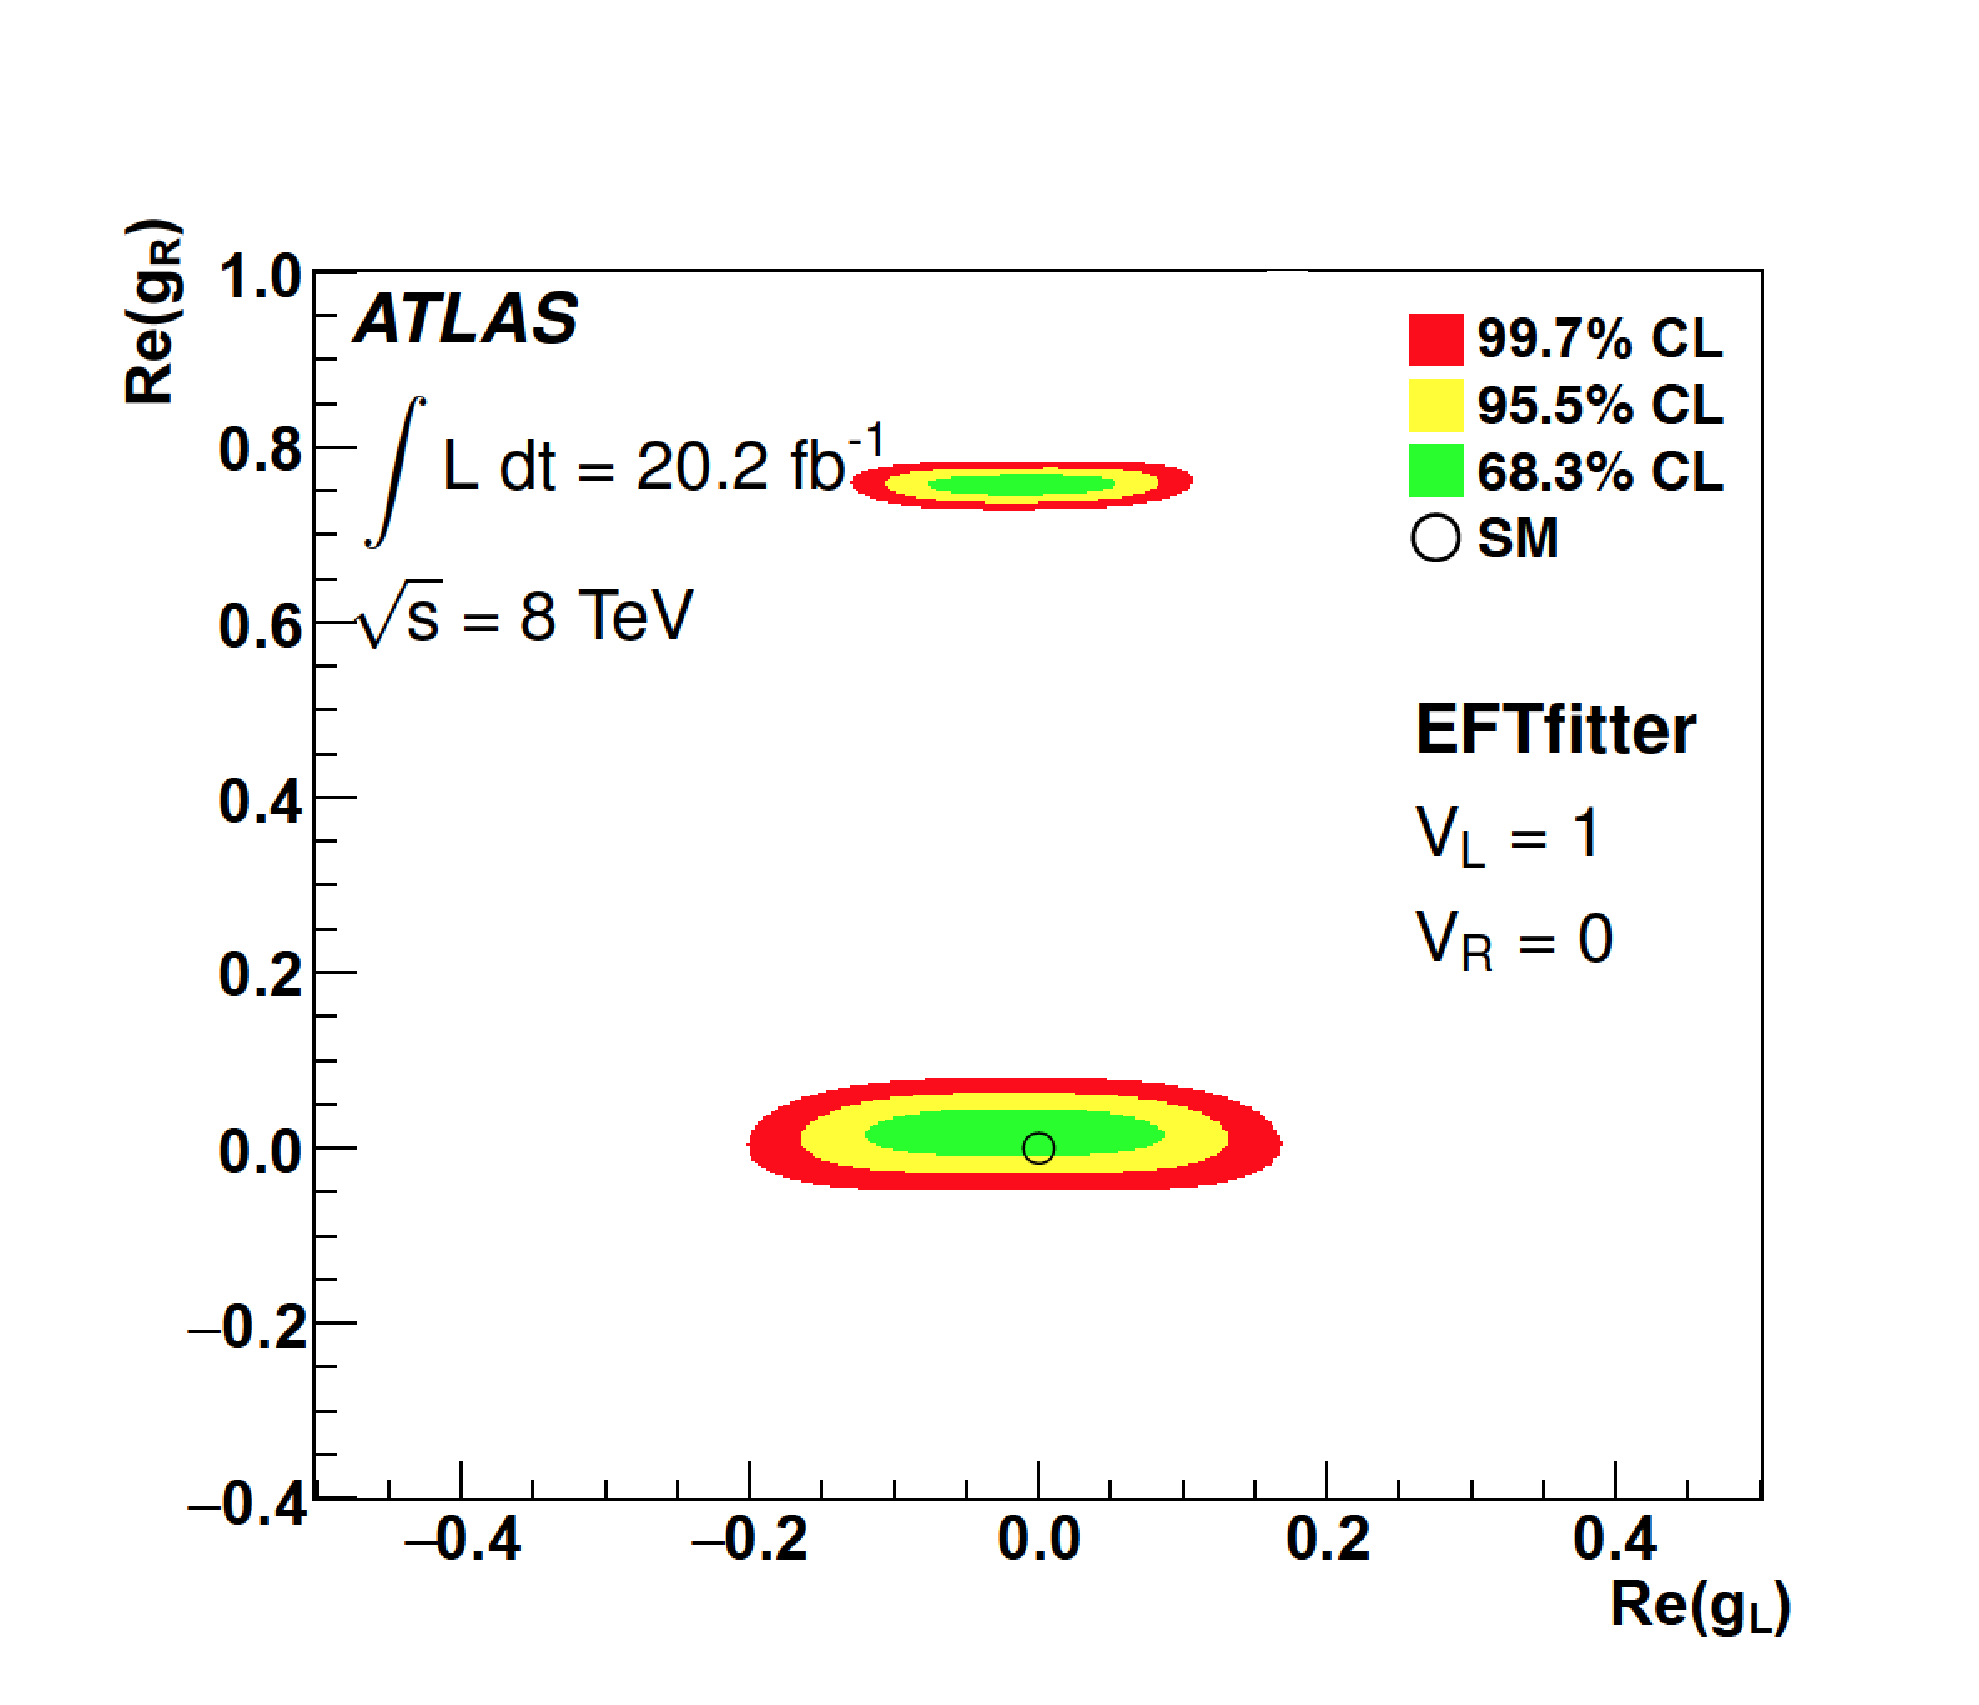
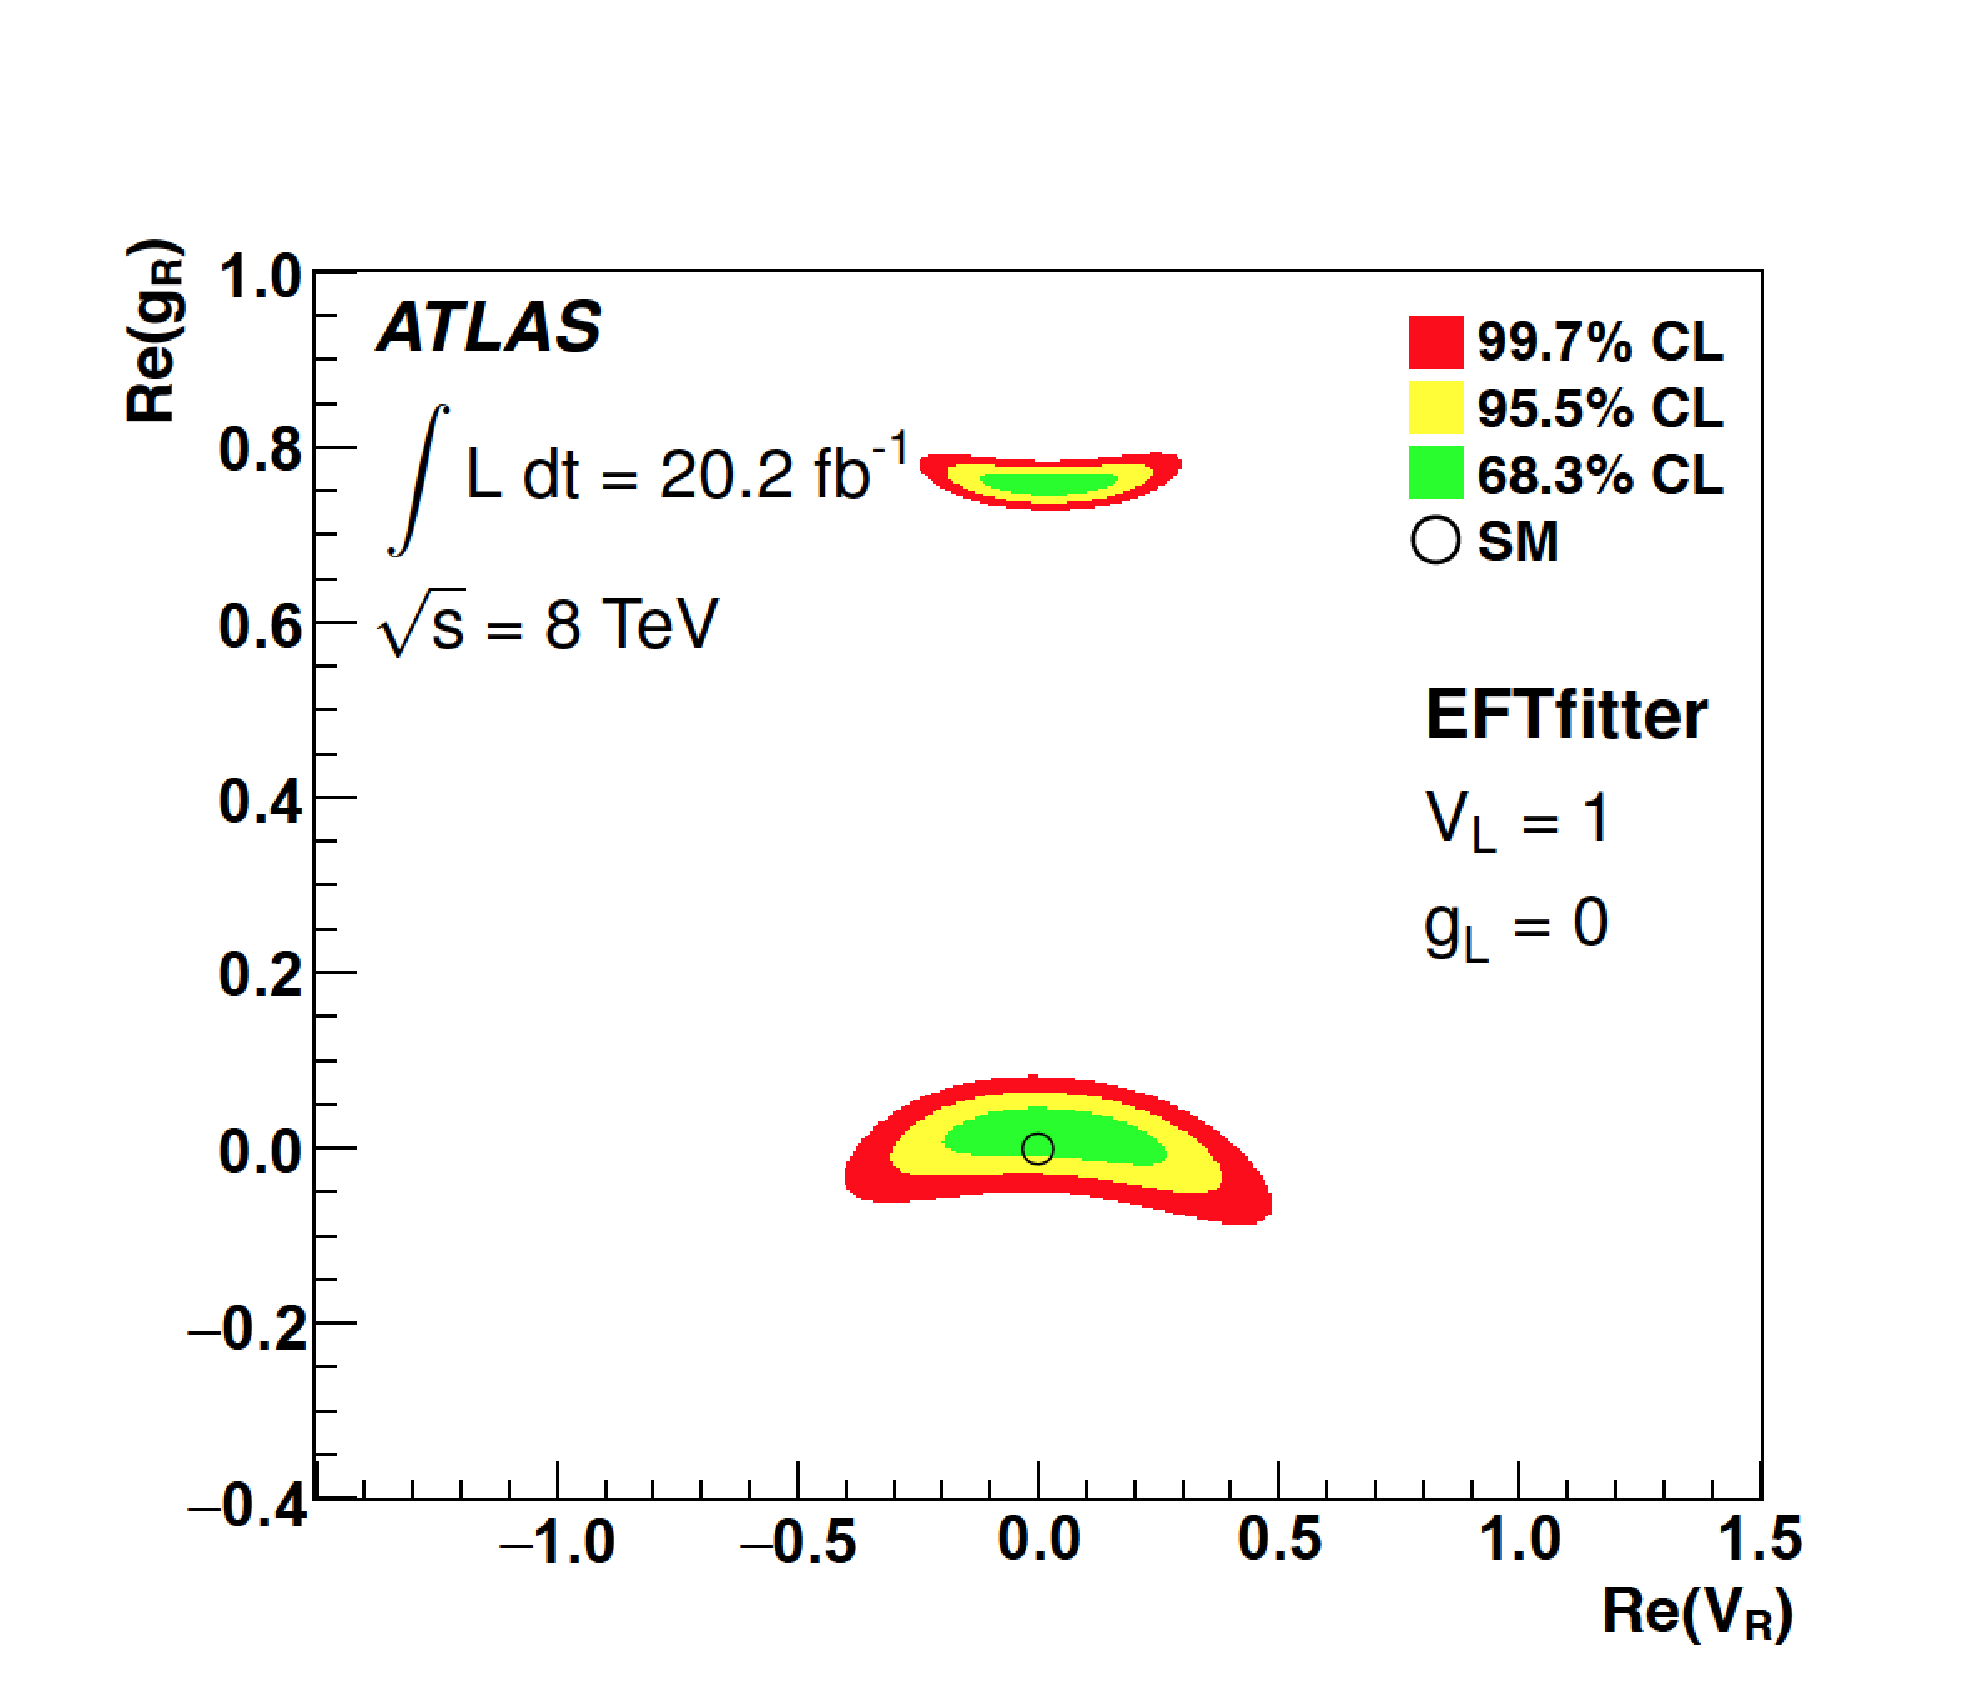
The ATLAS measurements for the helicity fractions from leptonic analyzer, (from Sec. 2) have also been translated to set limits on right-handed vector coupling (), left-handed tensor coupling () and right-handed tensor coupling () and the limits are shown in Fig. 5. The observed limits on anomalous , and (see Tab. 1) are consistent with the SM expectations.
| Couplings | 95% Confidence Level Interval |
|---|---|
| [-0.24, 0.31] | |
| [-0.14, 0.11] | |
| [-0.02; 0:06], [0.74, 0.78] |
6 Conclusions
Various top quark properties exploring the decay vertex have been measured by the ATLAS and CMS experiments using Run 1 and partially Run 2 datasets. The precision on W-boson helicity fractions in events is the most accurate till the date and the results are in good agreement with the SM predictions. CMS direct bounds on top quark decay width are still limited by statistical uncertainty, while being consistent with other indirect measurements and with the SM-predicted value of the same. Strong limits on anomalous Wtb couplings are set excluding any evidence for non-SM decay of top quark.
References
- [1] ATLAS Collaboration, The ATLAS Experiment at the CERN Large Hadron Collider, JINST 3 S08003 (2008).
- [2] CMS Collaboration, The CMS experiment at the CERN LHC, JINST 3 S08004 (2008).
-
[3]
LHCTopWG - LHC Top Physics Working Group
https://twiki.cern.ch/twiki/bin/view/LHCPhysics/LHCTopWG - [4] A. Czarnecki, J. G. Korner and J. H. Piclum, Helicity fractions of W bosons from top quark decays at NNLO in QCD, Phys. Rev. D 81 (2010) 111503, arXiv:1005.2625 [hep-ph].
- [5] CMS Collaboration, Measurement of the W boson helicity fractions in the decays of top quark pairs to lepton+jets final states produced in pp collisions at = 8 TeV, Phys. Lett. B 762 (2016) 512, arXiv:1605.09047 [hep-ex].
- [6] ATLAS Collaboration, Measurement of the W boson polarisation in events from pp collisions at = 8 TeV in the lepton+jets channel with ATLAS, Eur. Phys. J. C 77 (2017) 264, arXiv:1612.02577 [hep-ex].
- [7] CMS Collaboration, Measurement of the ratio in pp collisions at = 8 TeV, Phys. Lett. B 736 (2014) 33, arXiv:1404.2292 [hep-ex].
- [8] Particle Data Group, J. Beringer et al., “Review of Particle Physics”, Phys. Rev. D 86 (2012) 010001, doi:10.1103/PhysRevD.86.010001.
- [9] CMS Collaboration, Bounding the top quark width using final states with two charged leptons and two jets at = 13 TeV, CMS-PAS-TOP-16-019.
- [10] CMS Collaboration, Search for anomalous Wtb couplings and flavor-changing neutral currents in t-channel single top quark production in pp collisions at = 7 and 8 TeV, JHEP 02 (2017), 028, arXiv:1610.03545 [hep-ex].