Multivalent Ion-Activated Protein Adsorption Reflecting Bulk Reentrant Behavior
Abstract
Protein adsorption at the solid-liquid interface is an important phenomenon that often can be observed as a first step in biological processes. Despite its inherent importance, still relatively little is known about the underlying microscopic mechanisms. Here, using multivalent ions, we demonstrate the control of the interactions and the corresponding adsorption of net-negatively charged proteins (bovine serum albumin) at a solid-liquid interface. This is demonstrated by ellipsometry and corroborated by neutron reflectivity and quartz-crystal microbalance experiments. We show that the reentrant condensation observed within the rich bulk phase behavior of the system featuring a nonmonotonic dependence of the second virial coefficient on salt concentration is reflected in an intriguing way in the protein adsorption at the interface. Our findings are successfully described and understood by a model of ion-activated patchy interactions within the framework of classical density functional theory. In addition to the general challenge of connecting bulk and interface behavior, our work has implications for, inter alia, nucleation at interfaces.
The interactions of proteins, with their inherent heterogeneity and differently charged patches, in addition to hydrophilic and hydrophobic regions and dispersion forces, are very complex Rabe et al. (2011). While obviously required for their biological function, this complexity of the interactions is very demanding for a quantitative physical understanding. Particularly difficult is the connection to the associated mesoscopic and macroscopic behavior, with enormous implications for a range of rather diverse fields. These include the understanding of protein crystallization Rein ten Wolde and Frenkel (1997); Whitelam (2010); Fusco and Charbonneau (2013), as well as various forms of aggregation Stradner et al. (2004); Godfrin et al. (2015), whether biologically desired Schmidt et al. (2008); Yan et al. (2013); Monks et al. (1998) or related to diseases such as Alzheimer’s Kakio et al. (2001), Huntington’s, or prion diseases (e.g. Creutzfeldt-Jakob disease) Aguzzi and O’Connor (2010). A further level of complexity is added by the frequently heterogeneous environment in soft and biological systems, often with internal interfaces, at which adsorption might take place, coexisting with fluid (bulk-like) regions. While in numerous studies the phase behavior of proteins has been investigated Stradner et al. (2004); Sear (1999); Goegelein (2008), it remains an important challenge to understand protein-protein interactions in a microscopic picture and to predict the resulting macroscopic thermodynamic behavior of proteins in solution and at interfaces, and how these behaviors correspond or differ.
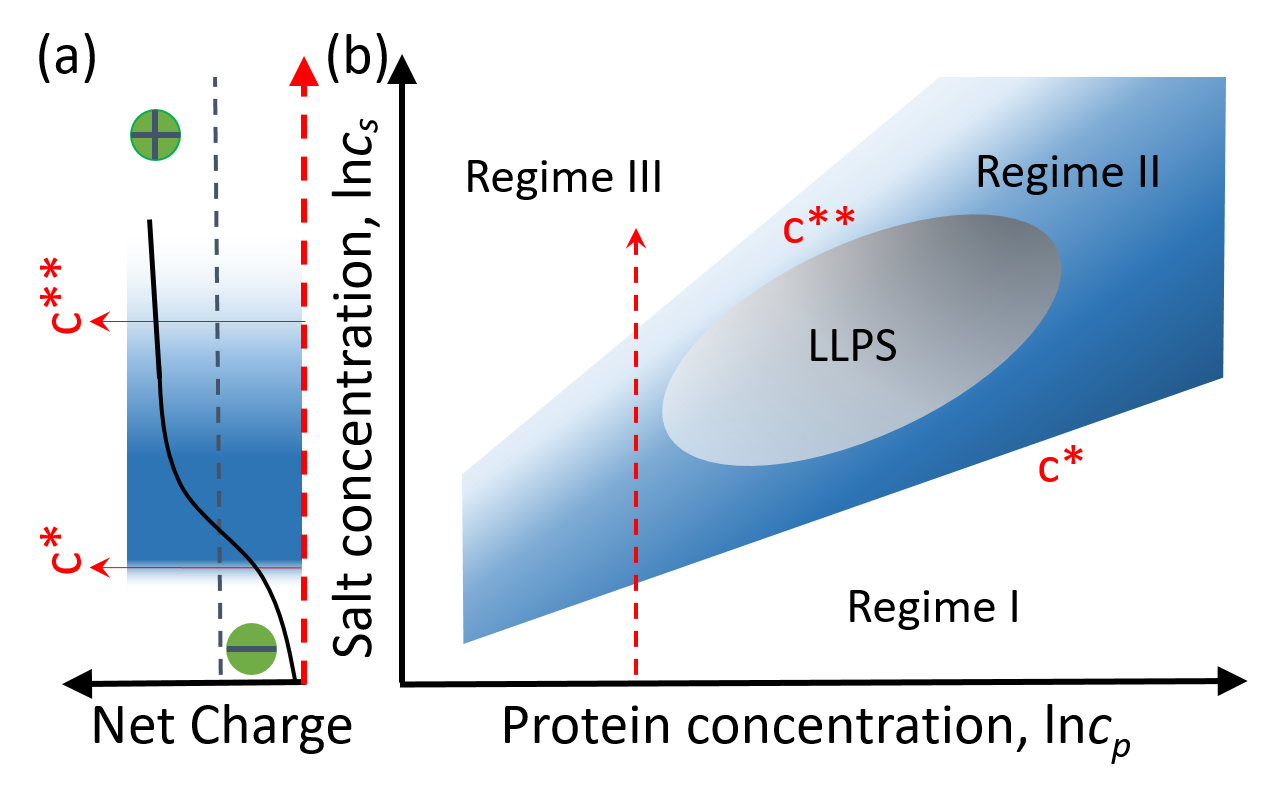
For the manipulation of the bulk phase behavior different strategies have been demonstrated. On the one hand, the use of co-solvents such as glycerol to stabilize a protein solution Vagenende et al. (2009) can help to avoid protein aggregation and cluster formation. On the other hand, enzymatic crosslinking Saricay et al. (2012) or the use of trivalent ions such as yttrium cations can be employed to trigger bridge formation between globular proteins, which can lead to cluster formation, reentrant condensation and liquid-liquid phase separation (Fig. 1) Zhang et al. (2008, 2012).
Protein adsorption at solid-liquid interfaces occurs in many natural processes, and its understanding is crucial in many fields, ranging from biotechnology, biology, pharmacology, and medicine to environmental science and food processing with relevance in many applications Rabe et al. (2011). In particular, it is the first step in numerous biological processes, such as the blood coagulation cascade, transmembrane signaling and adhesion of particles (bacteria or cells) Rabe et al. (2011), and therefore plays a key role in biomedical devices, including biosensors, biochips, soft contact lenses and biomaterials for implants Castner (2017).
Bovine serum albumin (BSA) is considered as one of the model proteins for adsorption studies Schöttler et al. (2016). In solution, BSA is a globular protein with well-characterized physico-chemical properties Su et al. (1999). Serum albumin is the most abundant blood protein in mammals, and its adsorption has been intensely studied with different methods, under various conditions Rabe et al. (2011); Lu et al. (2007); Gray (2004); SM . Nevertheless, controlling the interactions and connecting to the bulk behavior remains a challenge. In that context, the use of multivalent ions Kandori et al. (2010); Anbazhagan et al. (2016); Lee et al. (2013) offers a viable path, with the unique opportunity to tailor and even invert the charge state of proteins as well as surfaces by overcompensation Zhang et al. (2008, 2012); Sauter et al. (2015), which has been demonstrated to be a rather universal approach Zhang et al. (2010).
In this Letter, we demonstrate the use of multivalent ions (Y3+) to control the interaction of BSA with SiO2 interfaces. We find reentrant interface adsorption behavior, reflecting in an intriguing way the bulk phase behavior [Fig. 1 (b)]. Furthermore, we show that both bulk and interface adsorption behavior can be modeled consistently by statistical mechanics of ion-activated patches Roosen-Runge et al. (2014).
BSA (molecular weight = 66 kDa) and YCl3 were obtained from Sigma Aldrich and used as received. BSA is net negatively charged above its isoelectric point of pH = Zhang et al. (2008). Protein solutions were prepared by mixing the stock solutions at temperature = 20 ∘C. The working protein concentration was set to 20 mg/mL and the trivalent salt concentration ranged from 0.5 - 40 mM [depicted by the red arrow in Fig. 1 (b)]. With increasing , protein solutions undergo a reentrant condensation (RC) phase behavior in regime III. An aggregation regime II occurs in between two salt concentrations, and as illustrated in Fig. 1 (a-b). The physical mechanisms behind the observed RC behavior are the effective inversion of protein charge [Fig. 1 (a)] and a cation-mediated anisotropic attraction Roosen-Runge et al. (2014); Zhang et al. (2008). The effective interactions between proteins are reflected in the behavior of the reduced second virial coefficient . defines the second viral coefficient of the solution
| (1) |
The second viral coefficient of hard spheres is defined by = , where is the radius of the protein. Experimental (orange inset, Fig. 2) were determined using small-angle X-ray scattering (SAXS) (ID02 at the ESRF in Grenoble, France) Braun et al. (2017).
The adsorption studies were performed on standard Si wafers with native oxide layer. Before each measurement, all components of the liquid cell were cleaned at 50 ∘C ultrasonication in acetone, isopropanol, and degassed water for 10 min in each solvent. Ellipsometry (Woollam VASE M-2000 and Beaglehole Picometer) was employed in situ at the Brewster angle of 68∘ (for SiO2) to extract an effective protein layer thickness , assuming a Cauchy layer with density corresponding to that of pure BSA (i.e. volume fraction of 1; see Supporting Material SM for definition of , which includes Refs. Hlady and Andrade (1988); Tilton et al. (1990); Rabe et al. (2009); Su et al. (1998); Rabe et al. (2008); Larsericsdotter et al. (2005); Giacomelli and Norde (2001); Tarasevich and Monakhova (2002); Roach et al. (2005); Mondon et al. (2003); Elwing (1998); Tsargorodskaya et al. (2004); Sauter (2011); Herzinger et al. (1998); Schiebener et al. (1990); Voinova et al. (2002); Feiler et al. (2007)). Complementary studies were performed using neutron reflectometry (NR) at the INTER beam line at ISIS (Rutherford Laboratory, Didcot, UK) Webster et al. (2006); Skoda et al. (2009), as well as quartz crystal microbalance (QCM, Q-Sense Analyzer Biolin Scientific), confirming the trends in the adsorption behavior SM . For better comparability, the thicknesses extracted from NR and QCM-D are also normalized to an assumed BSA volume fraction of 1 SM .
Based on real-time ellipsometric data of the adsorption kinetics, we extract in the long-time limit (saturation after min) and plot it in Fig. 2 as a function of . It is convenient to use a dimensionless salt axis, i.e. , especially when comparing to theory. Both BSA and SiO2 surfaces are net negatively charged in water (no added salt). Under these conditions the electrostatic repulsion among the proteins dominates the solution compared to the repulsion between the proteins and the solid surface leading to a minimum of the protein adsorption. Evaluation of the ellipsometric data shows that then only a of nm is adsorbed. Upon increasing to 1.3 mM still in the clear regime I as illustrated in Fig. 1 (b), increases to nm (solid triangles in Fig. 2). In our system, we assume a of nm Yohannes et al. (2010); SM and define one monolayer equivalent (ML) to be nm SM , corresponding in regime I at 1.3 mM to the formation of ¿ 1 ML.
In regime II, increases towards a maximum value of nm (¿ 1 ML) at = 4 mM (empty diamonds, Fig. 2). At still higher , decreases down to nm approaching the upper boundary of regime II at . Note that in regime II (empty diamonds) the bulk solution is centrifuged before the adsorption experiments, which explains the jump of in the transition region between regime II and III. This is done because the solution in regime II is too turbid due to extensive protein cluster formation, which causes massive bulk light scattering and a lack of sensitivity of the ellipsometer. We show both data sets at = 40 (centrifuged and non-centrifuged) to account for the experimental difference, which, importantly, does not affect the overall adsorption trend.
In regime III close to , is nm at = 12 mM, but with increasing , decreases down to a plateau value of 4.5 nm above 30 mM (solid squares in Fig. 2). then corresponds to slightly less than one full ML. These experimental results are supported by complementary measurements (NR and QCM) SM . It is interesting to note that after rinsing with pure water the surface retains an irreversibly bound layer of protein with = 4 nm.
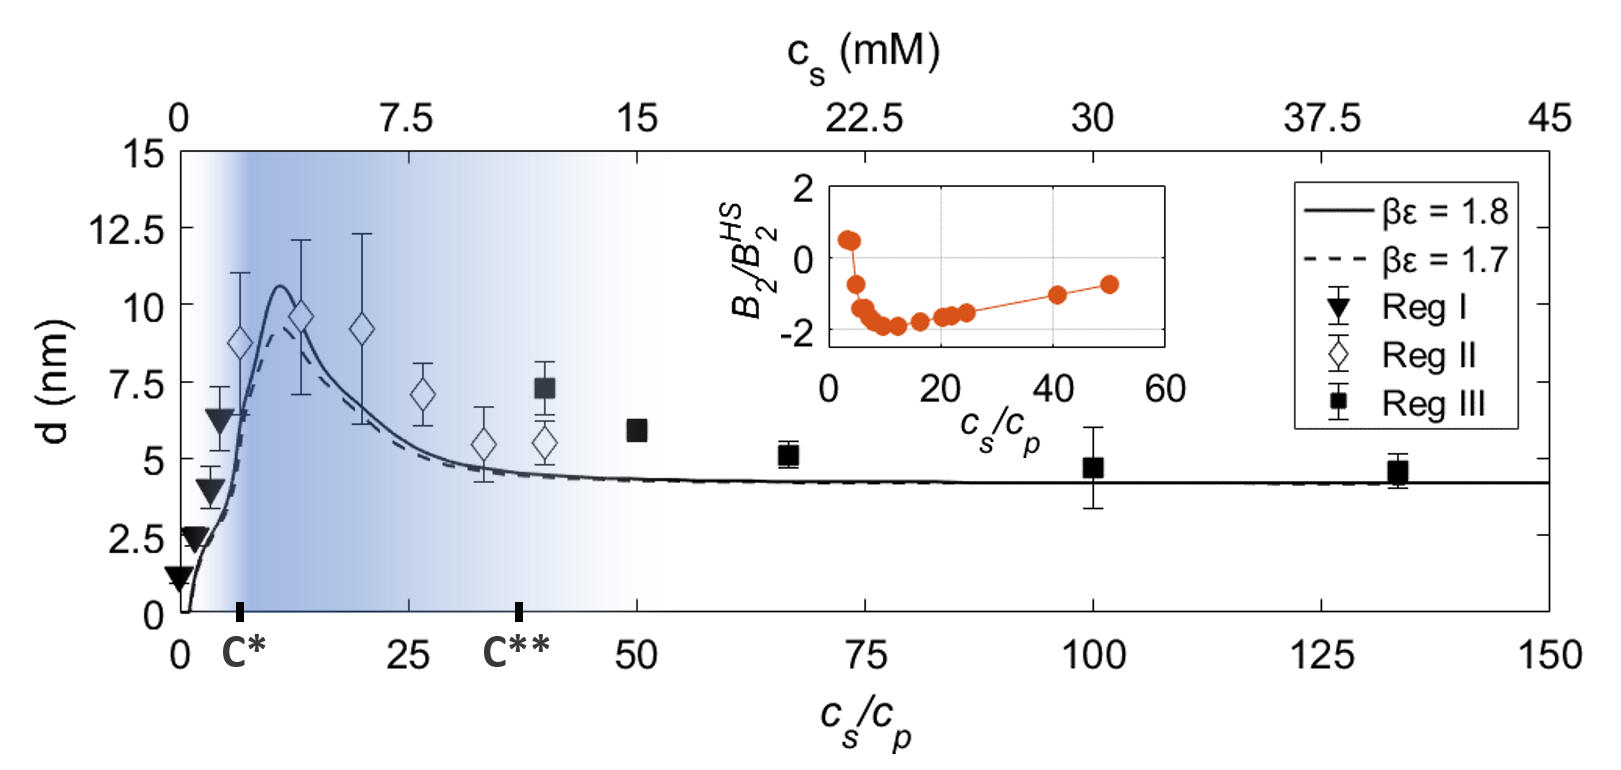
To understand the adsorption behavior, it is important to realize that the behavior of is closely related to that of of the bulk solution (inset, Fig. 2). In regime II, the value of is clearly negative indicating a strong overall attraction between proteins compared to regime I and III. Note that this is not the definition of the regimes nor its boundaries, but rather is an important observation. The net attraction between proteins is reflected by a sharp adsorption maximum. This observation indicates that the protein adsorption in our system is closely related to the bulk behavior, which can successfully be accounted for by the model for ion-activated attractive patches as a mechanism for interactions in protein-salt mixtures Roosen-Runge et al. (2014). This model is formulated within the Wertheim theory for associating fluids Jackson et al. (1988); Chapman et al. (1988); Wertheim (1984a, b, 1986a, 1986b); Romano et al. (2010); Russo et al. (2011); Pawar and Kretzschmar (2010), and treats proteins as hard spheres with radius and distinct and independent binding sites (patches) Pawar and Kretzschmar (2010). These sites can be occupied by salt ions, thereby activating a given patch (ion binding). The occupation probability of a site is given by , where denotes the salt chemical potential, , and the binding energy Roosen-Runge et al. (2014). A bond between two patches of distinct proteins is possible only if an activated patch meets a de-activated one (ion bridge). As a result, controls the protein-protein interactions. Note, however, that only the proteins are represented explicitly in this model. This implies that as a function of cannot be predicted self-consistently within this approach. We use the location of the minimum of the experimentally determined in order to calibrate .
The resulting phase diagram of the model accounts for key features of the rather rich experimental phase diagram, such as reentrant condensation and a closed-loop LLPS binodal schematically shown in Fig. 1 (b) Roosen-Runge et al. (2014). The model also allows predictions of regions in the phase diagram which are populated by protein clusters. A quantitative measure for this is , the fraction of proteins in clusters. In the present study we assume that in region II at least of the proteins are part of clusters, i.e., to define and .
While the experimental results presented here suggest that the bulk behavior dominates the adsorption trend, the key point in the present study is the protein adsorption at a charged planar wall, which implies breaking the translational symmetry of the system. To this end, we employ classical density functional theory (DFT) Evans (1979) which provides a powerful and well-established framework to investigate inhomogeneous density distributions. Within DFT one can show rigorously Evans (1979) that a functional
| (2) |
of the inhomogeneous density profile exists and takes its minimum, the grand potential, at the equilibrium density distribution.
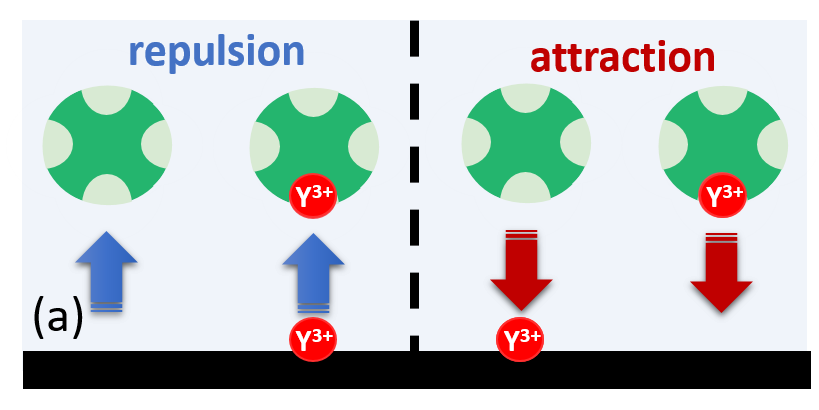
Using a DFT formulation of the Wertheim theory Yu and Wu (2002) based on fundamental measure theory (FMT) for hard spheres Rosenfeld (1989); Roth (2010), we calculate at the SiO2-water interface. This interface is charged and strongly attracts yttrium ions, which in turn attract proteins towards the wall [Fig. 3 (a)]. Effectively, this can be described by a short-ranged external potential acting on the proteins, where is the distance normal to the SiO2 wall. We set for in order to represent a steric repulsion between proteins and the substrate and for . accounts for the rather short-ranged attraction induced by the yttrium ions condensed on the wall – which is in-line with recent experimental observations Lee et al. (2013). Here, we employ a Gaussian form with the range of attraction being roughly one protein diameter, which effectively accounts for the range of the screened electrostatic interactions between ions and the wall, and between ions and proteins.
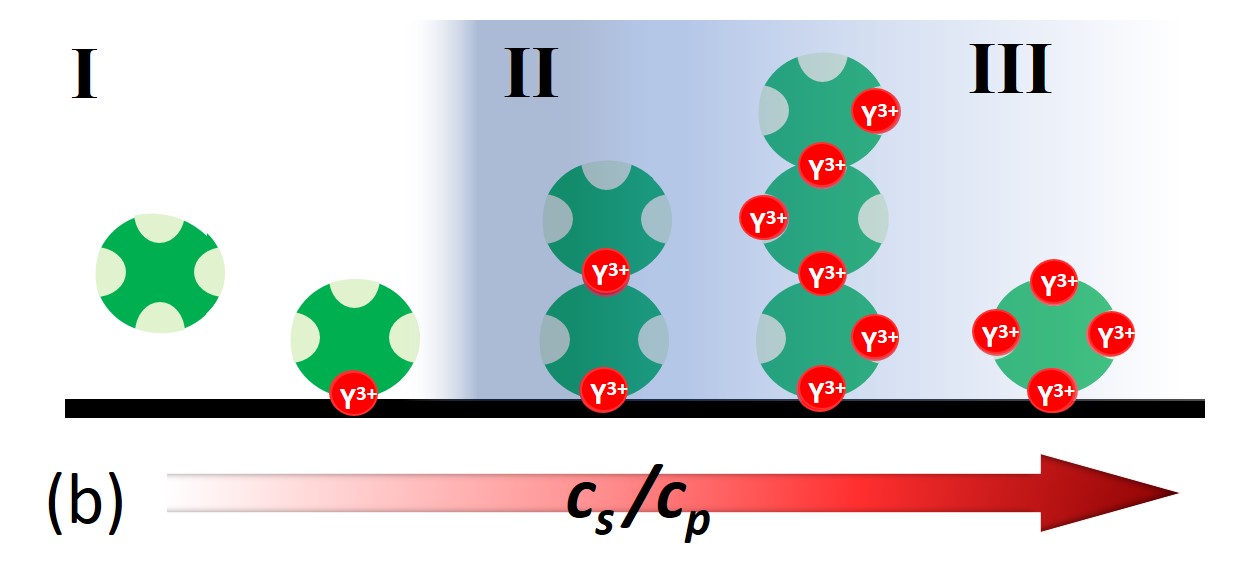
The strength of the external potential depends on the occupation probability of the protein binding sites. This form can be motivated by the following arguments. A sketch is presented in Fig. 3. At low , when , only a few proteins are subjected to the attraction of the wall induced by the ions. As increases, more ions mediate the attractions between the wall and the proteins. At the same time the protein-protein attraction increases accordingly, which leads in turn to an increase in . At very high (), the mechanism for the wall attraction remains, while the protein-protein interaction becomes weak since a majority of the binding sites are occupied so that salt ions can no longer cause a patchy attraction between the proteins. Therefore, one expects from our model ML of proteins to be adsorbed on the wall for .
In Fig. 2 (solid and dashed lines), we show the value of in nm as a function of for a volume packing fraction , corresponding to mg/mL along the path indicated by the red dashed arrow in Fig. 1 (b). We choose and Roosen-Runge et al. (2014). The protein adsorption is computed from the inhomogeneous density profile , obtained the DFT for our activated patch model. In order to compare to experiments, we define as the distance from the wall where is at least 50 higher than the bulk density . For suitable values of [ (solid curve), and (dashed curve)], we find very good, semi-quantitative agreement between theory and experiment. For high values of , we find a finite related to ML similar to the experiments. Note that the fraction of proteins in clusters in the bulk system is directly related to the behavior of the layer thickness of proteins at the wall.
Our theoretical results confirm that ion binding at the protein surface drives the experimentally observed non-monotonic adsorption behavior, thereby reflecting the underlying bulk interactions. In particular, the remarkable agreement between experiment and theory (considering in particular the few parameters involved) emphasizes that our model of ion-activated attractive patchy particles, subjected to an effective external wall potential, captures the essential effects of the protein adsorption at a charged surface in the presence of multivalent salt ions. Our model is kept intentionally simple with a minimum number of parameters, which helps us to identify the key mechanism responsible for the behavior of the system, namely the ion-activated patchy interactions of the proteins. Importantly, using our model we can explore the adsorption behavior of our system in different parts of the bulk phase diagram. As we increase the protein concentration approaching the LLPS region the adsorbed film thickness increases. We find a complete wetting regime in which becomes even macroscopically thick SM . Qualitatively we find similar behavior as shown in Fig. 2 with a maximum for ¡¡.
In conclusion, we have demonstrated that multivalent ions can be employed not only to control the bulk interactions and bulk phase behavior of proteins such as BSA, but also its adsorption behavior at a charged interface such as water-SiO2. We observe reentrant effects at the interface, which reflects the bulk behavior, measured by , in an intriguing way. Furthermore, the experimental data can be explained and understood by theoretical calculations within the framework of classical DFT based on a model of ion-activated patchy interactions and their associated statistics. In addition to the fundamental implications of the first-time demonstration of this ion-activated patch model in the context of the symmetry break brought about by an interface, our approach may pave the way to controlled nucleation at interfaces in regime II and possibly protein crystallization under new conditions.
Acknowledgements.
Funding by the DFG and Carl-Zeiss-Stiftung is gratefully acknowledged.References
- Rabe et al. (2011) M. Rabe, D. Verdes, and S. Seeger, Adv. Colloid Interface Sci 162, 87 (2011).
- Rein ten Wolde and Frenkel (1997) P. Rein ten Wolde and D. Frenkel, Science 277, 1975 (1997).
- Whitelam (2010) S. Whitelam, Phys. Rev. Lett. 105, 088102 (2010).
- Fusco and Charbonneau (2013) D. Fusco and P. Charbonneau, Phys. Rev. E 88, 012721 (2013).
- Stradner et al. (2004) A. Stradner, H. Sedgwick, F. Cardinaux, W. C. Poon, S. U. Egelhaaf, and P. Schurtenberger, Nature 432, 492 (2004).
- Godfrin et al. (2015) P. D. Godfrin, S. D. Hudson, K. Hong, L. Porcar, P. Falus, N. J. Wagner, and Y. Liu, Phys. Rev. Lett. 115, 228302 (2015).
- Schmidt et al. (2008) U. Schmidt, G. Guigas, and M. Weiss, Phys. Rev. Lett. 101, 128104 (2008).
- Yan et al. (2013) J. Yan, M. Enge, T. Whitington, K. Dave, J. Liu, I. Sur, B. Schmierer, A. Jolma, T. Kivioja, and M. Taipale, Cell 154, 801 (2013).
- Monks et al. (1998) C. R. Monks, B. A. Freiberg, H. Kupfer, N. Sciaky, and A. Kupfer, Nature 395, 82 (1998).
- Kakio et al. (2001) A. Kakio, S.-i. Nishimoto, K. Yanagisawa, Y. Kozutsumi, and K. Matsuzaki, J. Biol. Chem. 276, 24985 (2001).
- Aguzzi and O’Connor (2010) A. Aguzzi and T. O’Connor, Nat. Rev. Drug Discov 9, 237 (2010).
- Sear (1999) R. P. Sear, J. Chem. Phys. 111, 4800 (1999).
- Goegelein (2008) C. Goegelein, J. Chem. Phys. 129, 085102 (2008).
- Vagenende et al. (2009) V. Vagenende, M. G. S. Yap, and B. L. Trout, Biochemistry 48, 11084 (2009).
- Saricay et al. (2012) Y. Saricay, S. K. Dhayal, P. A. Wierenga, and R. de Vries, Farad. Discuss 158, 51 (2012).
- Zhang et al. (2008) F. Zhang, M. W. A. Skoda, R. M. J. Jacobs, S. Zorn, R. A. Martin, C. M. Martin, G. F. Clark, S. Weggler, A. Hildebrandt, O. Kohlbacher, and F. Schreiber, Phys. Rev. Lett. 101, 148101 (2008).
- Zhang et al. (2012) F. Zhang, R. Roth, M. Wolf, F. Roosen-Runge, M. W. A. Skoda, R. M. J. Jacobs, M. Stzucki, and F. Schreiber, Soft Matter 8, 1313 (2012).
- Castner (2017) D. G. Castner, Biointerphases 12, 02C301 (2017).
- Schöttler et al. (2016) S. Schöttler, G. Becker, S. Winzen, T. Steinbach, K. Mohr, K. Landfester, V. Mailänder, and F. R. Wurm, Nat. Nanotech (2016).
- Su et al. (1999) T. J. Su, J. R. Lu, R. K. Thomas, and Z. F. Cui, J. Phys. Chem. B 103, 3727 (1999).
- Lu et al. (2007) J. R. Lu, X. Zhao, and M. Yaseen, Curr. Opin. Colloid Interface Sci. 12, 9 (2007).
- Gray (2004) J. J. Gray, Curr. Opin. Struct. Biol 14, 110 (2004).
- (23) Supporting Material .
- Kandori et al. (2010) K. Kandori, S. Toshima, M. Wakamura, M. Fukusumi, and Y. Morisada, J. Phys. Chem. B 114, 2399 (2010).
- Anbazhagan et al. (2016) E. Anbazhagan, A. Rajendran, D. Natarajan, M. Kiran, and D. K. Pattanayak, Colloids Surf., B 143, 213 (2016).
- Lee et al. (2013) S. S. Lee, M. Schmidt, N. Laanait, N. C. Sturchio, and P. Fenter, J. Phys. Chem. C 117, 23738 (2013).
- Sauter et al. (2015) A. Sauter, F. Roosen-Runge, F. Zhang, G. Lotze, R. M. J. Jacobs, and F. Schreiber, J. Am. Chem. Soc 137, 1485 (2015).
- Zhang et al. (2010) F. Zhang, S. Weggler, M. J. Ziller, L. Ianeselli, B. S. Heck, A. Hildebrandt, O. Kohlbacher, M. W. Skoda, R. M. Jacobs, and F. Schreiber, Proteins 78, 3450 (2010).
- Roosen-Runge et al. (2014) F. Roosen-Runge, F. Zhang, F. Schreiber, and R. Roth, Sci. Rep. 4, 7016 (2014).
- Braun et al. (2017) M. K. Braun, M. Wolf, O. Matsarskaia, S. Da Vela, F. Roosen-Runge, M. Sztucki, R. Roth, F. Zhang, and F. Schreiber, J. Phys. Chem. B 121, 1731 (2017).
- Zhang et al. (2014) F. Zhang, F. Roosen-Runge, A. Sauter, M. Wolf, R. M. J. Jacobs, and F. Schreiber, Pure Appl. Chem. 86, 191 (2014).
- Hlady and Andrade (1988) V. Hlady and J. D. Andrade, Colloids Surf. 32, 359 (1988).
- Tilton et al. (1990) R. D. Tilton, C. R. Robertson, and A. P. Gast, J. Colloid Interface Sci. 137, 192 (1990).
- Rabe et al. (2009) M. Rabe, D. Verdes, and S. Seeger, Soft Matter 5, 1039 (2009).
- Su et al. (1998) T. J. Su, Lu, R. K. Thomas, Z. F. Cui, and J. Penfold, J. Phys. Chem. B 102, 8100 (1998).
- Rabe et al. (2008) M. Rabe, D. Verdes, J. Zimmermann, and S. Seeger, J. Phys. Chem. B 112, 13971 (2008).
- Larsericsdotter et al. (2005) H. Larsericsdotter, S. Oscarsson, and J. Buijs, J. Colloid Interface Sci. 289, 26 (2005).
- Giacomelli and Norde (2001) C. E. Giacomelli and W. Norde, J. Colloid Interface Sci 233, 234 (2001).
- Tarasevich and Monakhova (2002) Y. I. Tarasevich and L. I. Monakhova, Colloid J. 64, 482 (2002).
- Roach et al. (2005) P. Roach, D. Farrar, and C. C. Perry, J. Am. Chem. Soc 127, 8168 (2005).
- Mondon et al. (2003) M. Mondon, S. Berger, and C. Ziegler, Anal. Bioanal. Chem 375, 849 (2003).
- Elwing (1998) H. Elwing, Biomaterials 19, 397 (1998).
- Tsargorodskaya et al. (2004) A. Tsargorodskaya, A. V. Nabok, and A. K. Ray, Nanotechnology 15, 703 (2004).
- Sauter (2011) A. Sauter, Crystallization and phase behavior of aqueous beta-Lactoglobulin solutions in the presence of multivalent cations, Diploma thesis (2011).
- Herzinger et al. (1998) C. Herzinger, B. Johs, W. McGahan, J. A. Woollam, and W. Paulson, J. Appl. Phys 83, 3323 (1998).
- Schiebener et al. (1990) P. Schiebener, J. Straub, J. Levelt Sengers, and J. Gallagher, J. Phys. Chem. Ref. Data 19, 677 (1990).
- Voinova et al. (2002) M. Voinova, M. Jonson, and B. Kasemo, Biosens. Bioelectron 17, 835 (2002).
- Feiler et al. (2007) A. A. Feiler, A. Sahlholm, T. Sandberg, and K. D. Caldwell, J. Colloid Interface Sci 315, 475 (2007).
- Webster et al. (2006) J. Webster, S. Holt, and R. Dalgliesh, Phys. B: Condens. Matter , 1164 (2006).
- Skoda et al. (2009) M. Skoda, F. Schreiber, R. Jacobs, J. Webster, M. Wolff, R. Dahint, D. Schwendel, and M. Grunze, Langmuir 25, 4056 (2009).
- Yohannes et al. (2010) G. Yohannes, S. K. Wiedmer, M. Elomaa, M. Jussila, V. Aseyev, and M. L. Riekkola, Ana. Chim. Acta 675, 191 (2010).
- Jackson et al. (1988) G. Jackson, W. Chapman, and K. Gubbins, Mol. Phys. 65, 1 (1988).
- Chapman et al. (1988) W. Chapman, G. Jackson, and K. Gubbins, Mol. Phys. 65, 1057 (1988).
- Wertheim (1984a) M. Wertheim, J. Stat. Phys. 35, 19 (1984a).
- Wertheim (1984b) M. Wertheim, J. Stat. Phys. 35, 35 (1984b).
- Wertheim (1986a) M. Wertheim, J. Stat. Phys. 42, 459 (1986a).
- Wertheim (1986b) M. Wertheim, J. Stat. Phys. 42, 477 (1986b).
- Romano et al. (2010) F. Romano, E. Sanz, and F. Sciortino, J. Chem. Phys. 132, 184501 (2010).
- Russo et al. (2011) J. Russo, J. Tavares, P. I. C. Teixeira, M. T. Da Gama, and F. Sciortino, J. Chem. Phys. 135, 034501 (2011).
- Pawar and Kretzschmar (2010) A. B. Pawar and I. Kretzschmar, Macromol. Rapid Commun. 31, 150 (2010).
- Evans (1979) R. Evans, Adv. Phys. 28, 143 (1979).
- Yu and Wu (2002) Y.-X. Yu and J. Wu, J. Chem. Phys. 116, 7094 (2002).
- Rosenfeld (1989) Y. Rosenfeld, Phys. Rev. Lett. 63, 980 (1989).
- Roth (2010) R. Roth, J. Phys.: Condens. Matter 22, 063102 (2010).