Stellar density distribution along the minor axis of the Large Magellanic Cloud
Abstract
We studied the spatial distribution of young and old stellar populations along the western half part of the minor axis of the Large Magellanic Cloud (LMC) using Washington photometry of selected fields, which span a deprojected distance range from the LMC bar centre out to 31.6 kpc. We found that both stellar populations share a mean LMC limiting radius of 8.90.4 kpc; old populations are three times more dense that young populations at that LMC limit. When comparing this result with recent values for the LMC extension due to north, the old populations resulted significantly more elongated than the young ones. Bearing in mind previous claims that the elongation of the outermost LMC regions may be due to the tidal effects of the Milky Way (MW), our findings suggest that such a tidal interaction should not have taken place recently. The existence of young populations in the outermost western regions also supports previous results about ram pressure stripping effects of the LMC gaseous disc due to the motion of the LMC in the MW halo.
keywords:
techniques: photometric – galaxies: individual: LMC – galaxies: star clusters: general1 Introduction
The advent of wide-field imaging databases has recently exploited to provide new insights about the geometry and extension of the Large Magellanic Cloud (LMC) (e.g. Besla et al., 2016; Jacyszyn-Dobrzeniecka et al., 2017). The direction due to north from its centre has been explored (Balbinot et al., 2015; Mackey et al., 2016), as well as that towards the Magellanic Bridge (MB) (e.g. Skowron et al., 2014; Wagner-Kaiser & Sarajedini, 2017). The main results reveal a smooth transition of the metallicity and distance distributions of MB RR Lyrae stars that connect both Magellanic Clouds, and an intrinsic eccentricity of the old field star distribution in the LMC outer regions with its major axis roughly pointing towards the Milky Way (MW).
The western half part of the minor axis of the LMC is at an intermediate direction between those to the north and towards the MB. As far as we are aware, it has not been considered for estimating the LMC extension. Nevertheless, it could shed new light in the context of the tidal interactions of the LMC with the MW and the Small Magellanic Cloud (SMC). For instance, it is opposite to the direction of the motion of the LMC in the MW halo (Besla et al., 2007; Kallivayalil et al., 2013); the H I column density map from the Parkes Galactic All-Sky Survey (GASS, Kalberla & Haud, 2015) shows extended regions of gas there, in contrast with its distribution in the northern outermost LMC disc; the isodensity curves of field stars (van der Marel, 2001) and star clusters (Bica et al., 2008; Sitek et al., 2016) are seemingly compressed towards this direction respect to the eastern side of the galaxy, among others.
In this work, we have taken advantage of the Washington photometric data set described in Piatti et al. (2017) and used elsewhere (Piatti & Cole, 2017; Piatti, 2017). From Hess diagrams (Section 2), we constructed the deprojected stellar density distributions for young and old field stars (Section 3). We analysed in Section 4 their differences and compared our results with stellar density profiles derived from the Dark Energy Survey (DES) data sets. Finally, in Section 5, we summarize the main conclusions of this work.
2 Overview of the data set
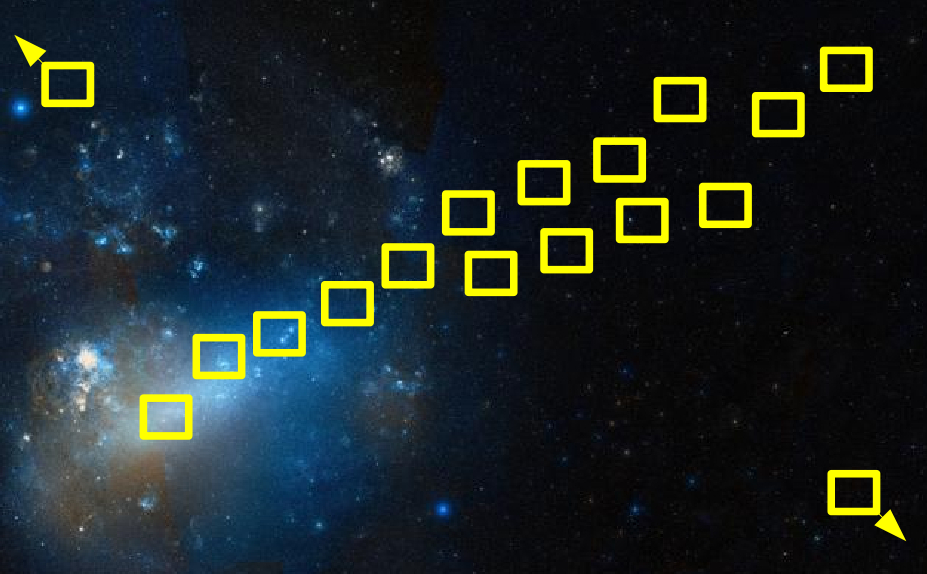
The whole data set comprises 17 different LMC fields (3636 wide each) distributed along the LMC minor axis as illustrated in Fig. 1. They were imaged through the Washington and Kron-Cousins filters with the Mosaic II camera attached at the Cerro-Tololo Inter-American Observatory (CTIO) 4 m Blanco telescope during the nights Dec 27-30, 2008 (typical seeing 1.1, airmass range 1.2-1.6). The Kron-Cousins filter was employed as the recommended substitute of the Washington filter (Geisler, 1996).
The data processing included different tasks, among them, to perform overscan, trimming, bias subtraction and flat-field corrections and to update the world coordinate system (WCS), following the procedures documented by the NOAO Deep Wide Field Survey team (Jannuzi et al., 2003). In order to standardize the stellar photometry we measured nearly 270 independent magnitudes in the standard fields PG0321+051, SA 98 and SA 101 (Landolt, 1992; Geisler, 1996), observed three times per night. We derived mean extinction and colour term coefficients for the four nights of (0.29,-0.09), (0.14,-0.24) and (0.08,-0.02) and rms errors of 0.030, 0.021, and 0.024 in , , and , respectively.
The stellar photometry for each single mosaic was obtained after deriving the respective quadratically varying point-spread-function (PSF). The procedure to derive PSF magnitudes of the stars identified in each field consisted in applying the resultant PSF and identifying new fainter stars in the output subtracted frame to enlarge the star sample. We iterated this loop three times. The photometric errors were estimated from artificial star tests performed on synthetic images created by adding nearly 5 per cent of the measured stars. For the sake of the readers we refer to Piatti et al. (2017).
3 LMC star field Hess diagrams
We used the Washington versus colour-magnitude diagrams (CMD) to delineate the regions where to count the number of stars per field, and thus to produce the stellar density distribution as a function of the deprojected distance from the LMC centre. Because of the number of stars measured per magnitude interval depends on the completeness of the photometry, we first computed the respective completeness fractions. To do this, we used the stand-alone addstar program in the daophot package (Stetson et al., 1990) to add synthetic stars, generated at random with respect to position and magnitude, to the deepest images in order to derive their completeness levels. We added a number of stars equivalent to 5 of the measured stars in order to avoid in the synthetic images significantly more crowding than in the original ones. On the other hand, to avoid small number statistics in the artificial-star analysis, we created a thousand different images for each original image. We used the option of entering the number of photons per ADU in order to properly add the Poisson noise to the star images.
We then performed stellar photometry using the star-finding and point-spread-function (PSF) fitting routines in the daophot/allstar suite of programs (Stetson et al., 1990). We then used the allstar program to apply the previously obtained PSF to the identified stellar objects and to create a subtracted image which was used to find and measure magnitudes of additional fainter stars. This procedure was repeated three times per image. The star-finding efficiency was estimated by comparing the output and the input data for these stars using the daomatch and daomaster tasks. We illustrate in Fig. 2 the resultant completeness fraction for the densest studied field, located close to the midst of the LMC bar.

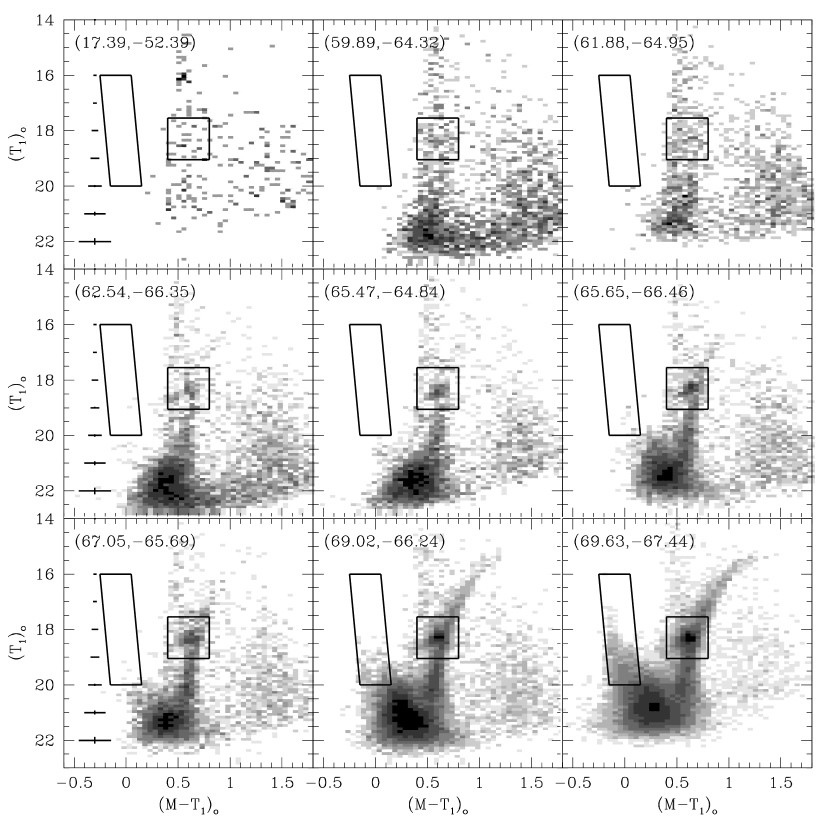
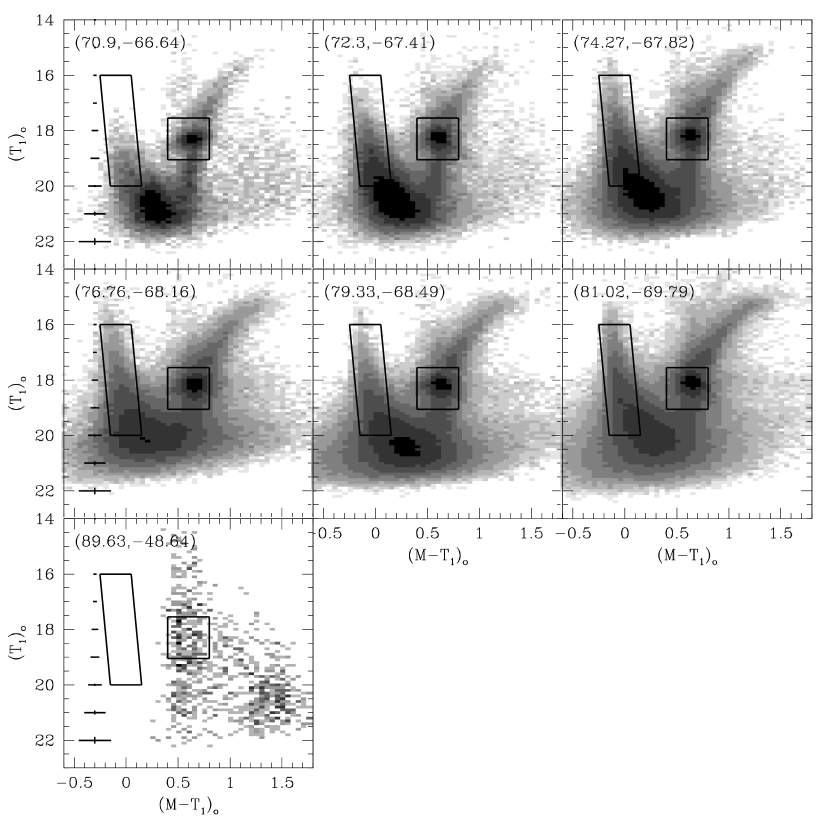
The global properties of the CMDs are depicted in Fig. 3 as Hess diagrams (the darker a CMD region the more numerous the stellar population at that position), so that the frequency or density of occurrence of stars at various positions can also be seen. The figure also includes the errorbars as recovered from the photometry of synthetic stars. The Hess diagrams present the signature of the MW foreground field which blurs particularly the LMC outskirts main features. Background galaxies have been excluded by constraining the photometric data sets to objects with 2, photometric error less than 2 above the mean error at a given magnitude, and SHARP 0.5. Old main sequence (MS) populations are seen in the outermost fields, and increasing younger populations (brighter MS turnoffs) for inner LMC fields. Thus, the series of panels depicted in Fig. 3 show the age transition of the stellar populations along the western side of the minor axis of the LMC.
In order to clean the CMDs from the MW contamination we generated synthetic CMDs for each LMC field using the Besançon galactic model (Robin et al., 2003), thus coping with the MW star field variation with the Galactic latitude. The ingredients we took into account are as follows: an area equal to that of our studied fields and the respective Galactic coordinates, a distance interval from 0 up to 50 kpc in steps of 0.5 kpc, a recommended mean diffuse absorption of 0.7 mag/kpc, no restriction in the absolute magnitude, MK spectral types and luminosity, and the Johnson-Cousins and ( ) filters. We scaled the synthetic CMDs using as reference the number of stars per magnitude and colour intervals counted in the CMDs of two fields located well beyond the LMC (see boxes with an arrow in Fig. 1). Because of the position of these two fields, they were suitable for checking variations in the MW CMDs.
4 Stellar density profiles
We counted the number of stars distributed along the MS and at the red clump (RC) as representatives of the stellar densities of young (age 1 Gyr) and old (age 1 Gyr) populations (see, Balbinot et al., 2015). The MS strip is delimited by the straight line = 40.0 + 26.0 and a parallel line shifted () = 0.3 mag towards redder colours, and the magnitudes 16.0 and 20.0, respectively. As for the RC, we chose a box delimited by = 0.40 and 0.80 mag, and = 17.55 and 19.05 mag, respectively. Note that by using the colour instead of or -also available in our database-, reddening and metallicity effects are minimized (Canterna, 1976). Fig. 3 depicts these defined CMDs regions for comparison purposes.
These two CMD regions were selected on the basis of the positions of theoretical isochrones of Bressan et al. (2012) with ages and metallicities embracing the values known for the age-metallicity relationship of the LMC (Piatti & Geisler, 2013), namely: for young populations we considered [Fe/H] values between -0.5 and -0.1 dex, while for the old populations we expanded the range -1.2 - -0.1 dex.
Since we dealt with CMDs affected by different amounts of interstellar extinction, we interpolated values in the Magellanic Clouds (MCs) extinction map obtained from the RC and RR Lyrae stellar photometry provided by the OGLE III collaboration (Haschke et al., 2011), and used the values provided by the NASA/IPAC Extragalactic Database111http://ned.ipac.caltech.edu/. NED is operated by the Jet Propulsion Laboratory, California Institute of Technology, under contract with NASA. (NED) for fields located beyond the area covered by the MCs extinction map. From them we properly shifted the adopted MS strip and RC box prior counting the number of stars lying within them. We recall that Haschke et al. (2011) found very low reddenings in the LMC bar region (see, also, Piatti, 2017). In performed this task we used the equations / = 0.90 and / = 2.62 (Geisler, 1996). As can be seen in Fig. 3, with the adopted values, the defined MS strip and RC box encompass well the respective observed stellar population.
We also corrected by incompleteness effects the number of stars counted, using the respective completeness curves (see Fig. 2). Note that we used stars with magnitudes much brighter than that for the 50 per cent completeness level. We followed the same procedure described above for counting the number of stars located within the selected regions in the MW synthetic CMDs, which we subtracted from the observed LMC stellar density profiles.
Uncertainties in the star counts come from the fact that a star, because of its photometric errors, can fall outside the defined MS strip or RC box, or vice-versa, so that the total amount of stars can change. Therefore, we considered the photometric errors and of each star inside the MS strips and RC boxes to estimate the errors in the respective star counts. In the case of the MW subtracted LMC stellar density profiles we considered in quadrature both the errors in the MW profile and those in the observed LMC ones.
5 analysis
Fig. 4 depicts the resultant stellar density profiles for young and old populations as a function of the deprojected distance. The latter were computed assuming an LMC disc with an inclination of 38.14, a position angle of the line-of-nodes of 129.51 and centred at R.A. = 05h 23m 34s, Dec. = 69 45 22 (J2000) (Balbinot et al., 2015). For the sake of the reader we also included those for the MW, which we subtracted from the observed LMC profiles to obtain the MW decontaminated ones. As can be seen, the stellar density variation of the MW is not significant across the observed LMC sky, and the subtraction of it becomes more important in the outskirts of the LMC, where the number of MW MS and RC stars are of the same order than those counted in the most distant fields from the LMC centre. This effect is taken into account by the size of the errorbars.
The most striking feature shown by Fig 4 is that both young and old populations extend similarly, although reaching different outermost stellar densities. Both profiles result indistinguishable from the respective MW levels at a deprojected distance of 8.9 0.4 kpc. This is not a usual picture seen towards other directions from the LMC centre, nor in the MW and other galaxies, where old populations usually reach larger distances than the young ones. For instance, Balbinot et al. (2015) using DES photometry along a fringe due to north found deprojected distances of 10.0 and 15.1 kpc for young and old populations, respectively. The same data set was exploited by Mackey et al. (2016) who found that at 18.5 kpc there is no evidence for LMC populations in any direction. We checked whether the different LMC centres adopted by Balbinot et al. and Mackey et al. and in this work could imply a non-negligible difference in the calculated deprojected distances. We found that neither the different centres nor the different most common values for the LMC inclination and position angle of the line-of-nodes result in so different deprojected distances as to dodge comparing them consistently.
We computed the ratio of radii towards the northern (Balbinot et al’s results) and western minor axis directions and found values of 1.1 and 1.7 for young and old populations, respectively. In case of using the Mackey et al’s results for the old populations, we found a ratio of 2.1. These results agree well with the Luminance filter images shown by Besla et al. (2016), where the LMC seems somehow compressed towards the western minor axis direction as compared to its northern extension, as well as with the isodensity curves traced from 2MASS data (van der Marel, 2001).
Some further spatial tracers are also interesting to consider. For instance, the H I column density map built from the GASS survey shows that gas is not as dense concentrated towards the north as along the western minor axis, in agreement with the relative spatial distribution of 567 OB star candidates listed by Casetti-Dinescu et al. (2012) (Moni Bidin et al., 2017, see their figure 7). According to Salem et al. (2015) and Indu & Subramaniam (2015) the H I spatial and velocity distributions witness the perturbation by ram pressure effects due to the motion of the LMC in the MW halo, i.e., some amount of gas could have traveled in the opposite direction to that motion. Particularly, Salem et al. (2015) found evidence that the LMC’s gaseous disc has recently experienced ram pressure stripping, with a truncated gas profile along the windward leading edge of the LMC disc.
van der Marel (2001) showed that the LMC has an intrinsic ecccentricity in its outer part, with an elongation in the general direction of the Galactic centre induced by the tidal force of the MW. Note that such an outer disc is off-centred from both the LMC bar and the kinematical centre (see figure 1 in Besla et al., 2016). The different ratios we found between radii estimated from DES data and in this work also support the notion that old populations are more elongated than young populations (see also Jacyszyn-Dobrzeniecka et al., 2017). Because old populations prevail in the outermost northern LMC fields, we infer that the MW tidal forces that caused such an elongation should not have acted recently, as for example, during the claimed first passage of the LMC to the MW (Besla et al., 2007; Kallivayalil et al., 2013). Note that such an elongation is also seen in the deprojected spatial distribution of clusters with ages between 1-3 Gyr (ratio between northern and western radii 2.2) (Piatti, 2014).
On the other hand, the similar radii found in this work for young and old populations along the western LMC minor axis confirm previous suggestions that ram pressure stripping could cause that the gaseous LMC volume moved windwards due to the motion of the LMC in the MW halo. This outcome also explains the recent (age 50 Myr) important star cluster formation activity that took place in the outermost western LMC regions (Piatti et al., 2017).


6 Conclusions
We used Washington photometry of 15 LMC fields (3636 wide each) distributed along the western half part of the minor axis of the LMC, and two additional reference MW fields, to trace the stellar density profile of LMC young and old populations. The whole sample of selected fields expands a baseline in deprojected distances from the LMC bar centre up to 31.6 kpc away.
In order to perform the count of stars we built CMDs and defined two regions: a strip along the young MS (age 1 Gyr) and a RC box for intermediate-age and old populations ( 1 Gyr). We took into account incompleteness effects in our photometry, reddening effects and the contamination from the MW foreground field. From the analysis of the resultant profiles, we draw the following conclusions:
Both young and old populations reach similar LMC boundaries, with a mean value of 8.9 0.4 kpc.
This LMC limit is significantly smaller than those found in previous studies of the extension of the LMC, which range between 15.0 and 18.5 kpc.
Old populations are nearly three times more dense that young populations at that LMC limit.
When comparing our values with those derived towards the north using the DES database, we found that, after correcting for projection effects, the old populations are significantly more elongated than the young ones. van der Marel (2001) had suggested that outer LMC regions are more elongated than the inner ones in the general direction of the Galactic centre because of the tidal forces of the MW. Here we confirm that pattern, that additional shows to be age-dependent: old populations prevail in the most elongated stellar distributions. The similar radii found for young and old populations along the western half part of the LMC minor axis also agree well with this picture.
The existence of young populations in the western outermost regions of the LMC is, in addition, an observational evidence of more recent ram pressure stripping due to the motion of the LMC in the MW halo. Because of that, the gaseous LMC disc shows a truncated density profile along the windward leading edge (east-northeast direction) and young field star and cluster populations in the western side of the LMC.
Acknowledgements
We thank the referee for his/her thorough reading of the manuscript and timely suggestions to improve it.
References
- Balbinot et al. (2015) Balbinot E., et al., 2015, MNRAS, 449, 1129
- Besla et al. (2007) Besla G., Kallivayalil N., Hernquist L., Robertson B., Cox T. J., van der Marel R. P., Alcock C., 2007, ApJ, 668, 949
- Besla et al. (2016) Besla G., Martínez-Delgado D., van der Marel R. P., Beletsky Y., Seibert M., Schlafly E. F., Grebel E. K., Neyer F., 2016, ApJ, 825, 20
- Bica et al. (2008) Bica E., Bonatto C., Dutra C. M., Santos J. F. C., 2008, MNRAS, 389, 678
- Bressan et al. (2012) Bressan A., Marigo P., Girardi L., Salasnich B., Dal Cero C., Rubele S., Nanni A., 2012, MNRAS, 427, 127
- Canterna (1976) Canterna R., 1976, AJ, 81, 228
- Casetti-Dinescu et al. (2012) Casetti-Dinescu D. I., Vieira K., Girard T. M., van Altena W. F., 2012, ApJ, 753, 123
- Geisler (1996) Geisler D., 1996, AJ, 111, 480
- Haschke et al. (2011) Haschke R., Grebel E. K., Duffau S., 2011, AJ, 141, 158
- Indu & Subramaniam (2015) Indu G., Subramaniam A., 2015, A&A, 573, A136
- Jacyszyn-Dobrzeniecka et al. (2017) Jacyszyn-Dobrzeniecka A. M., et al., 2017, Acta Astron., 67, 1
- Jannuzi et al. (2003) Jannuzi B. T., Claver J., Valdes F., 2003, The NOAO Deep Wide Field Survey MOSAIC Data Reductions, http://www.noao.edu/noao/noaodeep/ReductionOpt/frames.html
- Kalberla & Haud (2015) Kalberla P. M. W., Haud U., 2015, A&A, 578, A78
- Kallivayalil et al. (2013) Kallivayalil N., van der Marel R. P., Besla G., Anderson J., Alcock C., 2013, ApJ, 764, 161
- Landolt (1992) Landolt A. U., 1992, AJ, 104, 340
- Mackey et al. (2016) Mackey A. D., Koposov S. E., Erkal D., Belokurov V., Da Costa G. S., Gómez F. A., 2016, MNRAS, 459, 239
- Moni Bidin et al. (2017) Moni Bidin C., Casetti-Dinescu D. I., Girard T. M., Zhang L., Méndez R. A., Vieira K., Korchagin V. I., van Altena W. F., 2017, MNRAS, 466, 3077
- Piatti (2014) Piatti A. E., 2014, MNRAS, 437, 1646
- Piatti (2017) Piatti A. E., 2017, A&A, 606, A21
- Piatti & Cole (2017) Piatti A. E., Cole A., 2017, MNRAS, 470, L77
- Piatti & Geisler (2013) Piatti A. E., Geisler D., 2013, AJ, 145, 17
- Piatti et al. (2017) Piatti A. E., Cole A. A., Emptage B., 2017, preprint, (arXiv:1709.05244)
- Robin et al. (2003) Robin A. C., Reylé C., Derrière S., Picaud S., 2003, A&A, 409, 523
- Salem et al. (2015) Salem M., Besla G., Bryan G., Putman M., van der Marel R. P., Tonnesen S., 2015, ApJ, 815, 77
- Sitek et al. (2016) Sitek M., et al., 2016, Acta Astron., 66, 255
- Skowron et al. (2014) Skowron D. M., et al., 2014, ApJ, 795, 108
- Stetson et al. (1990) Stetson P. B., Davis L. E., Crabtree D. R., 1990, in Jacoby G. H., ed., Astronomical Society of the Pacific Conference Series Vol. 8, CCDs in astronomy. pp 289–304
- Wagner-Kaiser & Sarajedini (2017) Wagner-Kaiser R., Sarajedini A., 2017, MNRAS, 466, 4138
- van der Marel (2001) van der Marel R. P., 2001, AJ, 122, 1827