Experimental investigation of water distribution in two-phase zone during gravity-dominated evaporation
Abstract
We characterize the water repartition within the partially saturated (two-phase) zone (PSZ) during evaporation out of mixed wettable porous media by controlling the wettability of glass beads, their sizes, and as well the surrounding relative humidity. Here, Capillary numbers are low and under these conditions, the percolating front is stabilized by gravity. Using experimental and numerical analyses, we find that the PSZ saturation decreases with the Bond number, where packing of smaller particles have higher saturation values than packing made of larger particles. Results also reveal that the extent (height) of the PSZ, as well as water saturation in the PSZ, both increase with wettability. We also numerically calculate the saturation exclusively contained in connected liquid films and results show that values are less than the expected PSZ saturation. These results strongly reflect that the two-phase zone is not solely made up of connected capillary networks, but also made of disconnected water clusters or pockets. Moreover, we also find that global saturation (PSZ + full wet zone) decreases with wettability, confirming that greater quantity of water is lost via evaporation with increasing hydrophilicity. These results show that connected liquid films are favored in more hydrophilic systems while disconnected water pockets are favored in less hydrophilic systems.
pacs:
64.70.fm, 47.56.+r, 47.55.nbEvaporation from porous media such as soil involves complex mechanisms that enable water flow across liquid-air interfaces in the pores. These liquid networks control the rigidity of porous materials Herminghaus (2005), as well as the total amount of water that plants can extract from the soil Calvet (1988); Cejas et al. (2014a). Evaporation affects energy balance and involves phase changes and fluid displacement Shaw (1987) at pore scales thereby providing different levels of challenges when predicting evaporation using theoretical models Shokri et al. (2009). The challenges are due to the different mechanisms involved at the pore scale level, such as pore impregnation and drying Prat (2007), liquid flows due to pore size distributions Shokri et al. (2009); Lehmann et al. (2008) and flows due to local gradients of temperature Huinink et al. (2002). Because of this inherent complexity, several models and experimental approaches have been established to analyze evaporation, such as pore-network models Laurindo and Prat (1998); Yiotis et al. (2010) and silica spheres sandwiched between glass slides Shaw (1987).
Experimental studies on evaporation have been commonly performed in two-dimensions (2D) for simplicity and reproducibility Prat and Bouleux (1999); Yiotis et al. (2012a). The morphology of the front and the dynamics of the liquid films during evaporation are affected by a competition between viscous, capillary, and gravity forces Shokri et al. (2008); Prat and Bouleux (1999); Yiotis et al. (2012a). Some studies have probed the effect of reduced gravity conditions on front dynamics and the fluid displacement patterns by using parabolic flight experiments Or et al. (2009) or tilting the sample cell at an angle relative to the direction of gravity Yiotis et al. (2012a). Notable studies have also focused on the drying front Shokri et al. (2008) and the fractal formation that accompanies it Yiotis et al. (2006); Prat and Bouleux (1999); Prat et al. (2012). Most evaporation experiments have been devoted to measuring and predicting the extent or depth of the capillary film network in the two-phase zone Shokri et al. (2008); Yiotis et al. (2012a), which links the fully wet region and the evaporating surface Prat and Bouleux (1999), arguing that comprehension of the capillary film network would be useful for numerous applications. For instance, recent results used evaporation principles on the prediction of total mass loss from combined evapotranspiration fluxes for root growth applications Cejas et al. (2014a). Some drying studies have also coupled experiments with numerical simulations Han and Zhou (2013).
Prediction of the extent of the liquid film region has already been largely studied using various models. However, what still remains an area of interest is the water repartition within the partially saturated (two-phase) zone (PSZ), also referred to as unsaturated zone Shokri et al. (2008) or vadose zone Hunt et al. (2008) in literature. The PSZ is a dynamic air/water mixture formed by saturated pores, liquid bridges, and films that coalesce to form networks, which establish hydraulic connections inside the porous medium Yiotis et al. (2012b). The negative curvature of the water-air menisci in these films Xu et al. (2008) mean that they are subject to intense pressure that play a crucial role in fluid transport mechanisms, including having an impact on infiltration Cejas et al. (2014b) and groundwater recharge Hunt et al. (2008). Experimental evidence has revealed that some liquid films are indeed disconnected from the principal network and thus form isolated water clusters or pockets Shokri et al. (2008); Prat and Bouleux (1999). Although these isolated clusters have been qualitatively observed in experiments Shokri et al. (2008, 2009); Prat and Bouleux (1999), our understanding of the evaporation process would benefit from the analysis of the water content repartition within the two-phase zone, i.e. the quantity of water contained in continuous liquid films and those contained in disconnected isolated pockets. Such information will not just contribute to our comprehension of evaporation dynamics but it will help improve applications in soil additive design Wei et al. (2014); Wei and Durian (2013).
In this paper, we present an experimental investigation of evaporation from a 2D porous medium that consists of a monolayer stack of monodisperse beads inside a Hele-Shaw cell. We study evaporation using well-controlled experimental conditions including different relative humidities, sizes of glass beads, and mixtures of particles with varying wettability. The primary objective is to estimate the general repartition and saturation of water within the two-phase zone (PSZ) subject to gravity. We find evidence of a complex coexistence of connected capillary networks and disconnected water clusters or pockets, where the quantity of the latter dominates during later evaporation times and in less hydrophilic media. We find that the saturation of the PSZ is a function of the Bond number, where packing of smaller particles (lower Bond number) have higher saturation values. From these scalings, we extract information on total saturation in the two-phase zone. By comparing total PSZ saturation values to the saturation exclusively contained in continuous films, we obtain the amount of water contained in isolated pockets. We find that for different wetting conditions, the increase in hydrophobicity in the porous medium is generally accompanied by an increase in the amount of water in isolated pockets.
I Materials and Methods
Cell preparation. We perform experiments in Hele-Shaw cells constructed by putting together two glass sheets (Peerless Store and Glass, PA) of cm in length and cm in width. The thickness of the cell is the diameter of the beads, . Because of the silicon needed to glue the sheets together, the effective size of the medium becomes cm in length and cm width. The glass sheets are coated with hydrophobic silane solution (OMS Chemicals, Canada) to reduce wetting effects. When oriented vertically, only the top of the cell is left unsealed. Once dry, the cells are filled with glass beads forming a monolayer. We study two different glass bead diameters: mm (soda lime, MO-SCI) and mm (borosilicate, Sigma-Aldrich). For each experiment, we measure the cross-section of the cell, . The thickness of the Hele-Shaw cell is mm and mm. As a result, our system is quasi-2D.
| Quantity | Symbol | Unit | Value |
|---|---|---|---|
| Diffusion of water in air | m2/s | ||
| Diffusion of water in porous medium | m2/s | ||
| Liquid density | kg/m3 | ||
| Surface tension | mN/m |
We use deionized water, whose properties are shown in Table(1). The porosity of the medium, , is experimentally measured for the entire cell using standard imbibition method. The average porosities for and are and respectively.
Surface treatment. We use a heterogeneous mixture, , of glass beads of two different wettabilities, characterized by contact angles: (1) more hydrophilic, , for glass beads washed with 0.01M HCl for few hours at C and neutralized by washing with deionized water and left to dry in the oven at C for hours; and (2) less hydrophilic, for glass beads washed with the same hydrophobic silane solution. We use the Cassie equation (Eq.(1)) to estimate the equivalent contact angle, , of our mixture.
| (1) |
Eq.(1) is based on the principle that a mixture of particles having two different contact angles will have a macroscopic effective contact angle that is proportional to their respective fractional components, Shokri et al. (2008). This is a reasonable assumption in the framework of the experimental conditions since the beads are essentially hydrophilic, only one type is less hydrophilic than the other. The values are presented in Table(2).
| (∘) |
Experimental conditions. We fill the cells with water by fully submerging them in a closed water tank attached to a vacuum pump, which draws air out of the medium as the surrounding water slowly percolates through the pores. The pump also reduces the presence of bubbles that could otherwise affect evaporation measurements. Once filled with water, the cell is oriented vertically such that water evaporates from the top. Evaporation experiments are performed inside a glove box with humidification systems, which permit precise control of the humidity. The relative humidity, , is regulated and set at and by servo-control device (model 5100, Electro-Tech Systems) and recorded. The temperature inside the glove box remains constant at C. We measure the mass loss of water using a digital balance (P4002 model, Denver Instruments) at specific time intervals controlled by a Matlab program.
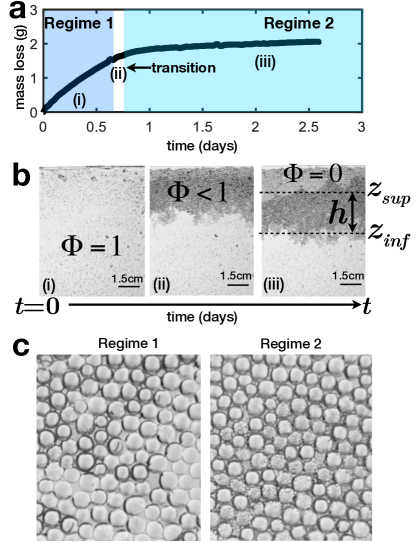
Image treatment. We obtain images of the water repartition by taking pictures every min using a Canon 500D camera with -mm lens with a spatial resolution of about m per pixel. The cells are back-illuminated allowing for the observations of the three zones, as shown in Fig.(1)a : the dry zone, the partially saturated zone (PSZ), and the fully saturated zone. Images are treated using Matlab
II Definitions and Experimental Data
Observations and Flux Definition. We perform evaporation experiments using a wide variety of physical parameters (particle size, wettability fraction, humidity) and each experiment exhibits similar features. A typical mass loss curve, , due to evaporation is shown in Fig.(1)a. The corresponding images are shown in Fig.(1)b. Let be the saturation level of the medium. The system starts out fully saturated, (Fig.(1)b). Evaporation proceeds via two regimes. During the first regime, air enters the medium and displaces water resulting to the appearance of a two-phase air-liquid mixture called the partially saturated zone (PSZ), where . The PSZ consists of an intricate hydraulic network connecting and . The first regime is controlled by mass transfer across an external mass transfer length scale, , above the cell surface, where drying rates Coussot (2000); Shokri et al. (2008); Lehmann et al. (2008); Yiotis et al. (2012a) are approximately constant and mass loss due to evaporation is linear with time Chauvet et al. (2009); van Brakel (1980). During regime 1, rate of mass loss remains high due to hydraulic connections that ensure rapid transport of water from the bulk (interior of the porous medium) to the surface. As a result, water is continuously supplied at the surface to sustain the rate of evaporation Coussot (2000), an action that is macroscopically described as a wicking effect Yiotis et al. (2012a). In literature, regime 1 is also referred to as the constant rate period (CRP) Yiotis et al. (2012a); Prat and Bouleux (1999); Lehmann and Or (2009); Chauvet et al. (2010); Shokri et al. (2008).
At a certain characteristic depth of , the liquid films can no longer sustain capillary flow and they detach from the evaporating surface. The disruption of the hydraulically connected films marks the transition, (Fig.(1)a), from the first to the second regime characterized by much lower evaporation rates Schultz (1991). At this point, a dry region, now separates the front and the evaporating surface (Fig.(1)b). Due to loss of hydraulic connections at the surface, evaporation during the regime 2 now shifts to vapor diffusion Shokri et al. (2009) across air-filled pores in the dry region and drying rates continue to slow down. In literature, regime 2 is also referred to as the falling rate period (FRP) Yiotis et al. (2012a); Prat and Bouleux (1999); Lehmann and Or (2009); Chauvet et al. (2010); Shokri et al. (2008).
The presence of the two regimes signifies that the overall evaporation flux can be separated into (flux regime 1) and (flux regime 2). Analytical expressions of both fluxes can be found extensively in literature Yiotis et al. (2012a, b); Prat and Bouleux (1999); Chauvet et al. (2009, 2010); Shokri et al. (2008); Cejas et al. (2014a), showing that the mass loss in regime 1 is linear with time while the mass loss in regime 2 scales as . Such descriptions are in accordance with our own experimental observations.
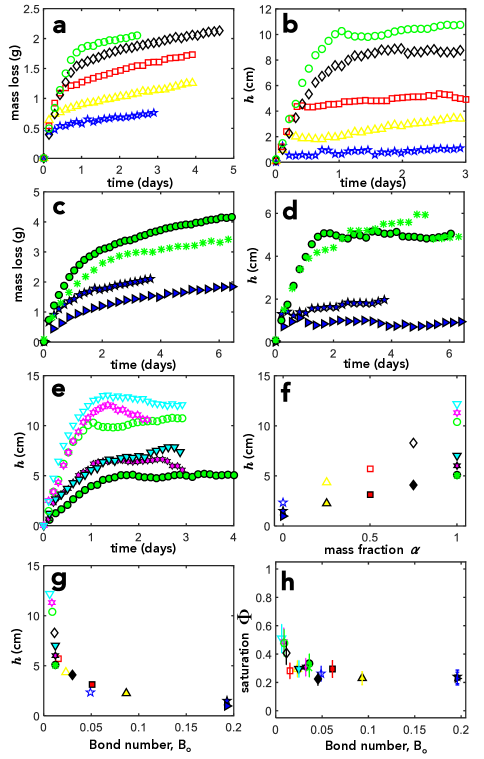
In our experiments, we control the wettability by varying the ratio, . We show in Fig.(2)a, , for particle size . Results for are shown in SI-1. From these results, greater mass of water is lost in more hydrophilic systems than in less hydrophilic systems since more hydrophilic particles maintain hydraulic continuity that favors evaporation. This is consistent with reported experimental Shokri et al. (2009) and simulation results Chraïbi et al. (2009). The minimal value observed in less hydrophilic systems is attributed to the minimal presence of hydraulic continuity between the bulk and the surface Shokri et al. (2009).
The height or extent, , of the PSZ is bound by the positions of the percolating front, , and the evaporating front, .The value is a function of wettability mixture, , whose results are presented in Fig.(2)b () and SI-1 (). From the figures, the different regimes are easy to distinguish, where increases linearly during regime 1 but remains approximately constant during regime 2.
We also control the relative humidity, , of the glove box. The curves in Fig.(2)c and Fig.(2)d show and respectively for and for using mm. The relative humidity is a measure of the amount of moisture in the air. At low , air is considered dry and thus water evaporates faster to maintain equilibrium. At higher values, there is greater moisture content in the air and thus evaporation rates proceed slower. The extent of is similar for the two different relative humidity values. This strongly suggests that is independent of relative humidity. The relative humidity only changes the overall water content (Fig.(2)c) inside the medium but not the extent, , of the liquid film region (Fig.(2)d).
In an evaporation experiment, water transport is driven and retarded by various forces. We therefore estimate the dimensionless Bond, , and Capillary numbers, , to determine which forces are dominant.
Dimensionless numbers. The capillary forces that transport water towards the evaporating surface are always opposed by viscous forces Laurindo and Prat (1998); Prat (2002); Lehmann et al. (2008); Lehmann and Or (2009); Yiotis et al. (2012a). Because in these experiments the sample cells are oriented vertically, gravity also has an opposing against upward capillary flow. When gravity is part of drying, the pressure of the liquid is hydrostatic and the displacement pattern follows features of invasion percolation Prat and Bouleux (1999); Yiotis et al. (2010); Prat et al. (2012).
The interplay between these forces controls the dynamic aspects governing evaporation. To determine the relative dominance among the forces, we compute and , which provide the ratio between viscous and capillary forces (former) and between gravity and capillary forces (latter) and are defined as:
| (2) |
where is the dynamic liquid viscosity, is the characteristic liquid filtration velocity, is the interfacial tension, is the acceleration due to gravity. The parameter in is normally defined as the filtration velocity in regime 1 and is represented as, Prat (2002). While maintaining the same , we can tune the value of by tilting the sample cell at an angle relative to the direction of gravity, henceforth referred to as a tilt angle, . This effectively reduces gravity into a component given by , where its effect on the extent of the PSZ, , is shown in Fig.(2)e. Lower values result to higher values. The experimental values for , , and are presented in Table(3).
| Exp | Bo | ||||||
|---|---|---|---|---|---|---|---|
| No. | (m) | () | ∘ | no unit | g/day | () | () |
| 1 | 250 | 20 | 90 | 0 | 2.75 | 4.90 | 4.93 |
| 2 | 250 | 20 | 90 | 0.25 | 2.56 | 2.33 | 3.37 |
| 3 | 250 | 20 | 90 | 0.50 | 2.40 | 1.53 | 1.85 |
| 4 | 250 | 20 | 90 | 0.75 | 1.85 | 1.14 | 1.06 |
| 5 | 250 | 20 | 90 | 1 | 1.86 | 0.91 | 0.85 |
| 6 | 500 | 20 | 90 | 0 | 1.35 | 19.6 | 3.33 |
| 7 | 500 | 20 | 90 | 0.25 | 1.63 | 9.33 | 1.91 |
| 8 | 500 | 20 | 90 | 0.50 | 1.54 | 6.12 | 1.19 |
| 9 | 500 | 20 | 90 | 0.75 | 1.99 | 4.55 | 1.14 |
| 10 | 500 | 20 | 90 | 1 | 1.96 | 3.62 | 0.89 |
| 11 | 500 | 40 | 90 | 0 | 0.72 | 19.6 | 3.33 |
| 12 | 500 | 40 | 90 | 1 | 1.14 | 3.62 | 0.89 |
| 13 | 250 | 20 | 75 | 1 | 2.48 | 0.87 | 1.13 |
| 14 | 250 | 20 | 45 | 1 | 3.45 | 0.64 | 1.57 |
| 15 | 500 | 20 | 75 | 1 | 3.00 | 3.50 | 1.37 |
| 16 | 500 | 20 | 45 | 1 | 3.86 | 2.56 | 1.71 |
A summary of results for all experiments is shown in Fig.(2)f as a function of , revealing that smaller particles, (hollow points), produce bigger values than larger particles, (filled points). In addition, Fig.(2)f also shows that increases with hydrophilic fraction . In Fig.(2)g, all the data collapse on a single curve as is plotted as a function of , revealing a sharp decrease. When plotted in log-log scale, the regression analysis shows a slope of (see SI-2), thereby giving a scaling law of . Furthermore, we calculate , which is the ratio of the mass of water within the PSZ with respect to the initial mass of water, , at the start of the experiment, while taking into account the geometry of the cell:
| (3) |
where is the equilibrium total mass of water in the porous medium, which can be estimated from the mass curves, , where is the vertical length of the medium from the cell surface to the bottom of the packing, and is porosity. The plot of PSZ saturation as function of is shown in Fig.(2)h. Four principal observations can be deduced from these data: (1) smaller particles hold more water content than larger particles; (2) PSZ saturation increases slightly with wettable fraction; (3) PSZ saturation is higher when gravity effects are diminished; and (4) PSZ saturation appears to be constant regardless of relative humidity.
Continuous films, isolated pockets. Experimental images of the PSZ in Fig.(1)c show varying compositions at different regimes. Fig.(1)c (left) shows a network of liquid films, which are a coalescence of pendular bridges between beads, trapped in pore spaces. Studies Yiotis et al. (2012a); Prat (2007) have shown that liquid films pinned to the corners of the pore wall (corner film flow) contain menisci with varying radii of curvature that induce a capillary pressure gradient. This serves as the driving force for upward liquid flow from the bulk to the evaporating surface, thus assuring hydraulic continuity. In Fig.(1)c (right), we observe droplets with positive curvature, which suggests they have been detached from the main film network. Most of the droplets start appearing later (during regime 2). Apart from droplets, disconnected films also appear because as water content in the liquid films continues to decrease due to evaporation, they eventually detach from the main liquid network.
To understand water repartition in the PSZ, we must first quantify the saturation of water contained in continuous liquid films, which contribute to extent of .
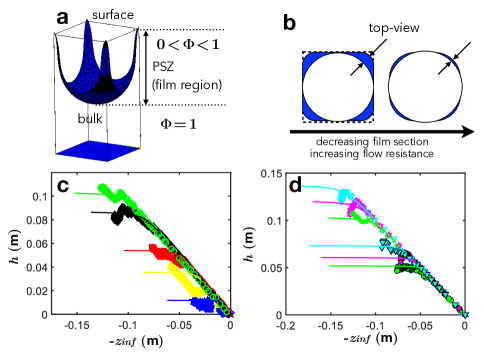
Corner film flow.Yiotis Yiotis et al. (2012a) developed a model that predicts and the saturation of liquid films in the PSZ during evaporation out of a porous medium by calculating the cross-section of the corner liquid films. These corner films, when viewed from the top, resemble flow in a non-circular capillary tube Dong and Chatzis (1995); Chauvet et al. (2009) shown in Fig.(3)a. Studies Camassel et al. (2005); Chauvet et al. (2009, 2010); Prat (2002) have demonstrated that evaporation of liquid from a square tube results to the formation of corner liquid films (Fig.(3)b), whose large cross-sectional area reduces flow resistance from the interior of the porous medium (bulk) to the evaporating surface. The corner films represent a more effective transport mechanism than simple vapor diffusion Camassel et al. (2005), which is the dominant mechanism in the evaporation of liquid from a circular tube. Transport via corner film flow holds true for any tube of polygonal cross-section with sharp corners Prat (2007); Yiotis et al. (2012a).
As liquid films begin to thin out towards the end of regime 1, the geometry of the films then adopt a more rounded shape during regime 2 Yiotis et al. (2012b) (Fig.(3)b), thereby decreasing cross-sectional area and increasing flow resistance from the bulk to the evaporating surface. The flow resistance along the corner film is also a function of contact angle Ransohoff and Radke (1988), where higher contact angles reduce the cross-sectional area of the film available for flow.
III Results and Discussion
Prediction of PSZ height. To quantify the water saturation contained in liquid films, we first must calculate for using the analytical model of Yiotis Yiotis et al. (2012a, b) with data from Dong and Chatzis Dong and Chatzis (1995). The model is straightforward, widely covered in literature, and detailed discussion on its use is not the primary objective of this paper. We then compare their model with our experiments shown in Fig.(3)c for ( in SI-1) and Fig.(3)d for different . Comparison reveals excellent agreement. Apart from predicting , their model also permits calculation of the saturation of water contained in liquid films in the PSZ but had been only developed for completely hydrophilic materials. Due to our mixed wettable system, we pursue a different avenue, through numerical simulations, to find out the quantity of water contained in connected liquid films and from that information, we deduce the quantity of water disconnected from the main network (droplets, pockets, etc).
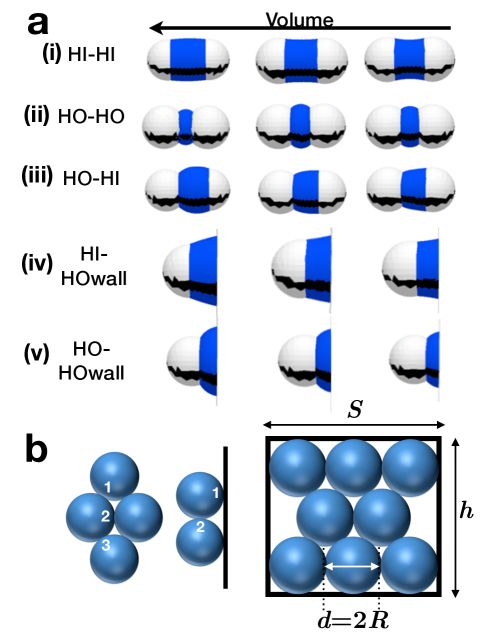
Simulations. We define the total water saturation within the PSZ in Eq.(3). We also define the saturation contained in continuous liquid films and saturation isolated from the main network, both with respect to initial mass, by performing numerical simulations using Surface Evolver Brakke (2010). We consider to be primarily determined by a series of interconnected pendular bridges between particles in contact with each other or with the wall. In a 2D granular system of mixed wettability, we can have different kinds of pendular bridges in Fig.(4)a: bridge between beads of the same and of the same surface wetting properties, (i) HI-HI and (ii) HO-HO, where HI stands for more hydrophilic particles while HO stands for less hydrophilic particles; (iii) bridge between beads of the same but of different wetting properties, HI-HO; (iv) bridge between a more hydrophilic bead and the less hydrophilic wall, HI-HOwall; (v) and finally a bridge between a less hydrophilic bead and the less hydrophilic wall, HO-HOwall. The shape of the meniscus depends on the wetting properties of the solids (sphere/plane) and also on the volume of the liquid body.
It is understandably difficult to assess the liquid bridges during regime 1, due to the rapid nature of its flux. Thus, in these simulations, we consider that the bridge is in equilibrium during the slower evaporation dynamics in regime 2 - a fact supported by results in Fig.(2) showing the quasi-constant value of . Earlier, we estimate the (see Table(3)). At equilibrium, the capillary force is the dominant force acting on the bridge since the liquid volumes are very small.
The menisci of pendular bridges have negative curvatures, whose pressure is hydrostatic along the extent of . The pressure value, , is determined using Surface Evolver Berthier and Brakke (2012); Brakke (2010) by calculating change in energy with respect to volume, . The results from the numerical simulations establish a pressure-volume relationship, which can be used to evaluate the saturation of water contained in liquid bridges within the PSZ. Since a liquid film is, in essence, a coalescence of capillary bridges, it is then important to estimate the number of bridges that comprises this network in the PSZ as a function of wettability.
In the case of random-close packing, where the distribution is close to dense packing, each spherical bead has a maximum of six neighbors. Thus, the minimum number of contact sites between two beads is while there are contact sites between a bead and the wall as shown in Fig.(4)f, where is the number of spheres. For a certain and , the parameter can be estimated using principles associated with Kepler conjecture, which describes the maximum packing of spheres (or objects) achieved for a given space Hales (2005). We then evaluate the saturation contained in continuous liquid films, , along the extent of , using the equation:
| (4) |
where the various parameters refer to:
| (5) |
where , , , , and correspond to the volumes of the liquid trapped between two solid bodies. The subscripts refer to the surface coupling between two different wetting properties: “I” for more hydrophilic and “O” for less hydrophilic. The values are those predicted by the model of Yiotis Yiotis et al. (2012a, b), which we have shown to agree with experiments.
The total saturation of the liquid films in the PSZ can be obtained from simulation expressed in terms of defined as:
| (6) |
where is the volume of the continuous liquid films calculated from Eq.(6), is the free pore volume of the entire medium defined as . Eq.(6) shows the saturation of connected liquid films within the PSZ, taking note that the fully wet-zone has no liquid-air interfaces. We show in Fig.(5)a the plot of (Eq. (3)) as function of . The black line is a guide for the eye.
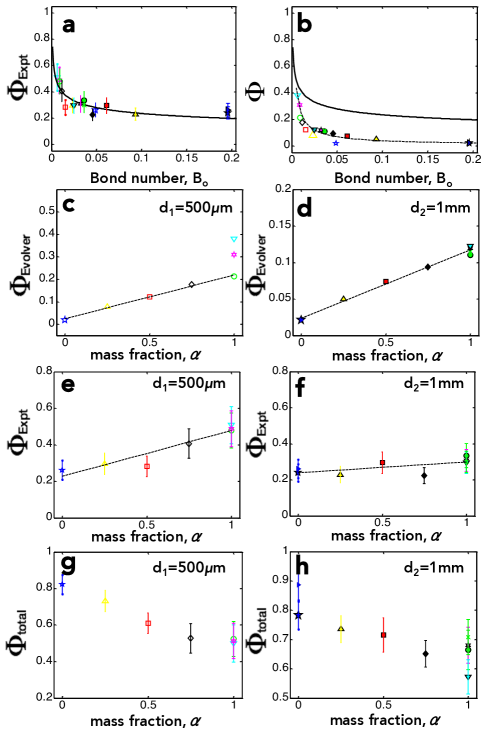
We also calculate the saturation contained in liquid films using the model of Yiotis, Yiotis et al. (2012a, b) (graph in SI-3), which was conceptualized for completely hydrophilic media and from a single tube. Thus, the value obtained from this model was then scaled with respect to 2D porous medium, which can be seen as a bundle of equivalent capillary tubes Lehmann et al. (2008). We then compare in the main figure in Fig.(5)b the results of the analytical model (now shown as a broken line) with results from the simulations (points), as function of . The broken line in this figure is the best fit from the results of the analytical model Yiotis et al. (2012a, b) and serves as a guide (see SI-3). From these results, the fact that there is an offset in saturation contained in liquid films with respect to the experimentally measured PSZ saturation (solid line) strongly reflects the fact that the PSZ is not solely made up of connected hydraulic networks but also contains water in the form of droplets and disconnected pockets, which have actually also been observed using tomography Shokri et al. (2008, 2009).
Results in Fig.(5)c and Fig.(5)d first show that increases with , suggesting that more hydrophilic materials favor liquid films. Secondly, comparison of Fig.(5)e and Fig.5(f) show that packing of smaller particles hold more saturation than packing of larger ones due to the higher capillary pressures emanating from smaller liquid volumes. Both figures also show the PSZ saturation seems to slightly increase with , notably for smaller diameters, similar to the variation of with in Fig. 2(f). This shows that increasing hydrophilicity favors saturation in continuous films while increasing hydrophobicity favors disconnected pockets. Thirdly, PSZ saturation is generally higher at greater because the extent also increases with reduced gravity effects. Lastly, PSZ saturation seems to be independent of relative humidity. This may appear misleading; however, if we take into account the fully wet zone (FSZ), which is larger at higher , the overall water content remaining in the entire medium would still be greater at higher , in accordance with observations in Fig.(2)a. In Fig.(5)g and Fig.5(h), we show (PSZ + FSZ) as function of wettability. Greater quantity of water is globally retained in less hydrophilic media in contrast to more hydrophilic ones.
IV Conclusion
We have systematically investigated experiments on the evaporation of water from model soil systems using parameters such as surface treatment, particle size, and environmental humidity. We demonstrate through experiments and simulations that the partially saturated zone is not only a connected liquid film region but also a region containing droplets and clusters that have been disconnected from the main hydraulic network. We calculate the average global saturation in the partially saturated zone and find that the saturation of water in the continuous liquid films increases with overall hydrophilicity since they favor formation of capillary networks. In contrast, less hydrophilic systems do not favor liquid film continuity and thus greater quantity of disconnected clusters exist. The more disconnected clusters present in the porous medium, the less we lose water in the medium since evaporation now mainly proceeds via diffusion instead of capillary transport through the network.
These 2D results could have direct applications in soil additive design to control water repartition in soil during evaporation. Soil is essentially a mixture of hydrophilic and hydrophobic components. One way to achieve an optimal retention of water is to develop additives with dual wettable properties. The presence of hydrophobic (or less hydrophilic) components breaks liquid film continuity and will result to more disconnected clusters, which evaporate at slower rates. These experiments have been performed in 2D model systems. It would be a good contribution to the subject in the future to analyze the connectivity of films and appearance of liquid clusters in three dimensional systems, since such systems most closely resemble real soil structures.
Acknowledgements.
We thank the support of Solvay, CNRS, and UPenn. We thank everyone in COMPASS (UMI 3254) laboratory, as well as Zhiyun Chen, Jennifer Reiser, and Prof. Douglas J. Durian (UPenn) for helpful exchanges. We are also very grateful to K. Brakke for helping us with Surface Evolver.References
- Herminghaus (2005) S. Herminghaus, Advances in Physics 54, 3 (2005).
- Calvet (1988) R. Calvet, Etudes sur les transferts d’eau dans le système sol-plante-atmosphère (INRA France, 1988).
- Cejas et al. (2014a) C. Cejas, L. Hough, J. Castaing, C. Fretigny, and R. Dreyfus, Physical Review E 90, 042716 (2014a).
- Shaw (1987) T. Shaw, Physical Review Letters 59, 1671 (1987).
- Shokri et al. (2009) N. Shokri, P. Lehmann, and D. Or, Water Resour. Res. 45, 12 (2009).
- Prat (2007) M. Prat, Physical Review E 40, 1455 (2007).
- Lehmann et al. (2008) P. Lehmann, D. Assouline, and D. Or, Physical Review E 77, 056309 (2008).
- Huinink et al. (2002) H. Huinink, L. Pel, M. Michels, and M. Prat, The European Physical Journal E: Soft Matter and Biological Physics 9, 487 (2002).
- Laurindo and Prat (1998) J. Laurindo and M. Prat, Chemical Engineering Science 53, 2257 (1998).
- Yiotis et al. (2010) A. Yiotis, I. Tsimpanogiannis, and A. Stubos, Drying Technology 28, 981 (2010).
- Prat and Bouleux (1999) M. Prat and F. Bouleux, Physical Review Letters 60, 5647 (1999).
- Yiotis et al. (2012a) A. Yiotis, D. Salin, E. Tajer, and Y. Yortsos, Physical Review E 86, 026310 (2012a).
- Shokri et al. (2008) N. Shokri, P. Lehmann, P. Vontobel, and D. Or, Adv. Water Res. 44 (2008).
- Or et al. (2009) D. Or, M. Tuller, and S. Jones, SSAJ 73, 341 (2009).
- Yiotis et al. (2006) A. Yiotis, I. Tsimpanogiannis, A. Stubos, and Y. Yortsos, Journal of Colloid and Interface Science 297, 738 (2006).
- Prat et al. (2012) M. Prat, S. Veran-Tissoires, N. Vorhauer, T. Metzger, and E. Tsotsas, Drying Technology 30 (2012).
- Han and Zhou (2013) J. Han and Z. Zhou, ScientificWorldJournal (2013).
- Hunt et al. (2008) R. Hunt, D. Prudic, J. Walker, and M. Anderson, Ground Water 46, 551 (2008).
- Yiotis et al. (2012b) A. Yiotis, D. Salin, E. Tajer, and Y. Yortsos, Physical Review E 85, 046308 (2012b).
- Xu et al. (2008) L. Xu, S. Davies, A. Schofield, and D. Weitz, Physical Review Letters 101, 094502 (2008).
- Cejas et al. (2014b) C. Cejas, Y. Wei, R. Barrois, C. Fretigny, D. Durian, and R. Dreyfus, Physical Review E 90, 042205 (2014b).
- Wei et al. (2014) Y. Wei, C. Cejas, R. Barrois, R. Dreyfus, and D. Durian, Physical Review Applied 2, 044004 (2014).
- Wei and Durian (2013) Y. Wei and D. Durian, Physical Review E 87, 053013 (2013).
- Coussot (2000) P. Coussot, European Physical Journal B 15, 557 (2000).
- Chauvet et al. (2009) F. Chauvet, P. Duru, S. Geoffrey, and M. Prat, Physical Review Letters 103, 124502 (2009).
- van Brakel (1980) J. van Brakel, Advances in Drying (Hemisphere, New York, 1980).
- Lehmann and Or (2009) P. Lehmann and D. Or, Physical Review E p. 046318 (2009).
- Chauvet et al. (2010) F. Chauvet, S. Cazin, P. Duru, and M. Prat, Intl. Journ. Heat Mass Transfer 53, 1808 (2010).
- Schultz (1991) P. Schultz, Chem. Eng. Tech. 14, 234 (1991).
- Chraïbi et al. (2009) H. Chraïbi, M. Prat, and O. Chapuis, Physical Review E 79, 026313 (2009).
- Prat (2002) M. Prat, Chem. Eng. J. 86, 153 (2002).
- Dong and Chatzis (1995) M. Dong and I. Chatzis, Journal of Colloid and Interface Science 172, 278 (1995).
- Camassel et al. (2005) B. Camassel, N. Sghaier, M. Prat, and S. Ben Nasrallah, Chemical Engineering Science 60, 815 (2005).
- Ransohoff and Radke (1988) T. Ransohoff and C. Radke, Journal of Colloid and Interface Science 121, 392 (1988).
- Berthier and Brakke (2012) J. Berthier and K. Brakke, The Physics of Microdroplets (Elsevier, US, 2012).
- Brakke (2010) K. Brakke, Surface Evolver Manual Version 2.50, Susquehanna University, PA, USA (2010).
- Hales (2005) T. Hales, Annals of Mathematics, Second Series 162, 1065 (2005).