The Effects of Protostellar Disk Turbulence on CO Emission Lines: A Comparison Study of Disks with Constant CO Abundance vs. Chemically Evolving Disks
Abstract
Turbulence is the leading candidate for angular momentum transport in protoplanetary disks and therefore influences disk lifetimes and planet formation timescales. However, the turbulent properties of protoplanetary disks are poorly constrained observationally. Recent studies have found turbulent speeds smaller than what fully-developed MRI would produce (Flaherty et al. 2015, 2017). However, existing studies assumed a constant CO/H2 ratio of in locations where CO is not frozen-out or photo-dissociated. Our previous studies of evolving disk chemistry indicate that CO is depleted by incorporation into complex organic molecules well inside the freeze-out radius of CO. We consider the effects of this chemical depletion on measurements of turbulence. Simon et al. (2015) suggested that the ratio of the peak line flux to the flux at line center of the CO J=3-2 transition is a reasonable diagnostic of turbulence, so we focus on that metric, while adding some analysis of the more complex effects on spatial distribution. We simulate the emission lines of CO based on chemical evolution models presented in Yu et al. (2016), and find that the peak-to-trough ratio changes as a function of time as CO is destroyed. Specifically, a CO-depleted disk with high turbulent velocity mimics the peak-to-trough ratios of a non-CO-depleted disk with lower turbulent velocity. We suggest that disk observers and modelers take into account the possibility of CO depletion when using line peak-to-trough ratios to constrain the degree of turbulence in disks. Assuming that CO/H at all disk radii can lead to underestimates of turbulent speeds in the disk by at least .
1 Introduction
An angular momentum transfer mechanism is essential for the evolution of disks, the growth of stars, and the formation of planets. Throughout much of a T-Tauri disk, the combination of ionizing radiation and Keplerian shear should trigger the magnetorotational instability (MRI; Balbus & Hawley, 1991, 1998; Hawley, 2001; Fromang & Nelson, 2006; Salmeron & Wardle, 2008), which drives accretion rates of order yr-1 (Bai, 2011; Landry et al., 2013; Simon et al., 2013). An alternative to MRI turbulence comes from recent simulations showing that magnetic winds may drive angular momentum transfer in protoplanetary disks (Bai & Stone, 2013; Bai, 2013; Lesur et al., 2014; Gressel et al., 2015; Bai et al., 2016). In the magnetocentrifugal wind model of Gressel et al. (2015), the disk remains laminar between 1 and 5 AU, with no significant turbulence. Since the gas velocity field controls both the sticking efficiency of colliding dust grains (e.g. Dominik & Tielens, 1997; Blum & Wurm, 2008; Birnstiel et al., 2010; Zsom et al., 2011) and the mass loss due to erosion or fragmentation in pebble collisions (e.g. Brauer et al., 2008; Birnstiel et al., 2009; Güttler et al., 2010; Kothe et al., 2010; Beitz et al., 2011), empirical measurements of turbulent speeds in disks would be extremely useful in developing theories of solid accretion, as well as understanding disk evolution.
Unfortunately, turbulent velocity profiles in disks are not always well constrained. Flaherty et al. (2015) observed CO emission lines in the HD 163296 disk with ALMA. The observations were interpreted as limiting turbulent speeds to levels far below what fully-developed MRI would produce, and not strong enough to explain the star’s high accretion rate of yr-1 (Mendigutía et al., 2013). Yet most turbulent speed measurements are model-dependent, and the HD 163296 disk may have complex CO chemistry that was not included in the Flaherty et al. (2015) model. In a direct (non model-based) analysis of new ALMA CO, CN, and CS observations of TW Hydrae, Teague et al. (2016) argue that almost all literature measurements of turbulent speeds—whether direct or model-based—should be interpreted as upper limits due to ALMA’s 7% flux calibration accuracy. According to Teague et al. (2016), firm detections of turbulent motion require a ratio of turbulent speed to sound speed of . Here we introduce another cautionary note by demonstrating how complexities in the spatial distribution of CO abundance can affect line shapes and complicate turbulent speed measurements.
Rotational emission lines from disks naturally form double-peaked profiles with a “trough” at the systemic velocity. Based on models of MRI-active disks, Simon et al. (2015) found the ratio of the peak line flux to the flux at the line center (peak-to-trough ratio) to be a reasonable diagnostic of the MRI turbulence. However, Simon et al. (2015) and Flaherty et al. (2015)—who modeled the entire ALMA data cube—assumed a constant CO/H2 ratio of in locations where CO is not frozen-out or photo-dissociated. Our chemical evolution models (Yu et al. (2016), hereafter Paper 1) indicate that the CO abundance is a complex function of both radius and time, and CO abundance gradients may affect the peak-to-trough ratio of CO emission lines. This paper examines the effects of CO depletion on peak-to-trough ratios and turbulent speed measurements. We summarize the results of the thermal-chemical models in section 2, and describe the molecular line radiative transfer models in section 3. We discuss the implications of CO chemical depletion for line profiles and turbulent speed measurements in section 4. Finally, we examine the changes in peak-to-trough ratio as the disk evolves in section 5.
2 Thermal-chemical models
We adopt the thermo-chemical model from Paper 1 and Yu et al. (2017) (hereafter Paper 2) as the basis for this study. Paper 1 presented the chemical evolution of a disk around a Solar-type star for Myr, and Paper 2 introduced the model of a disk, following the same modeling procedures as used for the disk model. We summarize the key results of the two models in this section and refer readers to our previous papers for details.
Landry et al. (2013) presented the mass distributions and temperatures, considering only accretion heating, for both model disks, and we further calculated the stellar contribution to the disk heating with the dust radiative transfer code RADMC 111http://www.ita.uni-heidelberg.de/ dullemond/software/radmc-3d/; developed by C. Dullemond in Paper 1 and Paper 2. We then ran the chemical reaction network locally at each independent (r, z) grid point for Myr, following the viscous evolution of the disk and the evolution of the central star along the Hayashi track. No mixing is included in the model; we assume the chemical reaction timescale to be much shorter than the viscous timescale, which is true for freezeout, desorption, and grain-surface reactions, but which may fail for gas-phase reactions. Each disk gridpoint starts with gas and ice abundances resulting from a 1 Myr simulation of the chemical evolution of a parent molecular cloud; as a result, a substantial fraction of the carbon is tied up in CO2 and other ices at the start of disk evolution.
The chemical evolution models include C, H, O, N based on the UMIST database RATE06 (Woodall et al., 2007). Woods & Willacy (2009) extended the network to include C isotopes, and we included both C and O isotopes in Paper I. The chemical models follow the chemistry of species, gas-phase and ices for from the beginning of the T-Tauri phase. The reaction network contains gas-phase reactions, grain-surface reactions, freezeout, thermal desorption, and reactions triggered by UV, X-rays, and cosmic rays, such as isotope-selective photodissociation.
 |
 |
 |
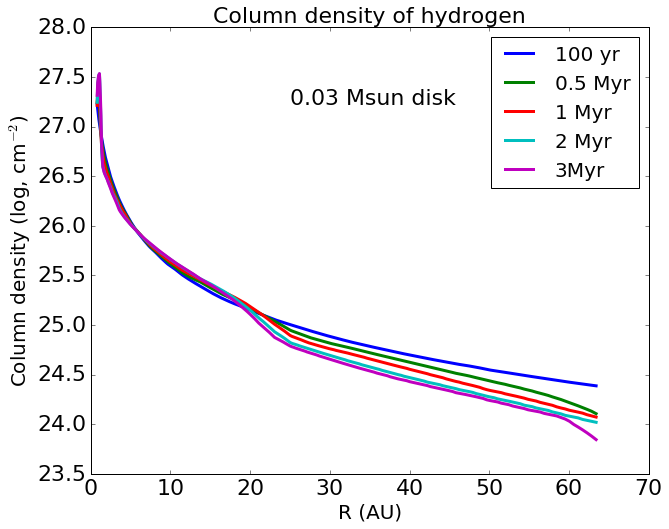 |
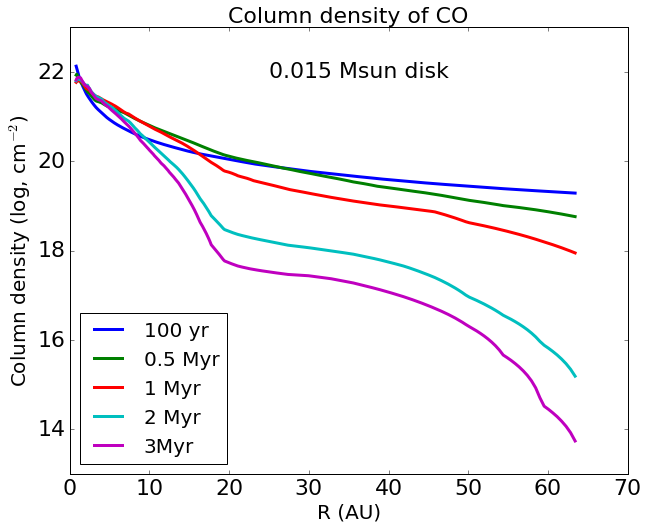
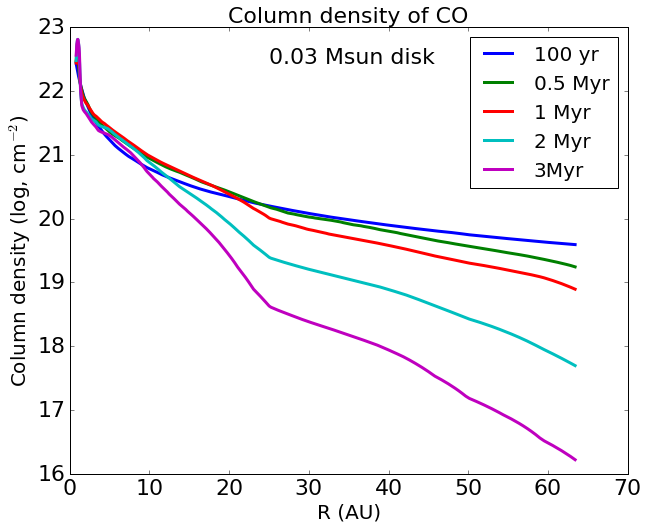
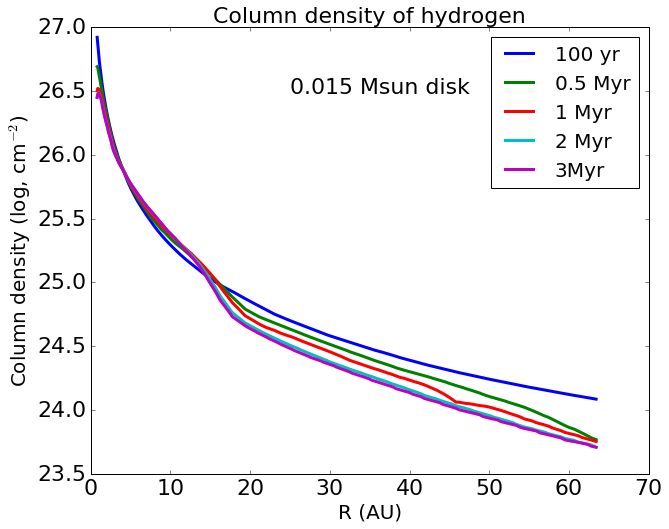
The luminosity of the central star ranges from to about over the Myr evolution. Due to efficient heating from the central star, CO does not freeze in our modeled region—the inner 70 AU of the disk—at any time in the Myr of evolution. However, CO is depleted beyond AU from the central star due to the formation of complex organic molecules, a process that we call chemical depletion. The CO chemical depletion is driven by ionization of helium from X-rays and cosmic rays and happens over a million-year time scale. As a result, the CO abundance changes both with location in the disk and with time. We show the column density as a function of disk radius for CO and H2 at different stages of the disk evolution for both the and the disks in Fig. 1. The column density of CO drops significantly beyond AU in both disks after roughly a million years of disk evolution, while the radial profile of the H2 column density changes very little over time. The small change in H2 column density is caused mostly by the pileup of material in the MRI dead zone (see paper 1 for details), while the change in CO column density is caused by the gradual chemical depletion of CO, with the liberated carbon atom forming complex species which then freeze, sequestering carbon in organic ices. The thermal-chemical model results are qualitatively similar for the disks of two masses (Papers 1 and 2). The chemical depletion timescale is slightly longer for the disk because the higher column density decreases the ionization fraction—and thus the abundance of ionized helium—in the midplane. To complicate matters, while the outer disk is losing its CO, the abundance of CO simultaneously increases with time at small radii, as CO2 ice is converted to CO gas. Figure 1 suggests that CO chemical depletion may affect molecular line emission by decreasing the emitting area as the disk evolves. As the CO abundance drops in the outer disk, the disk location where the optical depth drops below unity moves inward.
The net result of our chemical models is that CO becomes severely depleted well inside the CO freeze-out radius in disks with masses above the minimum needed to form planetary systems. Similar effects have been seen in other chemical evolution calculations (Aikawa et al. 1999; Furuya & Aikawa 2014; Walsh et al. 2014; Bergin et al. 2014). A discussion of the similarities and differences between our models and other work can be found in paper 2.
3 Line radiative transfer models
After modeling disk thermal and chemical structures as functions of time, we build molecular line radiative transfer models to simulate observational properties of the disk. We use the publicly available code LIME (Brinch & Hogerheijde, 2010, LIne Modeling Engine), and adopt the energy levels and collision rates from the Leiden Atomic and Molecular Database (LAMDA)222http://home.strw.leidenuniv.nl/ moldata/. As a first order approximation, we do not consider the hyperfine splitting in C17O emission.
We model emission from within of the central star, which corresponds to a beam diameter for an assumed distance of from the Sun. We consider line broadening due to Keplerian rotation, thermal velocity and micro-turbulence. Thermal velocities are calculated assuming a Maxwell-Boltzmann speed distribution based on the disk’s temperature structure from Paper 1. We assume an isotropic Maxwell-Boltzmann speed distribution with RMS of everywhere in the disk for the micro-turbulence in the fiducial models, and discuss effects of varying both the RMS turbulent speed and its radial and vertical profile in later sections. To compute the level populations, we set a minimum scale of to guarantee sub-pixel sampling of both Keplerian speeds and CO abundance gradients. We first generate the synthetic datacube of intensity as a function of , , and velocity for a disk around a star at inclination. In velocity space, the spectra have channels of resolution. At any specific velocity, the synthetic image contains pixels of in size. Finally, we generate the synthetic spectra presented here by integrating each velocity component over a square with sides ( pixels), larger than the angular size of the disk. The pixels not covered by the disk contribute no flux and are included simply for ease of integration—here we assume that the sky background contains negligible flux compared with the disk at all wavelengths.
Our current models assume that the gas temperature is the same as the dust temperature. As we demonstrated in the Appendix of Paper 2, this is a valid assumption for and . However, the difference between the gas and dust temperature would need to be considered in order to use our models to fit high-J spectral lines, which are dominated by emission from the disk surface. For the rest of the paper, we focus our line profile discussion on the and transitions, which are the most commonly observed. We assume LTE for energy level populations, an assumption that we have justified in the Appendix of Paper 2.
4 Effects of CO depletion and turbulent velocities on CO line profiles
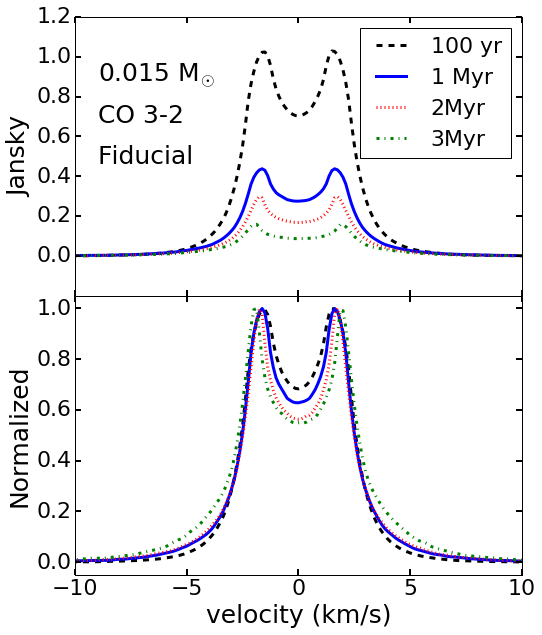
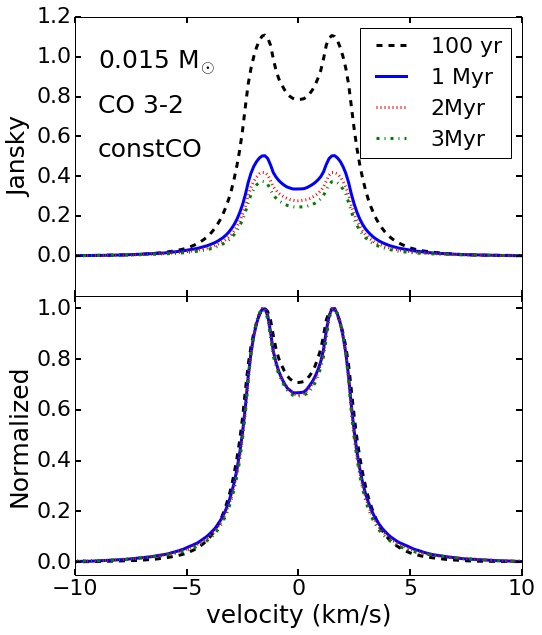
We show the time evolution of the CO line from our fiducial disk of mass 0.15 M⊙ on the left side of Figure 2. Simulated emission lines from LIME are plotted in the upper panel of each plot, and the profiles normalized to the peak intensities are shown in the lower panels. The total intensities decline with time dramatically, the wings become broader in the normalized line profile, and the relative contribution from the line center decreases over time. The line’s broadening over time occurs because CO depletion happens primarily in the outer part of the disk where Keplerian velocities are small, so the fraction of radiation from the high-velocity line wings increases with time. Moreover, new CO forms from CH3 and CO2 at small radii, further increasing the contribution of the line wings. The bottom-left panel of Figure 2 shows that the peak-to-trough ratio of CO must increase as the fiducial disk evolves.
4.1 Effects of the chemical depletion of CO
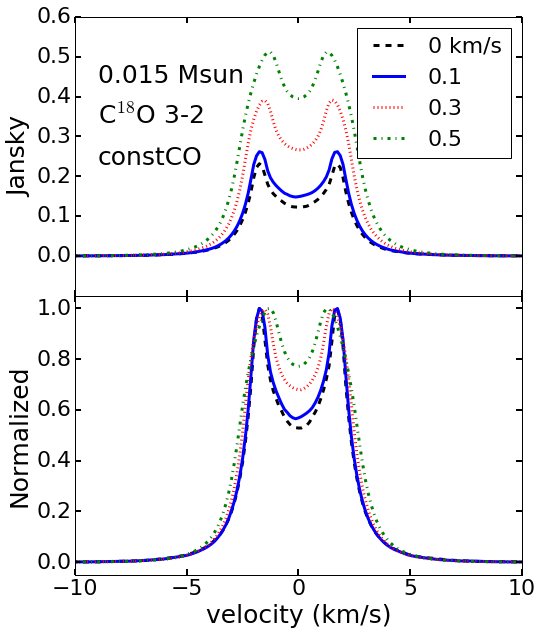
To isolate the effect of chemical depletion of CO on emission line profiles from effects caused by the evolution of disk density and temperature, we introduce models with constant CO abundance throughout the disk—assuming all available carbon is in the form of CO gas. The abundance of CO normalized to the total proton number density is . All the other properties of the constant CO models are the same as in the fiducial model. The time evolution of the CO line for the constant CO model are shown on the right of Figure 2 for comparison. The models with constant CO predict a much smaller decrease in integrated line intensity with time than do the fiducial models. As most easily seen in the normalized profiles (lower panels), the peak-to-trough ratio changes much more in the fiducial models, which account for chemical depletion, than in the constant CO models.
Paper 2 describes how CO chemical depletion biases disk-mass measurements, leading to severe underestimates when the interstellar CO/H2 ratio of is assumed. In §6 of Paper 2, we discuss three strategies for diagnosing CO depletion: (1) measuring the C18O/13CO integrated intensity ratio, which drops sharply as the disk evolves; (2) comparing line profiles of 13CO and either C18O or C17O, as the decrease in emitting area as a function of time preferentially broadens profiles of optically thin lines; or (3) comparing spatially resolved maps from an abundant vs. a rare isotopologue (e.g. CO and C18O), as the emission from the rare molecule will be truncated at the CO depletion front at AU. Although CO depletion greatly decreases total line flux, the flux is also a complex function of disk mass and temperature, which is why we do not consider flux from a single emission line an adequate diagnostic of chemical depletion. Given that CO chemical depletion affects peak-to-trough ratios, we recommend using the procedures described in paper 2 to diagnose the degree of CO depletion when interpreting either peak-to-trough ratios or full line profiles. In §5 we further explore how peak-to-trough ratios change as the outer disk loses its CO.
 |
 |
4.2 Effects of varying RMS turbulent speed and radial/vertical speed profile
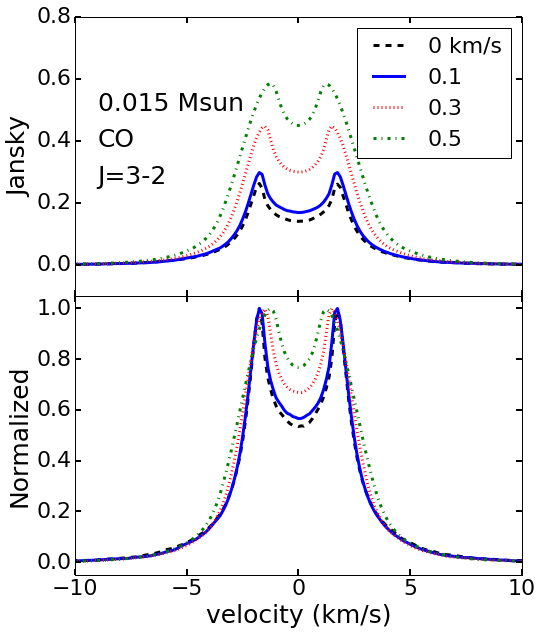
Next, we want to isolate the effect of turbulent velocities on line profiles. All models shown in Figure 2 include a microturbulent velocity field with RMS of . To distinguish the effects of CO depletion from the effects of RMS turbulent speed on CO line profiles and therefore the peak-to-trough ratios, we simulate CO and C18O emission for a Myr fiducial disk with a range of RMS micro-turbulent velocities.
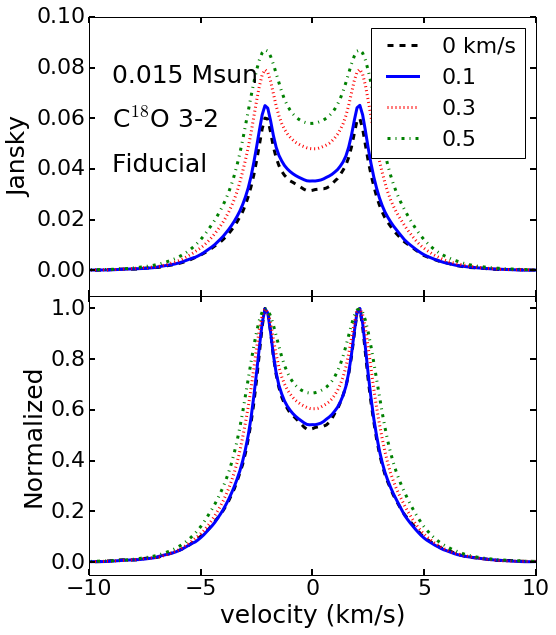
We show the CO line profiles from both the and the fiducial disk models at the 2 Myr time snapshot, with varying micro-turbulent velocities, in Fig 3. In both disks, the increase of micro-turbulent velocity leads to increased contributions from the line center, resulting in smaller peak-to-trough ratios. Similar effects were found by Simon et al. (2015)—for a single time snapshot of the disk model, the peak-to-trough ratio decreases with increasing microturbulent velocity. Integrated intensity increases with RMS turbulent speed due to the opacity decrease from spreading the absorbers in velocity space.
While CO depletion strongly increases the peak-to-trough ratio but has only a small effect on the velocity spacing between the line profile peaks (see Figure 2), decreasing the RMS turbulent speed simultaneously increases the peak-to-trough ratio and widens the between the line profile peaks (Figure 3). Since both CO depletion and strong turbulence broaden the emission line, the combination of a high peak-to-trough ratio (which, for interstellar CO/H, would indicate weak turbulence) and a broad normalized line profile probably indicates some degree of CO depletion. Analyzing the entire line profile rather than the peak-to-trough ratio, as did Hughes et al. (2011) and Guilloteau et al. (2012), would improve estimates of turbulent speed.
 |
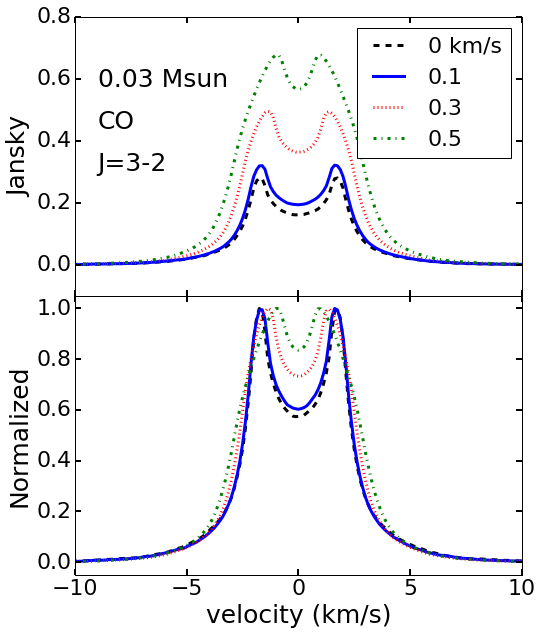 |
Figure 4 shows C18O line profiles for the disk at 2 Myr, with the fiducial, chemically evolving model on the left and the constant-CO model on the right. With C18O a high velocity spread between the line profile peaks indicates chemical depletion: we find a peak-to-peak velocity spread of in the fiducial model with vs. for the constant-CO model with . Like CO, C18O shows the same decrease in peak-to-trough ratio with increasing . However, unlike CO, changes in do not affect the velocity spacing between the line peaks for the fiducial model (though they affect the peak spacing for the constant-CO model). Furthermore, the peak-to-trough ratios from the fiducial and constant-CO models are not very different when the turbulence is weak (for example, with , the fiducial model has P/T = 1.84 while the constant-CO model has P/T = 1.76). Given that most observational studies suggest weak turbulence in T-Tauri and Herbig Ae/Be disks (e.g. Hughes et al., 2011; Guilloteau et al., 2012; Flaherty et al., 2015; Teague et al., 2016; Flaherty et al., 2017), C18O may be a more robust turbulence indicator than CO if the degree of chemical depletion is not known. As in Paper 2, we recommend comparing C18O line profiles with those of CO or 13CO to diagnose chemical depletion.
 |
 |
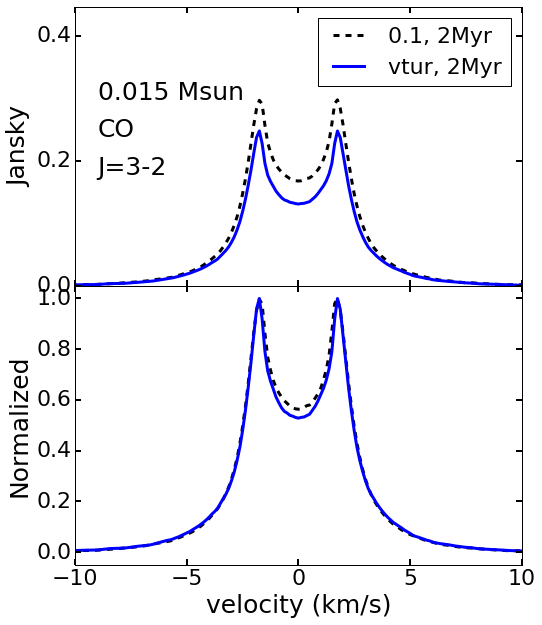
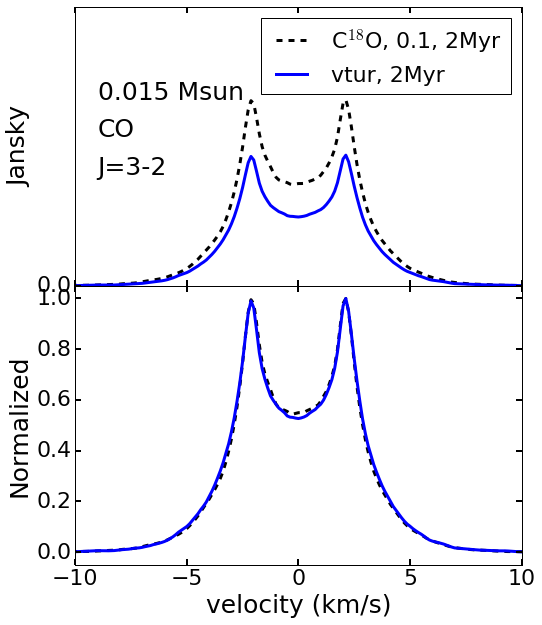
Besides the magnitude of the RMS turbulent speed, the radial and vertical dependence of the turbulence speed can also affect the line profile and the peak-to-trough ratio. Landry et al. provide the spatial distribution in of the RMS turbulent speed in each grid cell as a function of time in the form of , where the 1D turbulent velocity is , with as the local sound speed. We include the turbulent velocity profile for the disk at Myr to see the effect of incorporating non-uniform turbulent velocities in Figure 5. The Landry et al. (2013) model predicts a nearly quiescent midplane dead zone from 2-20 AU, with low turbulent speeds near the disk surface that generate an accretion rate onto the star of yr-1, topped by a dead atmosphere with due to ambipolar diffusion (see their Figure 1). The non-turbulent atmosphere provides a slightly higher peak-to-trough ratio in CO than seen in the model with RMS turbulent speed throughout the disk, though extremely high S/N observations would be required to tell the difference between the two models.
Although C18O peak-to-trough ratios are less sensitive to chemical depletion than CO peak-to-trough ratios, C18O does not perform well as a diagnostic of non-uniform turbulent speed for our model disk. Figure 5 shows that the normalized line profiles from the Landry et al. model and the disk with radially and vertically constant turbulence are indistinguishable. This is because most of the C18O emission emerges from the slightly active layer where the turbulent speeds are . Given that most of the CO gas (including all isotopologues) is concentrated in the dead zone, emission from near the disk midplane should produce line profiles similar to those from the completely laminar, turbulent-speed models shown in Figure 3. We find, therefore, that C18O emission does not trace the midplane dead zone. The close match between line profiles from the Landry et al. disk and the disk with constant RMS turbulent speed comes from the fact that gas at both disks’ surfaces has a similar speed distribution.
 |
 |
5 Time evolution of the peak-to-trough ratio
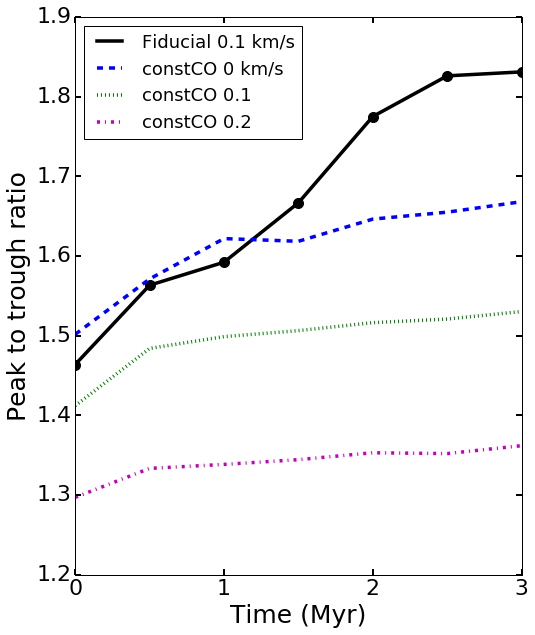
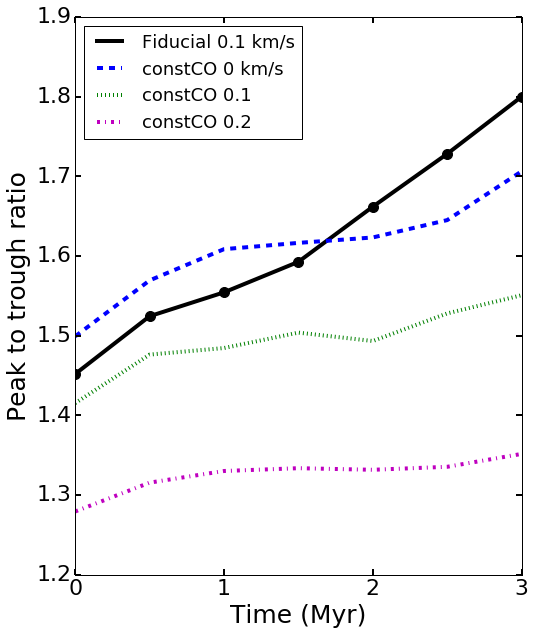
Figure 2 shows that disks with the same mass distribution and ionization environment will have different CO emission line profiles if observed at different ages. We calculate peak-to-trough ratios as a function of time and plot those of the J= lines in Figure 6. In the fiducial model, the CO peak-to-trough ratio increases from about 1.45 to 1.85 as the disk evolves. The change over time is comparable to the increase of peak-to-trough ratio caused by the decrease of turbulent velocities by a factor of 2 to 3, as found in both Simon et al. (2015) and Section 4.2. The growth of the high-velocity line wings induced by chemical evolution can masquerade as a decrease in RMS turbulent speed with time if peak-to-trough ratio is taken as an indicator of only thermal and turbulent speed.
5.1 Assuming CO/H leads to underestimates of turbulent speed
Would an observer misinterpret the high peak-to-trough ratios predicted in our models as signatures of low turbulent velocities? To answer this question, we calculate both constant-CO models and fiducial models with chemical depletion, incorporating a range of turbulent velocities. We then consider how observers would interpret peak-to-trough ratios with no prior knowledge of disk chemical composition. The evolutionary tracks of the peak-to-trough ratio assuming no CO depletion with various turbulent velocities are shown alongside those of the fiducial model in Fig. 6.
The peak-to-trough ratio increases slowly over time even without the effect of CO chemical depletion. During the first million years of evolution, this is due to significant disk cooling as the star dims along the Hayashi track. The decrease of emitting area during CO depletion and the disk cooling combine to increase the peak-to-trough ratio later in the evolution, given that we see the peak-to-trough ratio continue to increase after 1 Myr in our fiducial model but begin to level off after 1 Myr in the constant-CO model. While the fiducial model mimics the peak-to-trough ratios of models with lower turbulent velocities in the first million years of evolution, it produces peak-to-trough ratios higher than what could be explained by the grid of constant CO and constant turbulent velocity models after 1 Myr. Observations that yield peak-to-trough ratios higher than those produced by a disk with constant CO abundance and zero microturbulence might indirectly indicate CO chemical depletion.
 |
 |
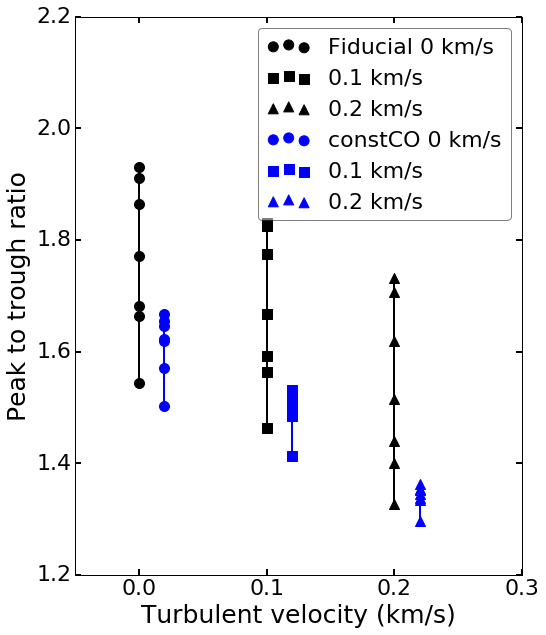
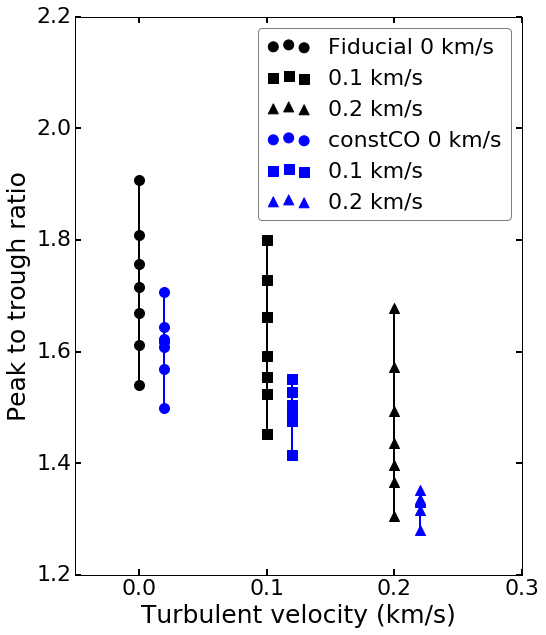
We further illustrate the uncertainties in estimating the turbulent velocity using peak-to-trough ratios by plotting the peak-to-trough ratios from different models against the turbulent velocities used to set up each model. The peak-to-trough ratios of the CO line from the fiducial model (with CO chemical depletion) and constant CO models with turbulent velocities of and are shown in Figure 7. For each model/velocity pair, the peak-to-trough ratio increases over time, creating a vertical spread of points. Models with the same turbulent velocity can produce a wide range of peak-to-trough ratios as CO depletion increases the peak-to-trough ratio over time. One can easily conclude zero turbulence from a disk with CO depletion and a true turbulent velocity of if assuming a constant CO abundance. By assuming a constant CO/H abundance ratio in radius and time, one can easily conclude that there is no turbulence in a CO-depleted disk with an RMS turbulent velocity of . For example, a Myr old with constant CO abundance and no turbulence has the same peak-to-trough ratio as a Myr disk with chemical CO depletion (fiducial model) and a turbulent velocity of .
 |
 |
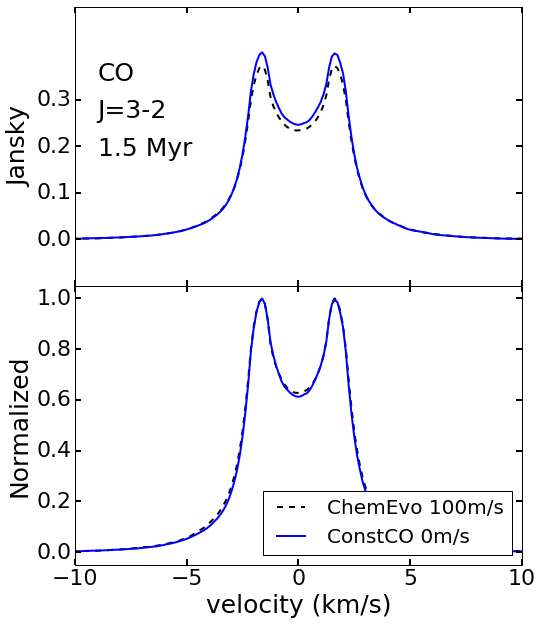
From §4.1 and 4.2, we see that CO depletion tends to produce wide emission lines with large velocity spacing between the peaks. Is there a guaranteed way to break the degeneracy between different models that produce the same peak-to-trough ratio? We experimented with two methods of disentangling chemical depletion and low turbulent speed: comparing CO and C18O line profiles, as advocated in Paper 2, and viewing CO channel maps. From Figure 6, we selected the disk at age 1.5 Myr—a stage when the fiducial model with and the constant-CO model with no turbulence produce CO emission with nearly the same peak-to-trough ratio. Figure 8 shows the CO and C18O line profiles of both models. Although the CO line profiles are nearly identical, the fiducial model has a slightly wider C18O line at 10% of maximum intensity than the constant-CO model. However, the differences between the two line profiles are very subtle, and are not likely to be observable except at very high signal-to-noise.
 |
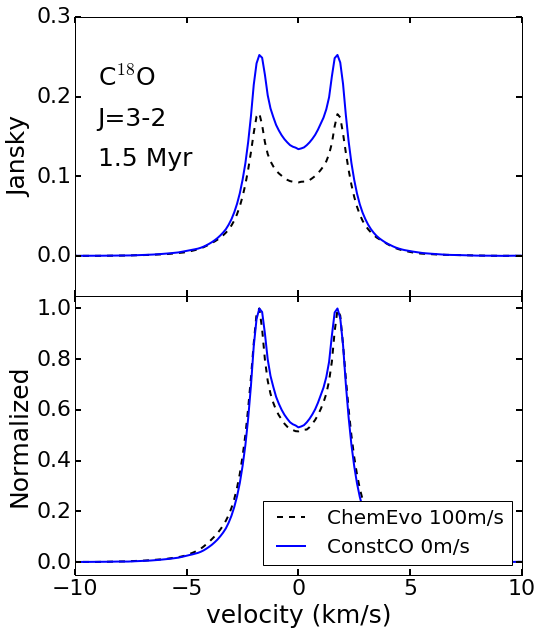 |
Figure 9 shows selected CO channel maps of the fiducial model with 0.1 km/s turbulence (top) and the constant-CO model with no turbulence (middle), both with age 1.5 Myr. The bottom panel shows the difference image, (fiducial - constant CO) in each velocity window. Each panel is AU2. The most obvious feature of the difference image is that the constant-CO model is slightly brighter at larger radii, as positive values are shown in red and negative values are rendered in blue. The fiducial model has slightly more flux in the inner AU of the disk. The differences in any pixel are small, about Jy per pixel, but could add up to 20 mJy in a beam. Figure 9 suggests that the full 3-D data cube could, in principle, constrain both the spatial distribution and the velocity structure of the CO gas.
 |
 |
 |
5.2 Effects of inclination
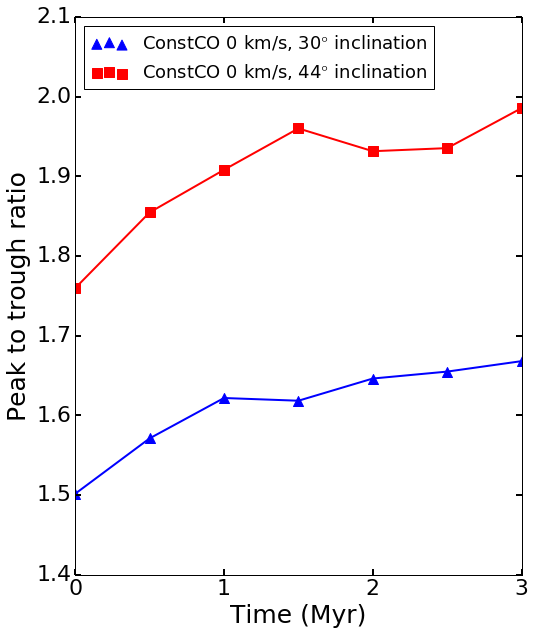
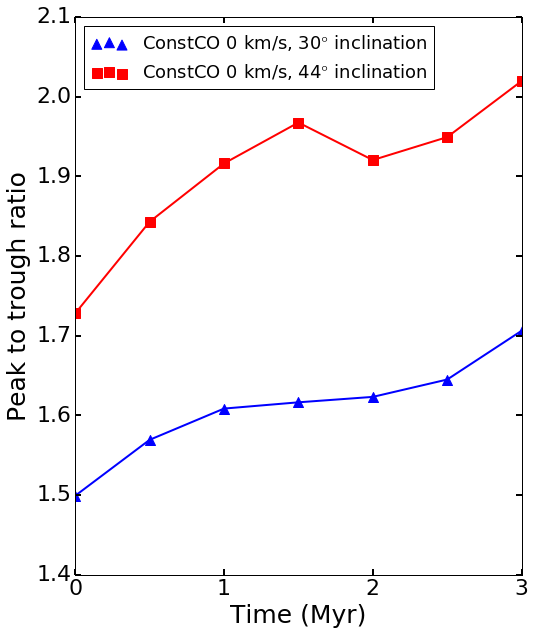
So far we have set a degree inclination for our model disk, while Simon et al. (2015) assumed a degree inclination. The peak-to-trough ratios presented here are therefore smaller than values presented in Simon et al. (2015). To directly compare our model results with the predictions of Simon et al. (2015), we compute the peak-to-trough ratios of CO for the M⊙ disk at a degree inclination, assuming a constant CO abundance and zero turbulent velocities. We choose to compare models with zero turbulent velocities and a constant CO abundance to minimize the differences between this experiment and the low turbulent velocity models in Simon et al. (2015). The peak-to-trough ratios are plotted as the red lines in Fig. 10. Comparing the blue and red lines in the figure, we can see that changing the inclination from to degrees increases the peak-to-trough ratios by about . Translating the peak-to-trough ratio into meaningful information about the turbulent velocity requires detailed knowledge of the disk inclination. For spatially resolved disks, the inclination can be measured directly from the major/minor axis ratio. We caution against using the peak-to-trough ratio as a turbulence diagnostic for any disk without spatially resolved data, where inclination is instead measured either from the SED or from fitting the line profile.
 |
 |
6 Conclusion
We demonstrate how the thermal and chemical evolution of a protoplanetary disk complicates the measurement of the turbulent velocity—a fundamental disk property that controls the first stages of planet formation as grains assemble into pebbles. We show that the peak-to-trough ratio could vary by up to due to the disk evolution over time, as the CO abundance distribution changes and the disk cools. One would underestimate the RMS turbulent speed by as much as by assuming a constant CO/H2 abundance ratio of in a disk with chemical CO depletion. Even when chemical depletion is not operating, simple disk cooling as the star evolves can give an old disk with and a young disk with no turbulence the same observed peak-to-trough ratio.
Quick observations of the abundant 12C16O molecule are, by themselves, inadequate diagnostics of disk turbulence: more detailed information about the disk temperature and CO abundance distribution is required. Deeper observations of multiple isotopologues that yield high signal-to-noise line profiles can help constrain the CO abundance distribution, as can spatially resolved data (Paper 2, §4). In disks where the normalized line profiles are substantially wider for the rare isotopologues C17O and C18O than for CO and 13CO, chemical depletion is well underway and the CO/H2 abundance ratio is not constant with radius. Considering the uncertainties in CO abundance distributions pointed out here and the difficulty of measuring disk temperatures from one or two emission lines only (e.g. Guilloteau et al., 2012; Teague et al., 2016), care should be taken when measuring turbulent speed based on a single peak-to-trough ratio.
Work by MY, KW, SDR and NJT was supported by NASA grant NNX10AH28G and further work by MY and SDR was supported by NSF grant 1055910. This work was performed in part at the Jet Propulsion Laboratory, California Institute of Technology. NJT was supported by grant 13-OSS13-0114 from the NASA Origins of Solar Systems program. MY was supported by a Continuing Fellowship from the University of Texas at Austin. We acknowledge helpful input from J. Simon, E. Bergin and J. Lacy. We thank the referee for comments that improved the quality of the paper.
References
- Aikawa et al. (1999) Aikawa, Y., Umebayashi, T., Nakano, T., & Miyama, S. M. 1999, ApJ, 519, 705
- Bai (2011) Bai, X.-N. 2011, ApJ, 739, 50
- Bai (2013) —. 2013, ApJ, 772, 96
- Bai & Stone (2013) Bai, X.-N., & Stone, J. M. 2013, ApJ, 769, 76
- Bai et al. (2016) Bai, X.-N., Ye, J., Goodman, J., & Yuan, F. 2016, ApJ, 818, 152
- Balbus & Hawley (1991) Balbus, S. A., & Hawley, J. F. 1991, ApJ, 376, 214
- Balbus & Hawley (1998) —. 1998, Reviews of Modern Physics, 70, 1
- Beitz et al. (2011) Beitz, E., Güttler, C., Blum, J., et al. 2011, ApJ, 736, 34
- Bergin et al. (2014) Bergin, E. A., Cleeves, L. I., Crockett, N., & Blake, G. A. 2014, Faraday Discussions, 168, arXiv:1405.7394
- Birnstiel et al. (2009) Birnstiel, T., Dullemond, C. P., & Brauer, F. 2009, A&A, 503, L5
- Birnstiel et al. (2010) —. 2010, A&A, 513, A79
- Blum & Wurm (2008) Blum, J., & Wurm, G. 2008, ARA&A, 46, 21
- Brauer et al. (2008) Brauer, F., Dullemond, C. P., & Henning, T. 2008, A&A, 480, 859
- Brinch & Hogerheijde (2010) Brinch, C., & Hogerheijde, M. R. 2010, A&A, 523, A25
- Dominik & Tielens (1997) Dominik, C., & Tielens, A. G. G. M. 1997, ApJ, 480, 647
- Flaherty et al. (2015) Flaherty, K. M., Hughes, A. M., Rosenfeld, K. A., et al. 2015, ApJ, 813, 99
- Flaherty et al. (2017) Flaherty, K. M., Hughes, A. M., Rose, S. C., et al. 2017, ApJ, 843, 150
- Fromang & Nelson (2006) Fromang, S., & Nelson, R. P. 2006, A&A, 457, 343
- Furuya & Aikawa (2014) Furuya, K., & Aikawa, Y. 2014, ApJ, 790, 97
- Gressel et al. (2015) Gressel, O., Turner, N. J., Nelson, R. P., & McNally, C. P. 2015, ApJ, 801, 84
- Guilloteau et al. (2012) Guilloteau, S., Dutrey, A., Wakelam, V., et al. 2012, A&A, 548, A70
- Güttler et al. (2010) Güttler, C., Blum, J., Zsom, A., Ormel, C. W., & Dullemond, C. P. 2010, A&A, 513, A56
- Hawley (2001) Hawley, J. F. 2001, ApJ, 554, 534
- Hughes et al. (2011) Hughes, A. M., Wilner, D. J., Andrews, S. M., Qi, C., & Hogerheijde, M. R. 2011, ApJ, 727, 85
- Kothe et al. (2010) Kothe, S., Güttler, C., & Blum, J. 2010, ApJ, 725, 1242
- Landry et al. (2013) Landry, R., Dodson-Robinson, S. E., Turner, N. J., & Abram, G. 2013, ApJ, 771, 80
- Lesur et al. (2014) Lesur, G., Kunz, M. W., & Fromang, S. 2014, A&A, 566, A56
- Mendigutía et al. (2013) Mendigutía, I., Brittain, S., Eiroa, C., et al. 2013, ApJ, 776, 44
- Salmeron & Wardle (2008) Salmeron, R., & Wardle, M. 2008, MNRAS, 388, 1223
- Simon et al. (2013) Simon, J. B., Bai, X.-N., Armitage, P. J., Stone, J. M., & Beckwith, K. 2013, ApJ, 775, 73
- Simon et al. (2015) Simon, J. B., Hughes, A. M., Flaherty, K. M., Bai, X.-N., & Armitage, P. J. 2015, ApJ, 808, 180
- Teague et al. (2016) Teague, R., Guilloteau, S., Semenov, D., et al. 2016, A&A, 592, A49
- Walsh et al. (2014) Walsh, C., Millar, T. J., Nomura, H., et al. 2014, A&A, 563, A33
- Woodall et al. (2007) Woodall, J., Agúndez, M., Markwick-Kemper, A. J., & Millar, T. J. 2007, A&A, 466, 1197
- Woods & Willacy (2009) Woods, P. M., & Willacy, K. 2009, ApJ, 693, 1360
- Yu et al. (2017) Yu, M., Evans, II, N. J., Dodson-Robinson, S. E., Willacy, K., & Turner, N. J. 2017, ApJ, 841, 39
- Yu et al. (2016) Yu, M., Willacy, K., Dodson-Robinson, S. E., Turner, N. J., & Evans, II, N. J. 2016, ApJ, 822, 53
- Zsom et al. (2011) Zsom, A., Ormel, C. W., Dullemond, C. P., & Henning, T. 2011, A&A, 534, A73