Electroporation dynamics for different pore lifetimes
based on the standard model
Thiruvallur R. Gowrishankar,1
Julie V. Stern,1 and
James C. Weaver1,2
1Harvard-MIT Division of Health Sciences and Technology,
Massachusetts Institute of Technology, Cambridge, MA 02139, USA
2Corresponding author: jcw@mit.edu
Abstract
Standard model of electropration (EP) has long emphasized a single pore lifetime to explain post-pulse transport across cell membranes. However, pore lifetimes estimated from molecular dynamics (MD) models and and those measured from experimental data differ by several orders of magnitude. We hypothesize that a broad distribution of lifetimes may describe the post-pulse behavior. Here, we show that pore distribution, number and size of pores, show interesting behavior in different ranges of pore lifetimes. Interestingly, for large electric fields ( 1 kV/cm) and short pore lifetimes (100 ns), an siginificant loss in pore number occurs during the pulse. Given the large number of EP applications that apply such fields, this phenomenon may be crucial to post-pulse response of cell membrane to such fields.
1 Introduction
Lipid bilayers that constitute cell membranes maintain ionic and moelcular concentration gradient across the membranes. Electroporation (EP), a non-thermal response of lipidic membranes to an electric field pulse, compromise the barrier to transmembrane transport of ions and membranes. The highly nonlinear and hysteretic phenomenon of the standard EP model results from the creation, evolution and destruction of membrane pores [1, 2, 3, 4, 5, 6]. Typical EP fields range in amplitude from a few hundred V/cm to hundreds of kV/cm and in duration from a few nanoseconds to hundreds of milliseconds [7].
Cell EP is already well established in medicine [8], specificially in applications such as in vitro and in vivo gene transfection [9], delivery of bioactive molecules by EP [10], and analysis of intracellular contents and delivery of small molecules by microfluidic EP [11]. In addition, four distinct methods of tissue ablation based on EP are being pursued, viz., electrochemotherapy (ECT) [12, 13], irreversible electroporation (IRE) [14], calcium-EP [15] and EP by nanosecond pulsed electric field (nsPEF) pulses [16, 17]. Recently, an emerging application based on bipolar cancellation of cellular responses to nanoelectroporation has gained attention [18, 19].
All aspects of pore dynamics are governed by the transmembrane voltage-dependent pore energy or landscape, . Pore creation and destruction are described by two absolute rate equations that depend on the pore energy landscape [4, 20]. Pores created with radius are considered short-lived, and hydrophobic. These pores are rapidly destroyed by thermal fluctuations in the membrane [21]. Pore expansion and contraction are modeled by the Smoluchowski equation that incorporate the pore energy landscape. Cell membrane EP models determine the EP dynamics using the free energy cost of creating membrane pores of a particular pore radius. This energy, , is reduced by an elevated transmembrane voltage.
EP experiments report pore lifetimes () ranging from 100 ns to 1,000 s. Traditionally these are based on measurements of post-pulse membrane recovery, usually termed “resealing” [22]. Some complex events may occur as TPs and CPs are simultaneously formed, with molecules and molecular segments drawn into CPs as they form [23]. Such structures may be fleeting, but may contribute to solute rectification, with net transport persisting long afterwards. Molecular dynamics (MD) models of traditional lipidic pores have lifetimes, , of order ns [24, 25]. A longer lifetime estimate is 0.02 s, based on recovery between pulses in a pulse train [26]. Modeling of calcein uptake by prostate cancer cells [27] determines a lifetime of 4 s [4]. Another experiment [28] shows a long-lasting membrane permeability with a post-pulse recovery of PM extending to 180 s. In addition, other experiments [29, 30] show a delayed uptake of propidium over 300 s after the pulse. Recently, we hypothesized that complex pores in membrane lead to a broad distribution of pore lifetimes [22, 23]. Here, we look at the EP response of a cell membrane model for two pore lifetimes that differ by several orders of magnitude.
2 Methods
2.1 Pore energy
The dynamic behavior of pores is determined by the pore energy landscape [4]. The transmembrane voltage-dependent pore energy, , defines the creation, expansion, contraction and destruction of pores. Pore energy is the sum of mechanical and electrical energy
where
The mechanical energy results from three contributions: steric repulsion energy, edge energy, and surface interfacial energy. The elctrical energy is energy from electrical force on expanding force.
The resealing time constant is approximately related to the energy barrier to pore destruction by [4]
The equation above is solved numerically to find the value of the pore destruction barrier that results in approximately the desired resealing time constant . The algorithm adjusts the value of until the resulting is equal to the desired value.
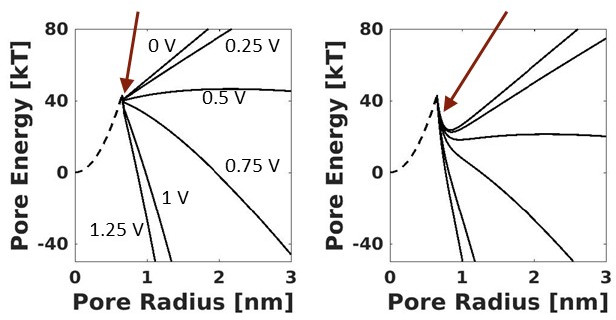
Pore energy landscape shows the behavior of pore energy as a function of
pore radius for different transmembrane voltages.
Different energy landscapes (Fig. 1) were generated with mostly
identifical parameters
for pore lifetimes of 100 ns and 4 s. The only parameter that was
changed was the pore radius at which the pore energy minimum is located.
2.2 Cell model
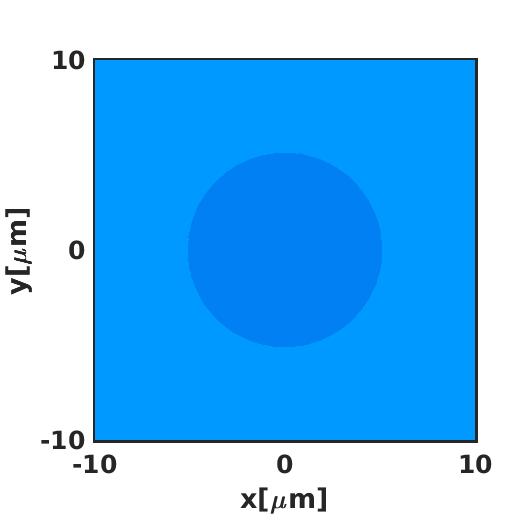
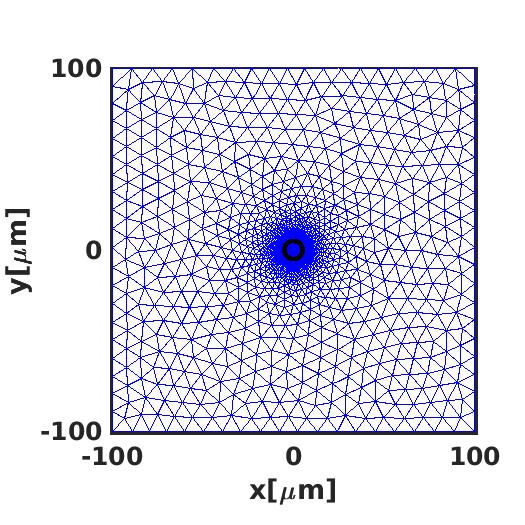
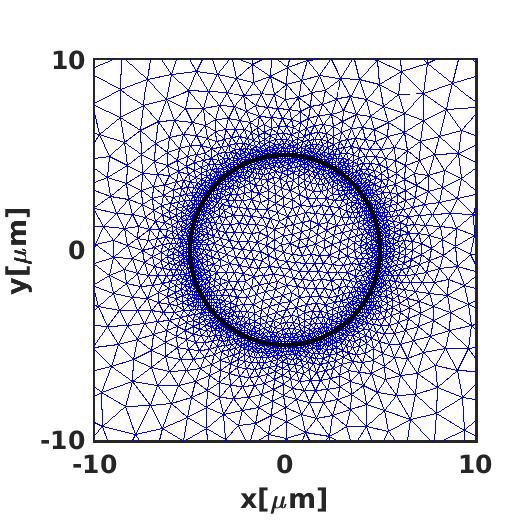
We use a meshed cell membrane model [31, 4] to simulate the dependence of pore lifetime on the response of the model to different applied fields. The model includes transmembrane voltage-driven pore creation, and stochastic pore destruction in a typical mammalian cell plasma membrane (PM). We employ a dynamic local model of EP based on a meshed transport network system model [31, 32, 33] consisting of a cylindrical cell membrane, intracellular and extracellular solutions, and idealized electrodes at the boundaries of the system model [31, 4] (Fig. 2). The plasma membrane (PM) is in radius, in length, and 4 nm thickness [see Fig. 2(a)].
Cell EP involves spatially distributed, highly nonlinear and hysteretic interactions throughout the system model, and can only be solved computationally [34, 1, 32, 35, 2, 36]. Features of the present model [31, 4] include mesh creation for a 150 node-pair plasma membrane and 9267 nodes for the intra- and extracellular aqueous electrolytes, with charge transport and storage between mesh nodes [see Fig. 1(b)-(c)]. We also include a -50 mV resting potential source for each membrane site, which is shunted by increased membrane conductance due to pores.
The model geometry, meshing, and electroporation parameters are identical to the model used in recent work examining the dynamic pore population response to a range of electroporating pulses [31, 4]. One important feature is a realistic and non-trivial computation of rapidly changing membrane conductance. This is complicated because of non-linear individual pore conductance arising from both pore size and local transmembrane voltage, [34, 1, 4, 31].
2.3 Applied field
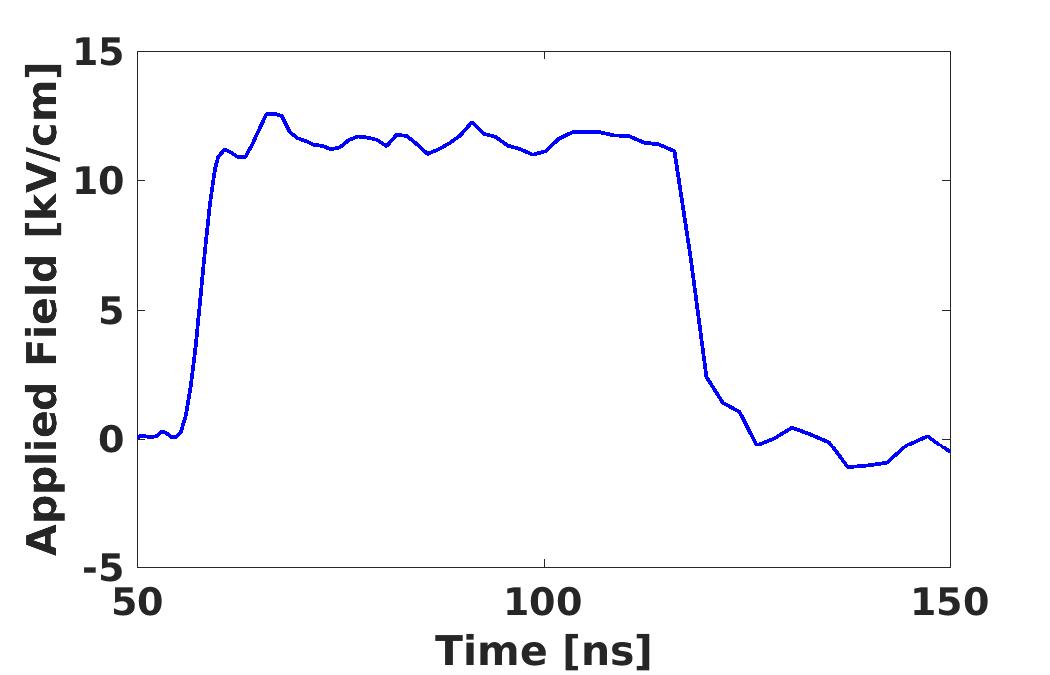
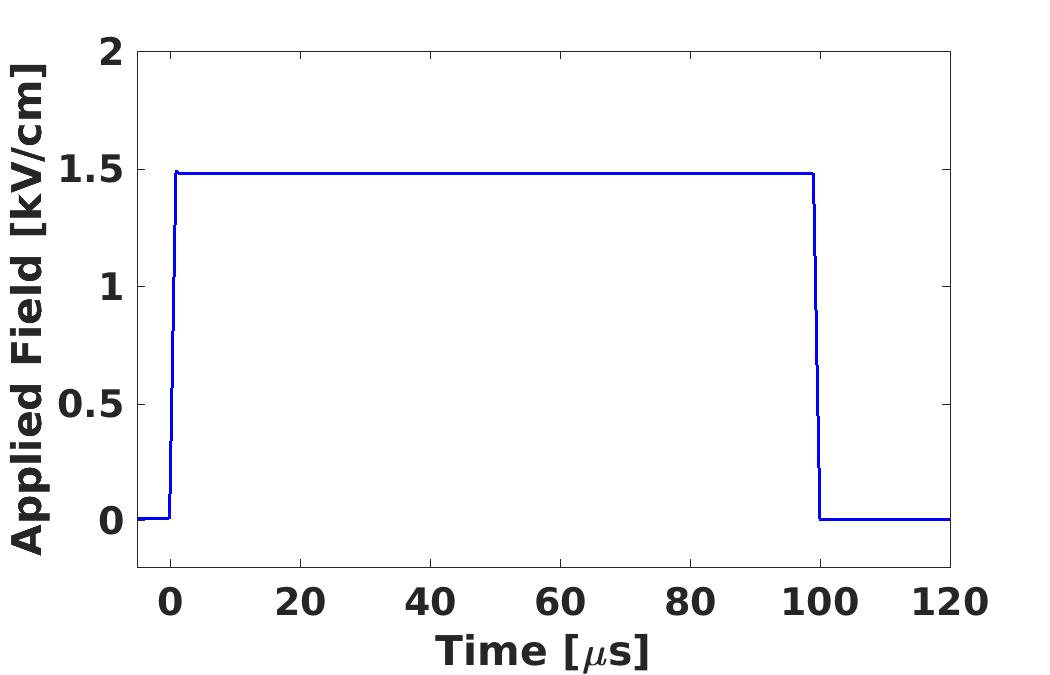
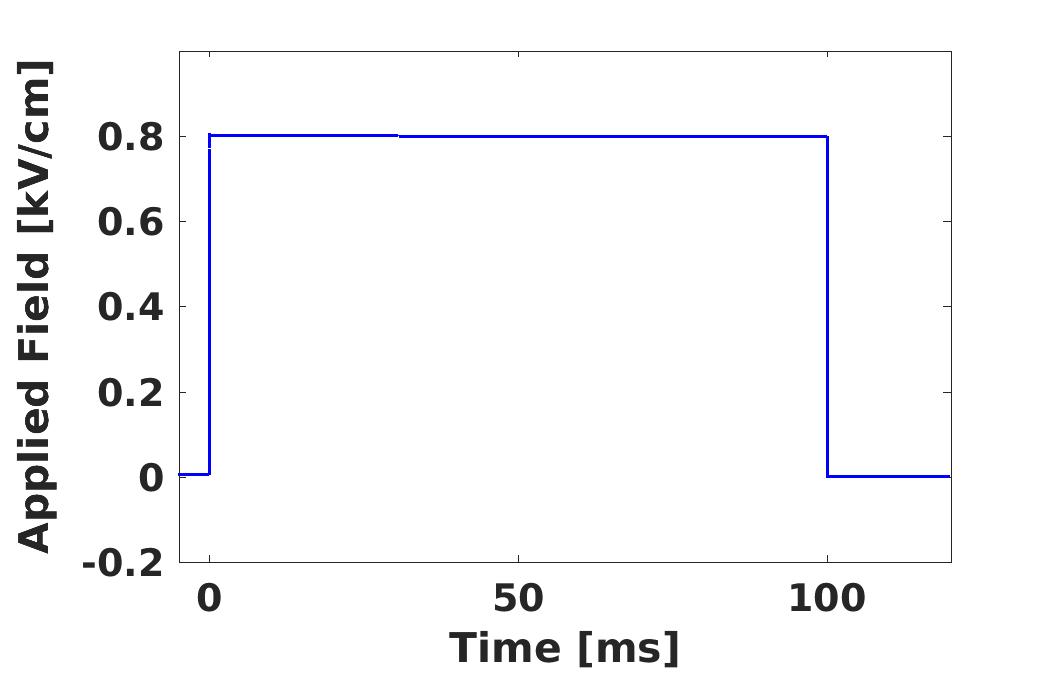
Three different electric field pulses are employed (Fig. 3). These are a 13.3 kV/cm, 60 ns experimental nsPEF pulse [30], an idealized 1.5 kV/cm, 100 s trapezoidal pulse with 1 s rise and fall times, and a 0.8 kV/cm, 100 ms trapezoidal pulse with 1 s rise and fall times [37]. Model parameters are listed in Table 1.
3 Results
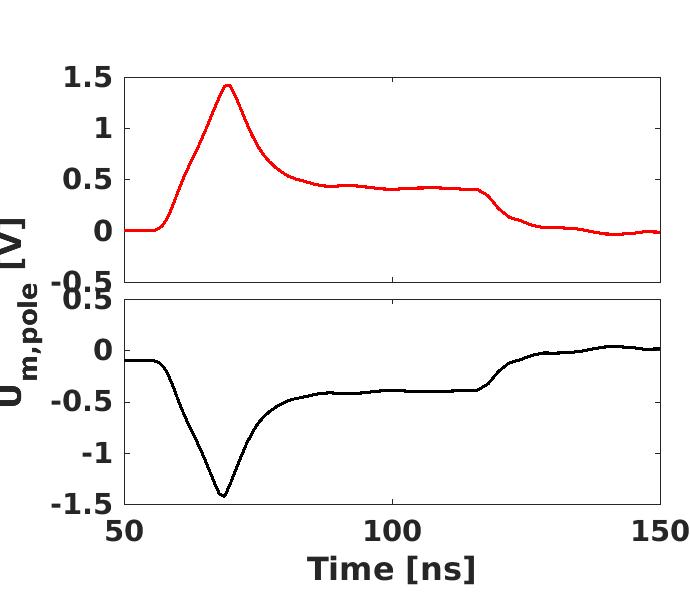
3.1 Transmembrane voltage response
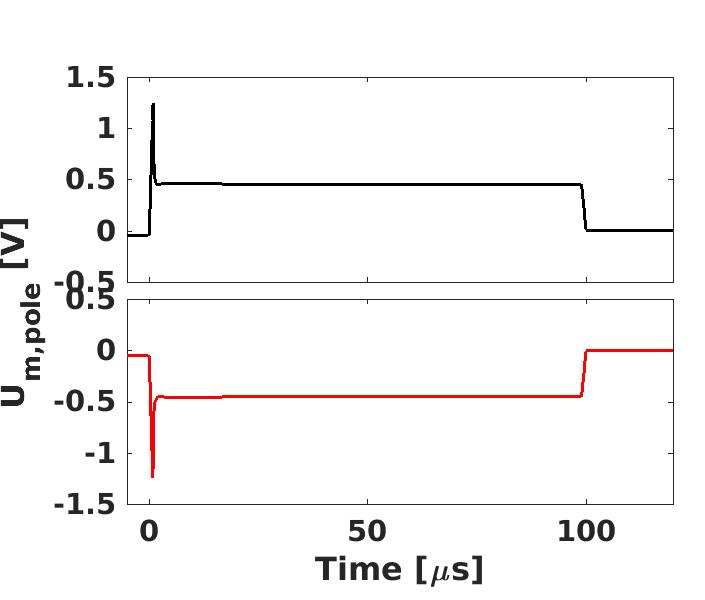
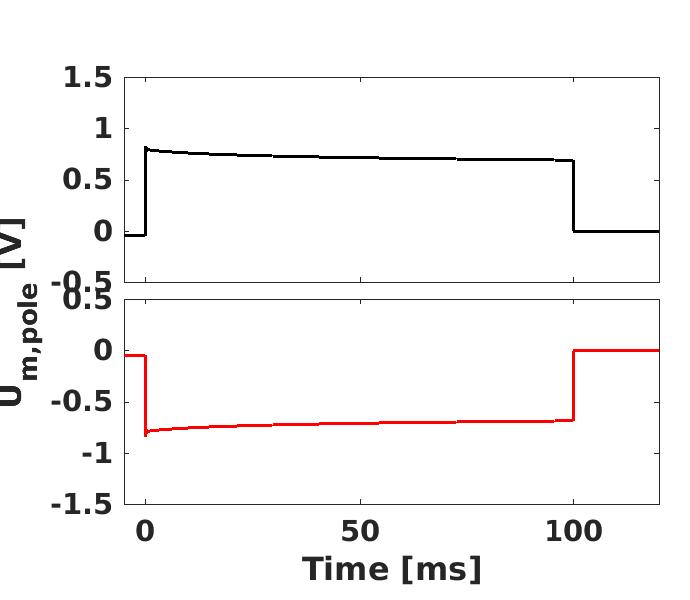
The transmembrane voltage response shows different behavior during the pulse for the three different field pulses (Fig. 4). The large magnitude (13.3 kV/cm) nsPEF pulse creates a large number of pores in the membrane causing a high conductance shunt in the membrane. This leads to the reduction of transmembrane voltage to 0.5 V (Fig. 4 left) for the rest of the pulse (reversible electrical breakdown; REB). Following the pulse, the transmembrane voltage decreases nearly to zero. The REB behavior is also seen with the 1.5 kV/cm conventional EP pulse (Fig. 4 middle). However, the amplitude of the long pulse (0.8 kV/cm) is not sufficiently large to create a large number of pores. Consequently, this pulse does not exhibit REB (Fig. 4 right).
3.2 Total pore number
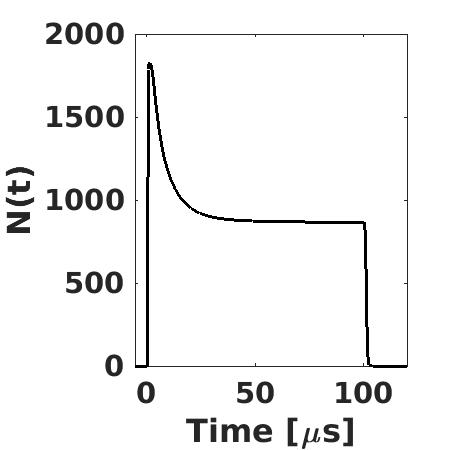
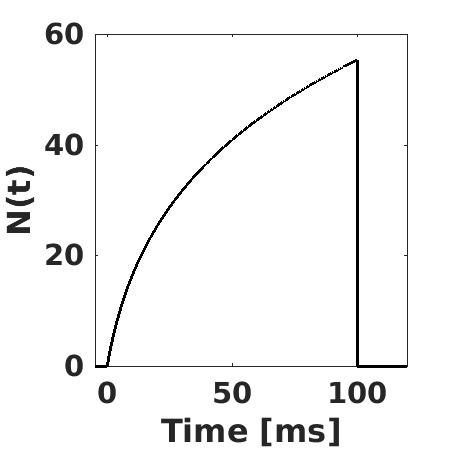
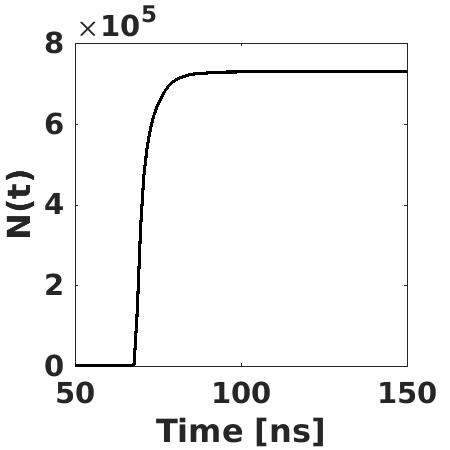
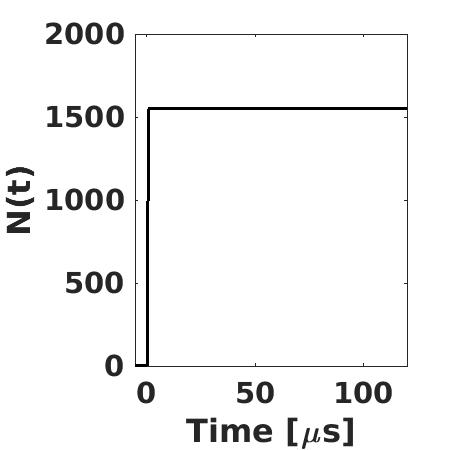
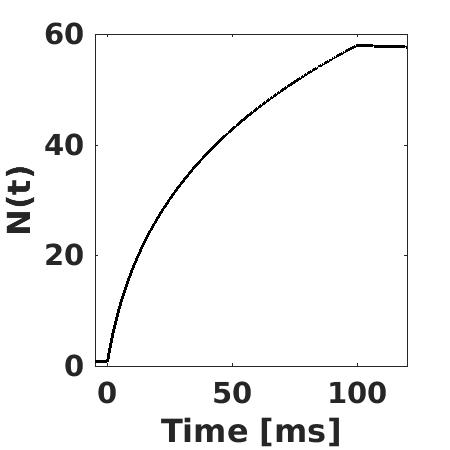
The most interesting result is the decline in pore number, , during the pulse for short pore lifetimes (100 ns; Fig. 5, top row). When the field amplitude is large enough to create over 1,000 pores, the membrane conductance increases by several orders of magnitude causing the transmembrane voltage to drop during the pulse (REB). This prevents the pores from expanding and given the short pore lifetime, a fraction of existing pores disappear during the pulse. This phenomenon is striking for a 1.5 kV/cm, 100 s pulse (Fig. 5, top middle). This effect is also seen for a nsPEF pulse (Fig. 5, top left) although not as pronounced as that seen with a conventional pulse. However, when the field strength is not large enough to create a REB, as in the 0.8 kV/cm, 100 ms pulse, many fewer pores are created and the conductance is not large enough to cause a decline in pore number (Fig. 5, top right).
The decline in pore number is, however, not seen when the pore lifetime is 4 s (Fig. 5, bottom row). The pore lifetime in this case is much longer than the pulse duration ensuring that the pores created at the onset of the pulse do not decay before the pulse ends. The maximum number of pores is nearly the same for both pore lifetimes for a given field pulse.
3.3 Pore dynamics
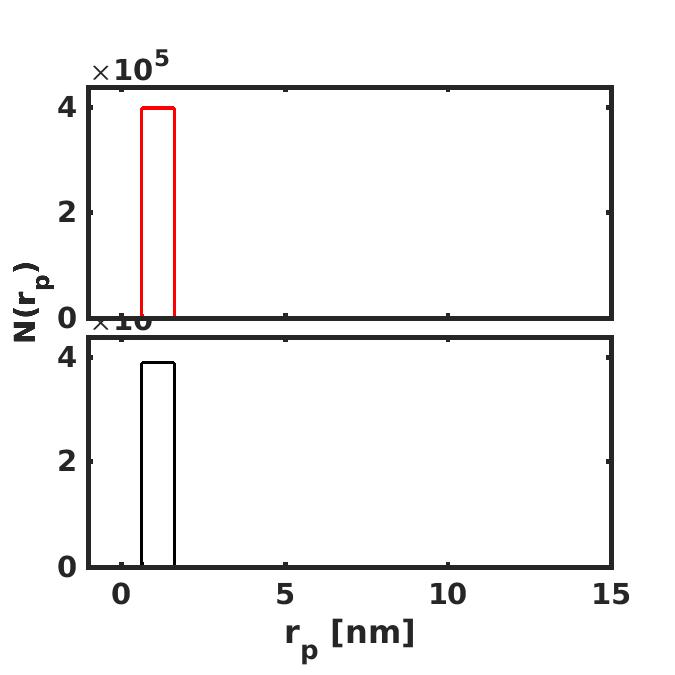
Evolution of pore distribution for different field pulses and the two pore lifetimes are shown in Figs. 6-8.
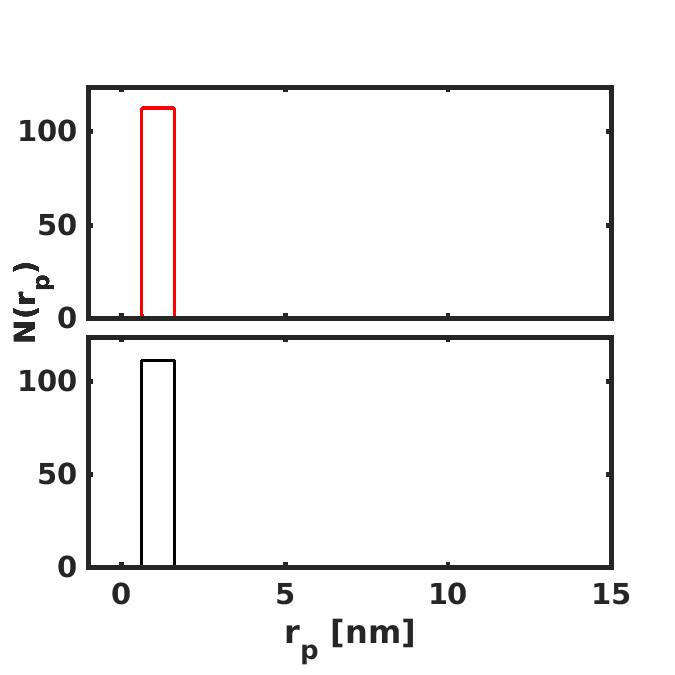
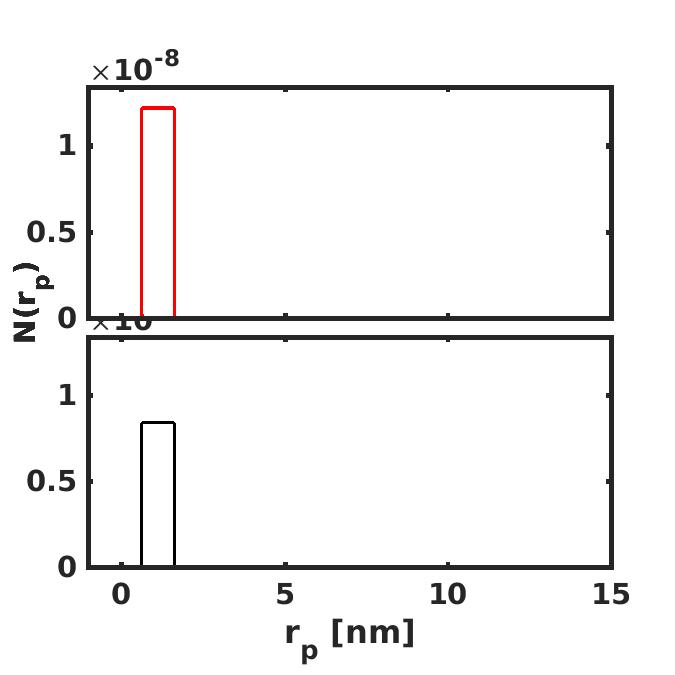
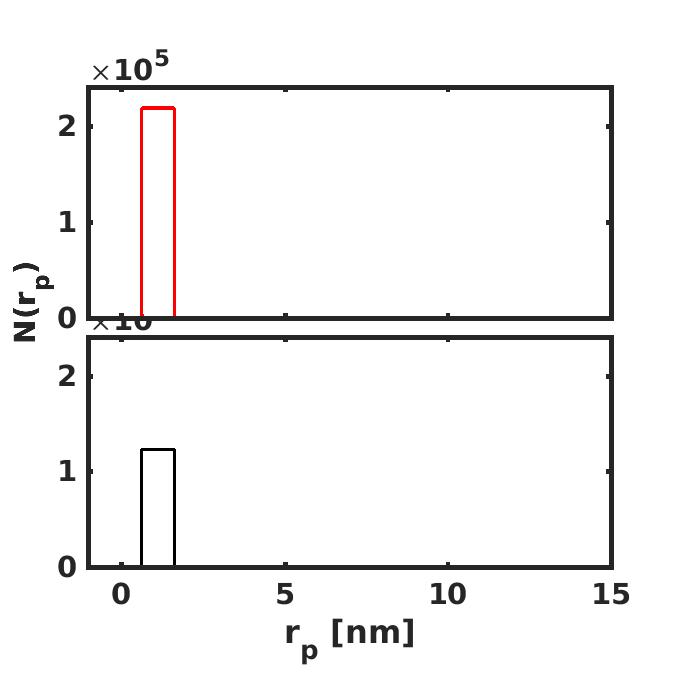
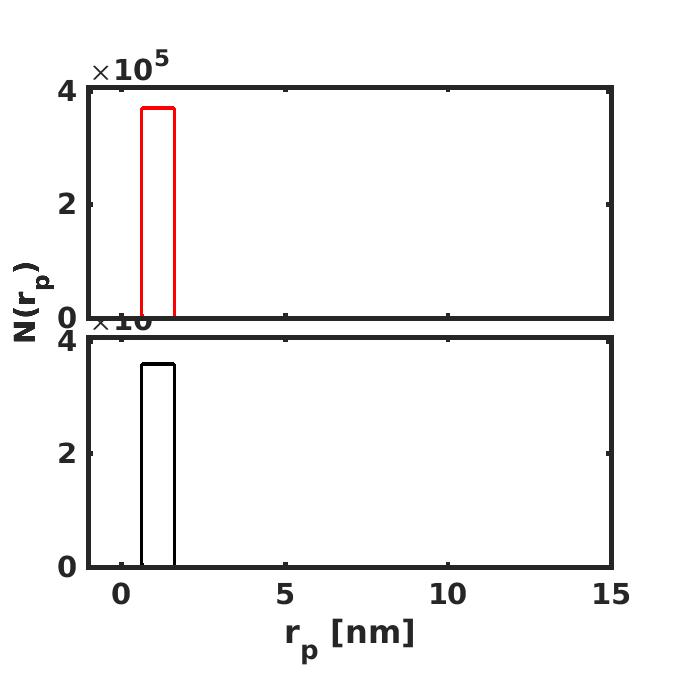
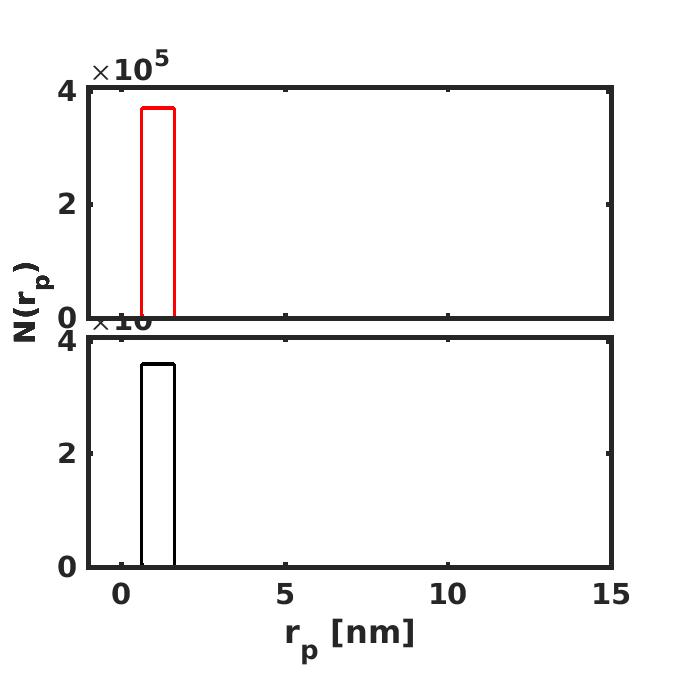
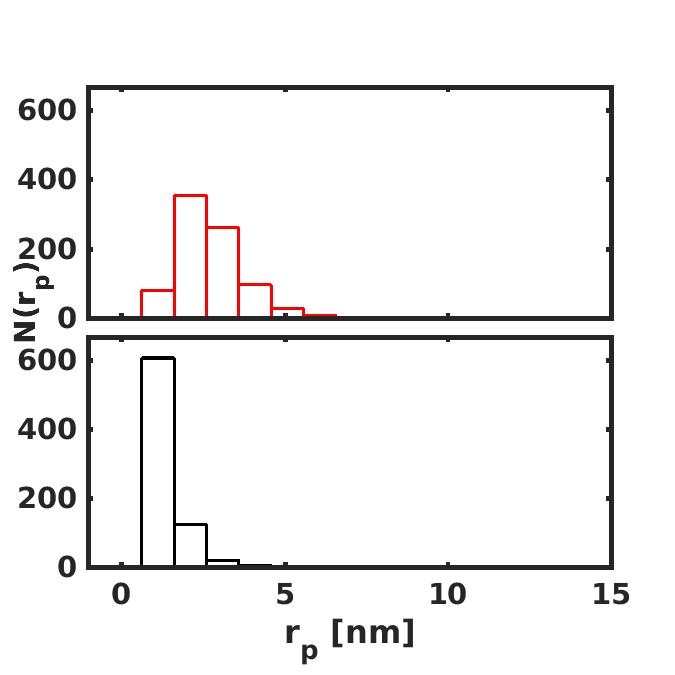
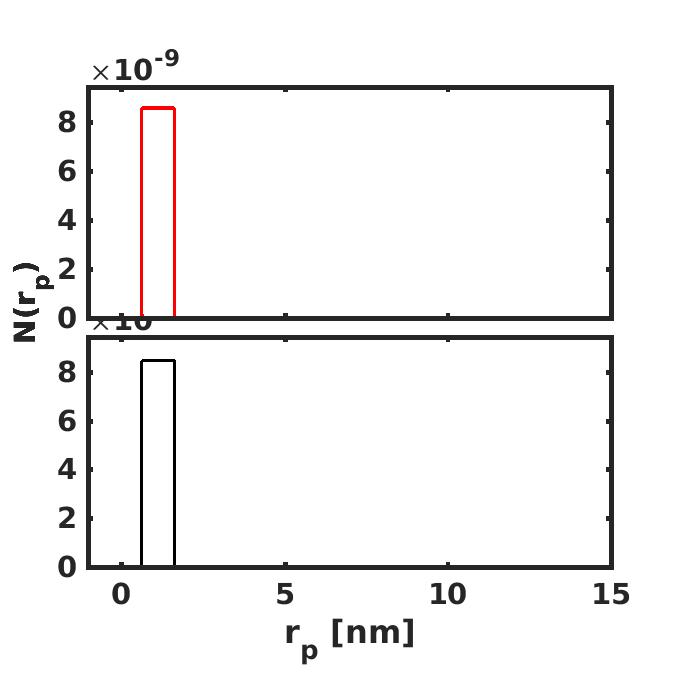
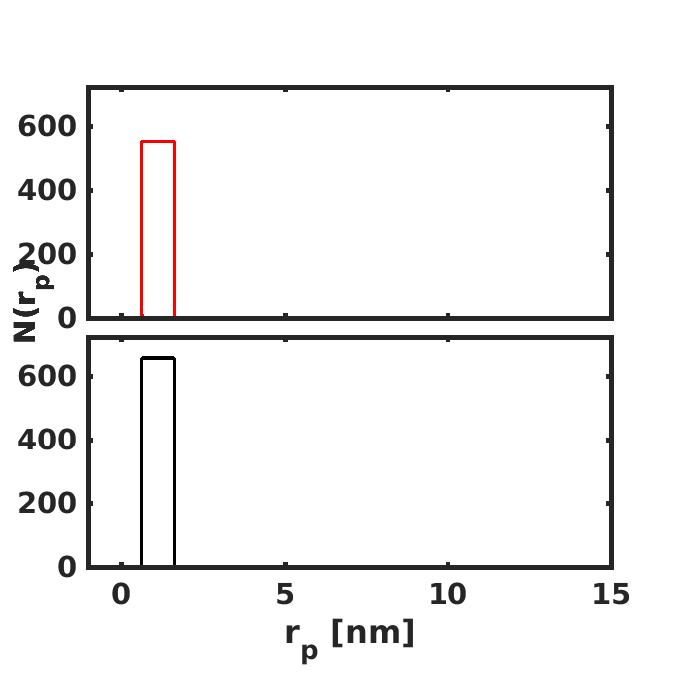
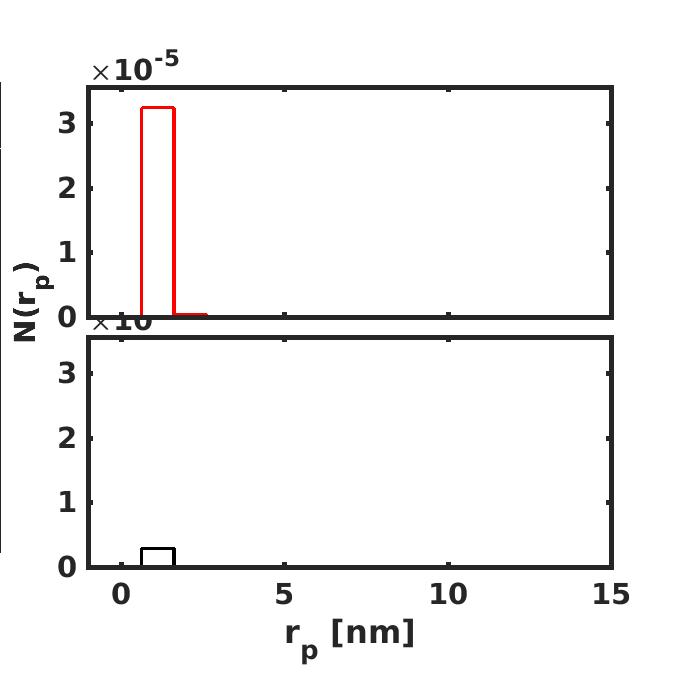
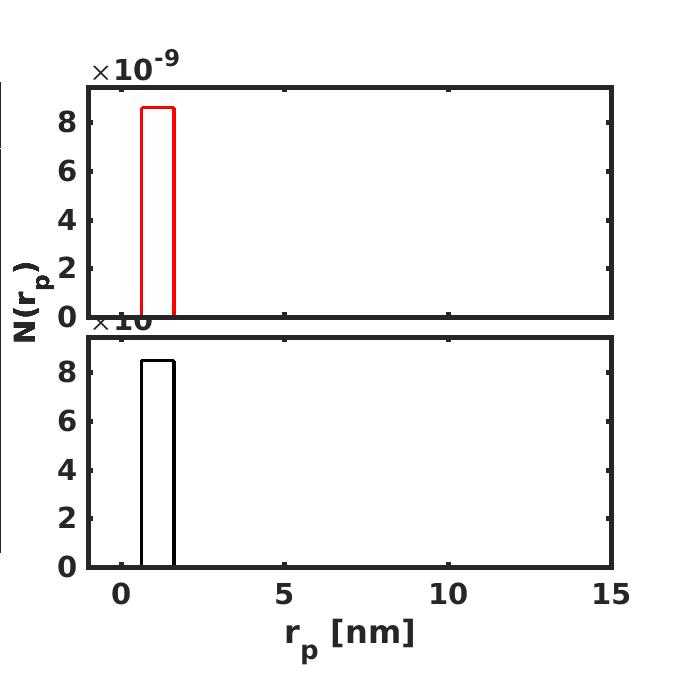
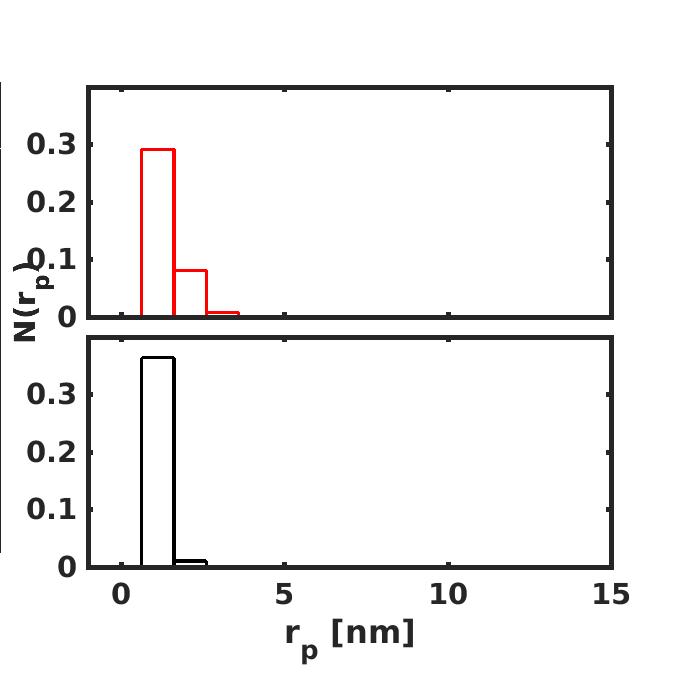
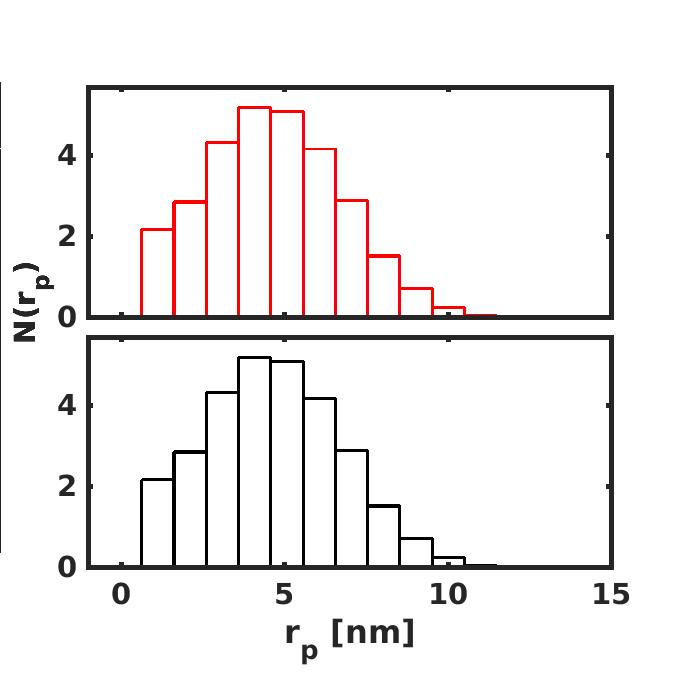
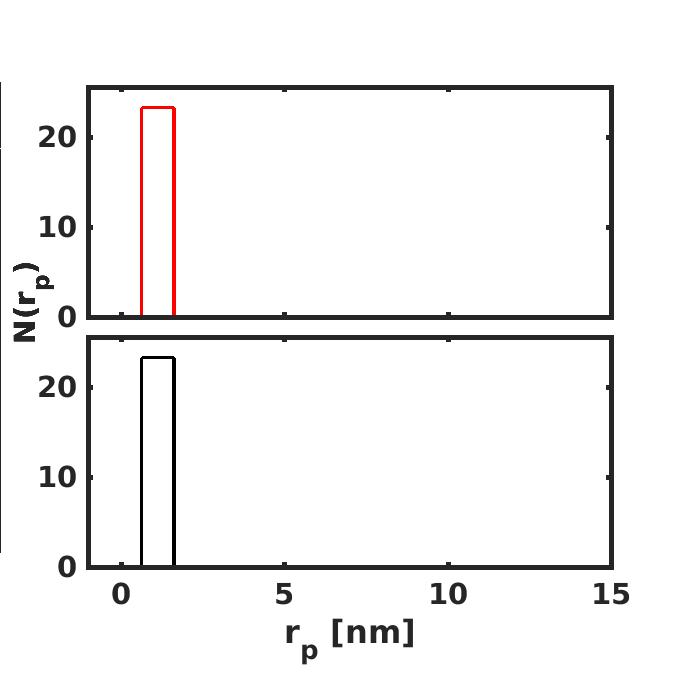
A short duration, large amplitude (nsPEF; 13.3 kV/cm, 60 ns) pulse creates a large number of pores (Fig. 6). However, the short duration of the pulse precludes the pores from expanding much during the pulse. At the onset of the pulse (Fig. 6 left), there is a slight asymmetry between anodic (top panel) and cathodic (bottom panel) sides because of the resting transmebrane voltage (-50 mV). Most of the pores remain close to 0.7 nm in radius. In the case of 100 ns pore lifetime (Fig. 6, top row), most of the pores disappear shortly after the pulse ends, the number of pores decreases from nearly 400,000 at the end of the pulse to 100 within 1 s (Fig. 6, top center left and top center right). By 1 s, the pore distribution relax to a thermalized distribution (Fig. 6, top right). In contrast, when the pore lifetime is 4 s, most pores remain in the membrane even at 1 s after the pulse ends (Fig. 6, bottom right). In the 4 s case, the number of pores decreases from 400,000 at the end of the pulse to nearly 300,000 at 1 s post-pulse.
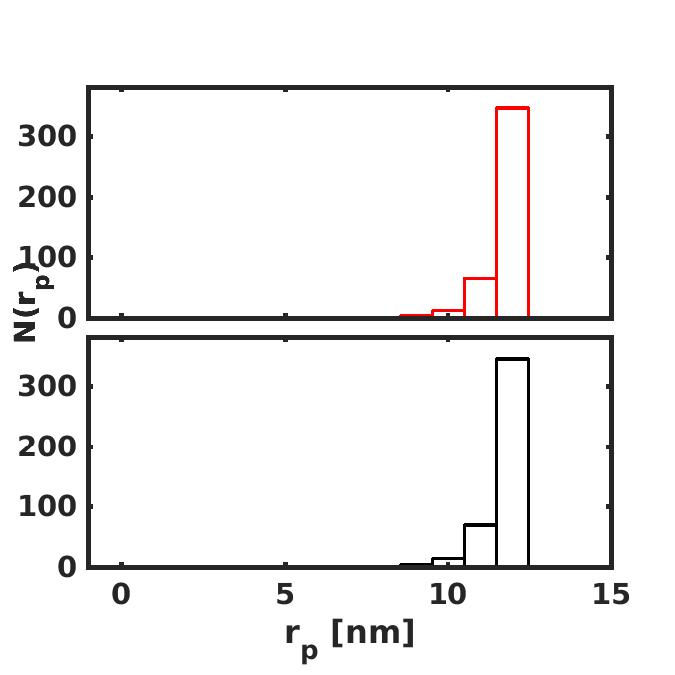
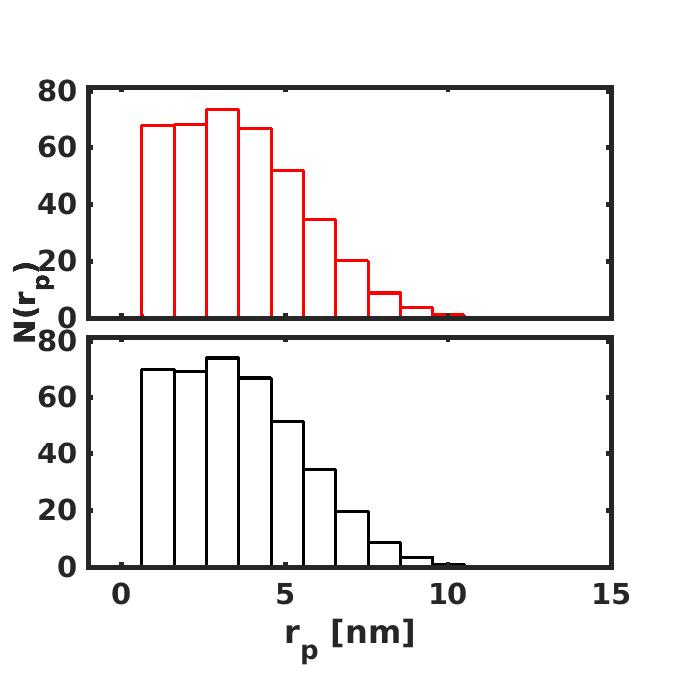
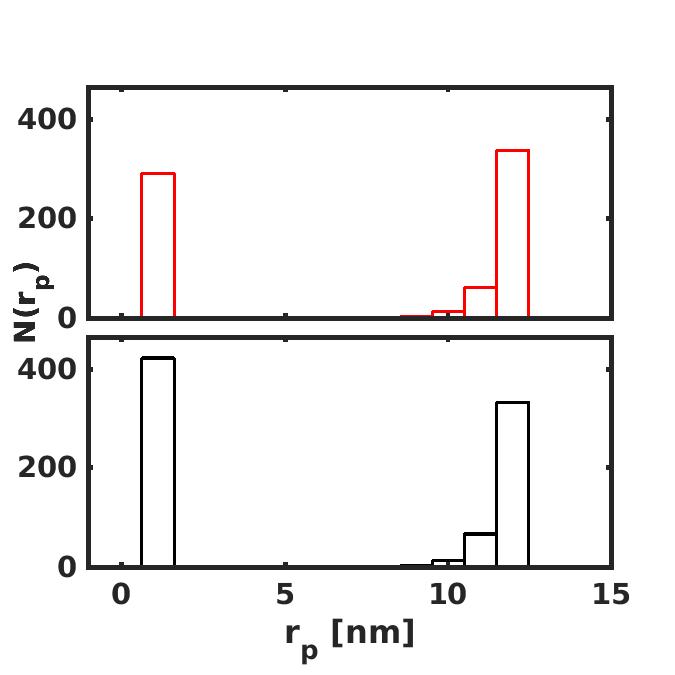
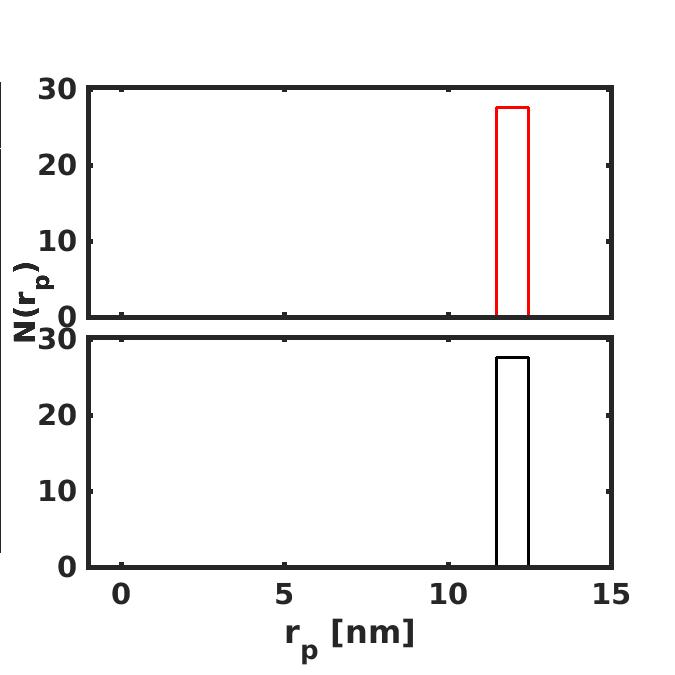
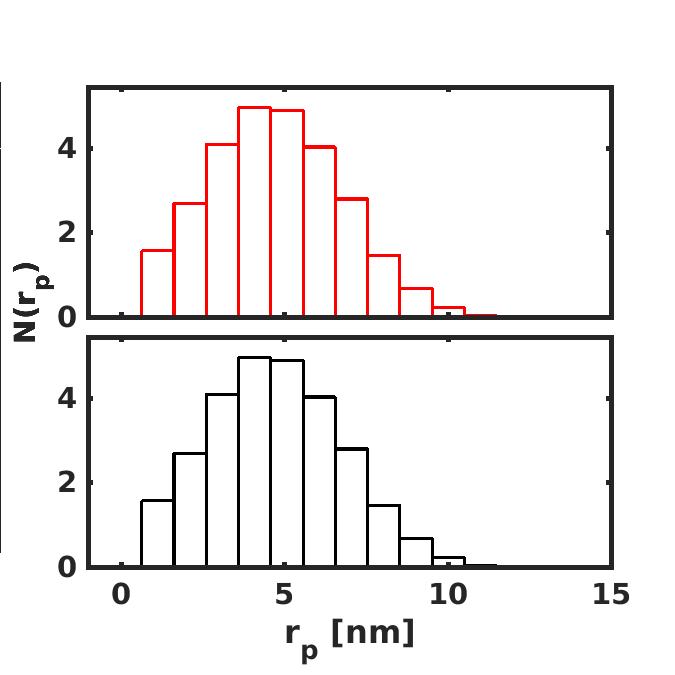
In the case of a conventional EP pulse (1.5 kV/cm, 100 s trapezoidal pulse), the total number of pores is much smaller smaller than from a nsPEF pulse. However, the pores begin to expand even as early as 1 s into the pulse. Most pores expand to 12 nm (maximum pore size in the model) thus increasing the membrane conductance and preventing new pores being created (Fig. 7, top left and top center left) in the case of 100 ns pore lifetime. Once the pulse ends, the pores relax back toward the minimum pore radius. By 1 s after the pulse, the pore distribution has relaxed to a thermal distribution in the case of a 100 ns pore lifetime (Fig. 7, top right). When the pore lifetime is increased to 4 s, pore creation competes with pore expansion leading to nearly equal number of pores at and . Following the pulse, the number of pores relaxes much more slowly (with a time constant of 4 s). As seen in Fig. 7, bottom right, over 600 pores still remain 1 s post-pulse on both anodic and cathodic sides.
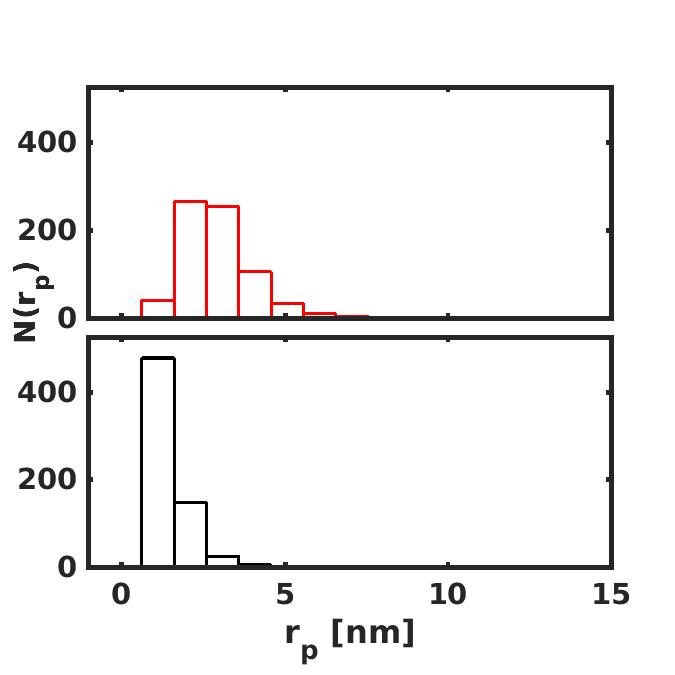
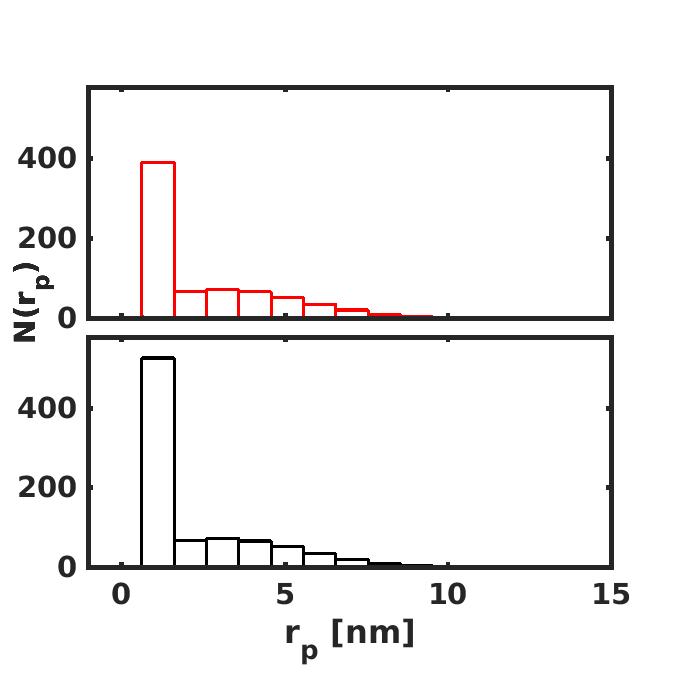
A much longer, but lower amplitude pulse (100 ms, 0.8 kV/cm) creates even less number of pores in the membrane (Fig. 8). But, all the pore expand to the maximum pore radius by the end of the pulse (Fig. 8, top center left). Once the pulse ends, the pore distribution begins to contract toward a thermalized distribution. By 1 s post pulse, only the minimum-sized pores remain in the membrane (Fig. 8, right) for both 100 ns and 4 s pore lifetimes. However, most of the pores have vanished in the short pore lifetime cases while a significant number of pores remain in the case of 4 s pore lifetime.
4 Discussion
Pore lifetime is a basic measure of pore destruction. It is often determined from exponentially decaying membrane conductance or permeability. The traditional view of a single pore lifetime does not adequately represent the complex behavior of a cell membrane response during and after an electric field is applied. The dynamics of membrane response to such fields is complicated by the presence of a number of biological molecules in different conformational states and binding affinities.
Our results suggest that a fraction of the pores with very short lifetimes (shorter than the pulse duration) may disappear during the pulse if their numbers are large enough to cause a reverisble electrical breakdown (REB) of the membrane. However, if the pulse is not sufficiently large, it may create fewer pores that expand during the pulse without causing an overall decrease in the pore number. These differences in post-pulse pore distribution (size and number) may lead to significant differences in the transmembrane transport of various size molecules. This has a broad impact on many EP applications that employ fields that span several orders of magnitude in duration and strength.
The long EP pulse (0.8 kV/cm, 100 ms) shows a steady decline in transmembrane voltage during the pulse. Unlike most optical measurements, electrical response of the cell membrane during the pulse could be measured with sufficient time resolution to investigate the decline in transmembrane voltage during the pulse. A long, low amplitude pulse does not create a large number of pores, but as the pores expand, the membrane conductance increases leading to a decrease in transmembrane voltage. This behavior could be verified using field pulses in the range of a few hundred kV/cm and durations of hundreds of milliseconds.
Recent experiments using optical single-channel recording provide insight into EP dynamics [38, 39]. These experiments confirm that EP behavior is not characterized by a single dynamic but by a range of fluctuation kinetics. In addition, the experiments determine the energy barrier to pore opening to be around 25 kT.
Pore energy landscapes with different pore lifetimes help in exploring the response of membrane at different time scales, during, immediatley after the pulse and long after the pulse. These descriptions are particularly useful in explaining experiments that demonstrate post-pulse membrane transport for hundreds of seconds to several minutes. In addition, the pore energy landsacpes may also assist in understanding the phenomenon of bipolar cancellation that has been reported in different cell types [18, 19].
Acknowledgements
This work was supported by AFOSR MURI grant FA9550-15-1-0517 on Nanoelectropulse-Induced Electromechanical Signaling and Control of Biological Systems, administered through Old Dominion University. We thank P. T. Vernier, and A. G. Pakhomov for multiple stimulating discussions, and K. G. Weaver for computer support.
References
- [1] W. Krassowska and P. D. Filev. Modeling electroporation in a single cell. Biophys. J., 92:404–417, 2007.
- [2] A. T. Esser, K. C. Smith, T. R. Gowrishankar, Z. Vasilkoski, and J. C. Weaver. Mechanisms for the intracellular manipulation of organelles by conventional electroporation. Biophys. J., 98:2506–2514, 2010.
- [3] S. Talele, P. Gaynor, M. J. Cree, and J. van Ekeran. Modelling single cell electroporation with bipolar pulse parameters and dynamic pore radii. J. Electrostatics, 68:261–274, 2010.
- [4] K. C. Smith. A unified model of electroporation and molecular transport. Massachusetts Institute of Technology, http://dspace.mit.edu/bitstream/handle/1721.1/63085/725958797.pdf.
- [5] J. C. Weaver and Y. A. Chizmadzhev. Electroporation. In C. Polk and E. Postow, editors, Handbook of Biological Effects of Electromagnetic Fields, pages 247–274. CRC Press, Boca Raton, 2nd edition, 1996.
- [6] J. C. Weaver. Electroporation of biological membranes from multicellular to nano scales. IEEE Trans. Dielect. Elect. Ins., 10:754–768, 2003.
- [7] J. C. Weaver, K. C. Smith, A. T. Esser, R. S. Son, and T.R. Gowrishankar. A brief overview of electroporation pulse strength –- duration space: A region where additional intracellular effects are expected. Bioelectrochemistry, 87:236–243, 2012.
- [8] M. L. Yarmush, A. Goldberg, G. Sersa, T. Kotnik, and D. Miklavcic. Electroporation-based technologies for medicine: Principles, applications, and challenges. Annu. Rev. Biomed. Eng., 16:295–320, 2014.
- [9] A. Gothelf, , and J. Gehl. What you always needed to know about electroporation based dna vaccines. Hum. Vaccin. Immunother., 8:1694–1702, 2012.
- [10] M. S. Venslauskas, S. Satkauskas, and R. Rodaite-Riseviciene. Efficiency of the delivery of small charged molecules into cells in vitro. Bioelectrochem., 79:130–135, 2010.
- [11] T. Geng and C. Lu. Microfluidic electroporation for cellular analysis and delivery. Lab Chip, 13:3803–3821, 2013.
- [12] C. Y. Calvet and L. M. Mir. The promising alliance of anti-cancer electrochemotherapy with immunotherapy. Cancer Metastasis Rev., 35:165–177, 2013.
- [13] M. Breton and L. M. Mir. Microsecond and nanosecond electric pulses in cancer treatments. Bioelectromagnetics, 33:106–123, 2012.
- [14] C. Jiang, R. V. Davalos, and J. C. Bischof. A review of basic to clinical studies of irreversible electroporation therapy. Trans. Biomed. Eng., 62:4–20, 2015.
- [15] S. K. Frandsen, M. B. Kruger, and U. M. Mangalanathan. Normal and malignant cells exhibit differential responses to calcium electroporation. Cancer Res., 2017. in press.
- [16] S. J. Beebe. Mechanisms of nanosecond pulsed electric field (nspef)-induced cell death in cells and tumors. J. Nanomed. Res., 2:1–5, 2015.
- [17] L. Chopinet and M.-P. Rols. Nanosecond electric pulses: a mini-review of the present state of the art. Bioelectrochem., 103:2–6, 2015.
- [18] A. G. Pakhomov, I. Semenov, S. Xiao, O. N. Pakhomova, B. Gregory, K. H. Schoenbach, J. C. Ullery, H. T. Beier, S. R. Rajulapati, and B. L. Ibey. Cancellation of cellular responses to nanoelectroporation by reversing the stimulus polarity. Cellular Mol. Life Sci., 71:4431–4441, 2014.
- [19] E. C. Gianulis, J. Lee, C. Jiang, S. Xiao, B. L. Ibey, and A. G. Pakhomv. Electroporation of mammalian cells by nanosecond electric field oscillations and its inhibition by the electric field reversal. Sci. Reports, 5:13818, 2015.
- [20] Z. Vasilkoski, A. T. Esser, T. R. Gowrishankar, and J. C. Weaver. Membrane electroporation: The absolute rate equation and nanosecond timescale pore creation. Phys. Rev. E, 74:021904, 2006.
- [21] I. G. Abidor, V. B. Arakelyan, L. V. Chernomordik, Yu. A. Chizmadzhev, V. F. Pastushenko, and M. R. Tarasevich. Electric breakdown of bilayer membranes: I. The main experimental facts and their qualitative discussion. Bioelectrochem. Bioenerget., 6:37–52, 1979.
- [22] J. C. Weaver and P. T. Vernier. Pore lifetimes in cell electroporation: complex dark pores? arXiv:1708.07478[physics.bio-ph], https://arxiv.org/abs/1708.07478 2017.
- [23] J. V. Stern, T. R. Gowrishankar, K. C. Smith, and J. C. Weaver. Broad pore lifetime distributions: a fundamental concept for cell electroporation. arXiv:1708.07613[physics.bio-ph], https://arxiv.org/abs/1708.07613 2017.
- [24] W. F. D. Bennett, N. Sapay, and D. P. Tieleman. Atomistic simulations of pore formation and closure in lipid bilayers. Biophysical J., 106:210–219, 2014.
- [25] Z. A. Levine and P. T. Vernier. Life cycle of an electropore: Field-dependent and field-independent steps in pore creation and annihilation. J. Memb. Biol., 236:27–36, 2010.
- [26] A. G. Pakhomov, E. Gianulis, P. T. Vernier, I. Semenov, S. Xiao, and O. Pakhomova. Multiple nanosecond electric pulses increase the number but not the size of long-lived nanopores in the cell membrane. Biochim. Biophys. Acta, 1848:958–966, 2015.
- [27] P. J. Canatella, J. F. Karr, J. A. Petros, and M. R. Prausnitz. Quantitative study of electroporation-mediated molecular uptake and cell viability. Biophysical J., 80:755–764, 2001.
- [28] A. G. Pakhomov, J. F. Kolb, J. A. White, R. P. Joshi, S. Ziao, and K. H. Schoenbach. Long-lasting membrane permeabilzation in mammalian cells by nanosecond pulsed electric field (nsPEF). Bioelectromagnetics., 28:655–663, 2007.
- [29] S. M. Kennedy, Z. Ji, J. C. Hedstrom, J. H. Booske, and S. C. Hagness. Quantitation of electroporation uptake kinetics and electric field heterogeneity effects in cells. Biophys. J., 94:5018–5027, 2008.
- [30] O. N. Pakhomova, B. W. Gregory, V. A. Khorokhorina, A. M. Bowman, S. Xiao, and A. G. Pakhomov. Electroporation-induced electrosensitization. PLoS ONE, 6:e17100, 2011.
- [31] K. C. Smith, R. S. Son, T. R. Gowrishankar, and J. C. Weaver. Emergence of a large pore subpopulation during electroporating pulses. Bioelectrochemistry, 100:3 – 10, 2014.
- [32] K. C. Smith and J. C. Weaver. Active mechanisms are needed to describe cell responses to submicrosecond, megavolt-per-meter pulses: Cell models for ultrashort pulses. Biophys. J., 95:1547–1563, 2008.
- [33] T. R. Gowrishankar, K. C. Smith, and J. C. Weaver. Transport-based biophysical system models of cells for quantitatively describing responses to electric fields. Proc IEEE, 101:505–517, 2013.
- [34] K. A. DeBruin and W. Krassowska. Modeling electroporation in a single cell: I. Effects of field strength and rest potential. Biophys. J., 77:1213–1224, 1999.
- [35] R. P. Joshi and K. H. Schoenbach. Bioelectric effects of intense ultrashort pulses. Crit. Rev. Biomed. Engr., 38:255–304, 2010.
- [36] J. Li and H. Lin. Numerical simulation of molecular uptake via electroporation. Bioelectrochemistry, 82:10–21, 2011.
- [37] M. M. Sadik, J. Li, J. W. Shan, D. I. Shreiber, and H. Lin. Quantification of propidium iodide delivery using millisecond electric pulses: Experiments. Biochim. Biophys. Acta, 1828:1322–1328, 2013.
- [38] J. T. Sengel and M. I. Wallace. Imaging the dynamics of individual electropores (Epub ahead of print). Proc. Nat. Acad. Sci., 113:5281–5286, 2016.
- [39] J. T. Sengel and M. I. Wallace. Measuring the potential energy barrier to lipid bilayer electroporation. Phil. Trans. Roy. Soc. B, 372:201602227, 2017.
 |
 |
 |
 |
| (a) | (b) | (c) |
 |
 |
 |
| (a) | (b) | (c) |
 |
 |
 |
| (a) | (b) | (c) |
 |
 |
 |
| (a) | (b) | (c) |
 |
 |
 |
| (d) | (e) | (f) |
 |
 |
 |
 |
| (a) | (b) | (c) | (d) |
 |
 |
 |
 |
| (e) | (f) | (g) | (h) |
 |
 |
 |
 |
| (a) | (b) | (c) | (d) |
 |
 |
 |
 |
| (e) | (f) | (g) | (h) |
 |
 |
 |
 |
| (a) | (b) | (c) | (d) |
 |
 |
 |
 |
| (e) | (f) | (g) | (h) |
| Symbol | Description | Value |
|---|---|---|
| r∗ | Pore radius at local energy maximum | 0.65 nm |
| B | Steric repulsion constant | 1.2610-19 J |
| b | Steric repulsion constant | 8.65 |
| C | Steric repulsion constant | -2.2110-20 J |
| Pore line tension | 210-11 J/m | |
| Membrane tension | 110-5 J/m2 | |
| Membrane electric force for =1 V | 6.910-10 N/V2 | |
| Electric force constant | 0.95 nm | |
| Electric force constant | 0.23 nm |