NNLO predictions for dijet production in diffractive DIS
Abstract:
Cross sections for inclusive dijet production in diffractive deep-inelastic scattering are calculated for the first time in next-to-next-to-leading order (NNLO) accuracy. These cross sections are compared to several HERA measurements published by the H1 and ZEUS collaborations. We computed the total cross sections, 49 single-differential and five double-differential distributions for six HERA measurements. The NNLO corrections are found to be large and positive. The normalization of the resulting predictions typically exceeds the data, while the kinematical shape of the data is described better at NNLO than at next-to-leading order (NLO). Our results use the currently available NLO diffractive parton distributions, and the discrepancy in normalization highlights the need for a consistent determination of these distributions at NNLO accuracy.
1 Introduction
Diffractive processes, , where the systems and are separated in rapidity, have been studied extensively at the electron-proton collider HERA [1, 2, 3, 4, 5, 6]. The forward system usually consists of the leading proton but can also contain its low mass dissociation. Between the systems and is a depleted region without any hadronic activity, the so-called large rapidity gap (LRG), which is a consequence of the vacuum quantum numbers of the diffractive exchange, often referred to as a pomeron (). Experimentally, the diffractive events can be selected either by requiring a rapidity region without any hadronic activity (LRG method) or by direct detection of the leading proton. In the second case, the system is free of any diffractive dissociation.
In analogy to the non-diffractive case, also in diffraction the parton distribution functions (PDFs) can be defined. According to the factorisation theorem [7] the diffractive cross section is then expressed as a convolution of these diffractive PDFs (DPDFs) and partonic cross sections of the hard subprocess which are calculable within perturbative QCD (pQCD). The DPDFs have properties similar to the PDFs, especially they obey the DGLAP evolution equation, but have an additional constraint on the presence of the leading proton in the final state.
The DPDFs are determined predominantly from inclusive diffractive deep-inelastic scattering (DDIS) cross sections with values of photon virtuality much higher than , such that the factorisation theorem is valid. In this way also the most commonly used DPDFs, H1 2006 Fit B [8] were extracted. The DPDFs are applicable to predict cross sections of other, more exclusive processes. The most prominent one is inclusive dijet production in DDIS, where at least two jets are produced, mainly via boson-gluon fusion mechanism. Since the gluonic component of DPDFs is weakly constrained from inclusive DDIS data alone also dijet data are sometimes considered in their determinations [4, 9].
The pQCD predictions depend on the unphysical renormalisation and factorisation scales. In inclusive DIS these scales are typically identified with the photon virtuality and the cross section scale uncertainties are quite small. On the contrary, the dijet production is a multi-scale process, where the presence of another hard scale, given for instance by the jet transverse momenta, makes a sensible scale choice much more complex. The scale uncertainties of the cross section are typically much larger and represent the main theoretical uncertainty. Therefore, the higher-order perturbative predictions, which reduce scale-dependence, are of the vital importance.
Up to now, the measured dijet data were typically compared to the next-to-leading (NLO) QCD predictions which were within large theoretical uncertainties able to describe the measured cross sections satisfactorily, both in shape and normalization. However, since these predictions were about two times higher than the leading-order (LO) one, there was a natural question concerning the size of contributions from even higher orders. To address this issue, we present the next-to-next-to-leading (NNLO) perturbative QCD calculations. These calculations are performed for the first time. We compare our predictions with several single-, double-differential and total cross sections from six distinct measurements published by the H1 or ZEUS. We further study the scale dependence of the NNLO predictions and investigate different DPDFs parametrisations.
2 Variable definition
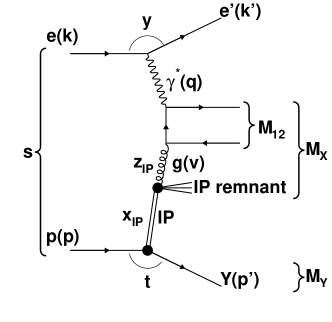
Dijet cross sections are studied differentially in several kinematic variables, which also constrain the phase space of the measurements. Their meaning is described in Fig. 1. The jets were always identified using the -algorithm in the frame with the parameter . The collaborations measured jet properties, like transverse momenta and pseudo-rapidities of the jets, either in or in the laboratory frame. In almost all analyses the diffractive variables and , where is the relative energy loss of the beam proton caused by the diffractive scattering, and which is interpreted as the momentum fraction of the parton entering the hard subprocess with respect to the diffractive exchange (pomeron), were measured. The exact definitions of these variables can be found in [3].
3 NNLO calculations
Our theoretical NNLO QCD predictions for dijet production in DDIS are calculated using the program NNLO JET and are based on antenna subtraction method [10, 11]. In this way the infrared divergences from real-real, real-virtual and virtual-virtual contribution are correctly handled using local subtraction terms. The NNLO calculations were recently successfully used for predictions of jet cross sections in non-diffractive DIS [12]. The NLO 2jet and 3jet cross sections were verified against Sherpa [13] and NLOJET++ [14].
In order to compare the data with fixed-order predictions, correction factors to account for hadronisation effects have to be applied and these are provided for 5 out of the 6 analysed measurements by the collaborations. These factors are not provided to us in case of ref. [6] and we use the unity factor instead.
As the NNLO calculations are very computation-time consuming (more than 100,000 CPU hours) we are using the fastNLO framework [15] to perform the final convolution of the hard subprocess cross section with the DPDFs and . The advantage of this approach is that the computationally intense calculation of the hard-process cross sections for values of , and is performed only once. Subsequent to that the partonic cross sections can be easily convoluted with different DPDFs and values. This approach is especially beneficial for performing PDF fits or fits of the strong coupling constant. Note, that for historical reasons the program is called fastNLO although the idea behind is rather general and can be applied to all orders.
For the diffractive processes, the convolution of DPDFs and the partonic cross sections is more complicated as in case of non-diffractive DIS, since the DPDFs depends on , and 111We integrated out an additional dependence on . Therefore, for a given , one needs to perform an additional convolution over , in general from to 1, but due to the range of the given measurement the resulting range of the integration is smaller (mostly ). This method has been found to be equivalent to the commonly used slicing method [5, 3].
4 Results
In total we computed the NNLO cross sections for the six HERA measurements. In plots they are labeled as: ”H1 (HERA \@slowromancapii@) FPS” [1], ”H1 (HERA \@slowromancapii@) VFPS” [2], ”H1 (HERA \@slowromancapii@) LRG” [3], ”H1 (HERA \@slowromancapi@) LRG” [4], ”H1 (HERA \@slowromancapi@) LRG, 820GeV” [5], ”ZEUS (HERA \@slowromancapi@) LRG” [6]. Five of them are performed with proton beam energy of 920 GeV, one of them with 820 GeV. The electron beam energy is always 27.6 GeV. In two cases the leading proton is identified by the Forward Proton Spectrometer (FPS) [1] or Very Forward Proton Spectrometer (VFPS) [2], otherwise the diffractive events are selected using the LRG method. The phase space definitions are found in the corresponding publications.
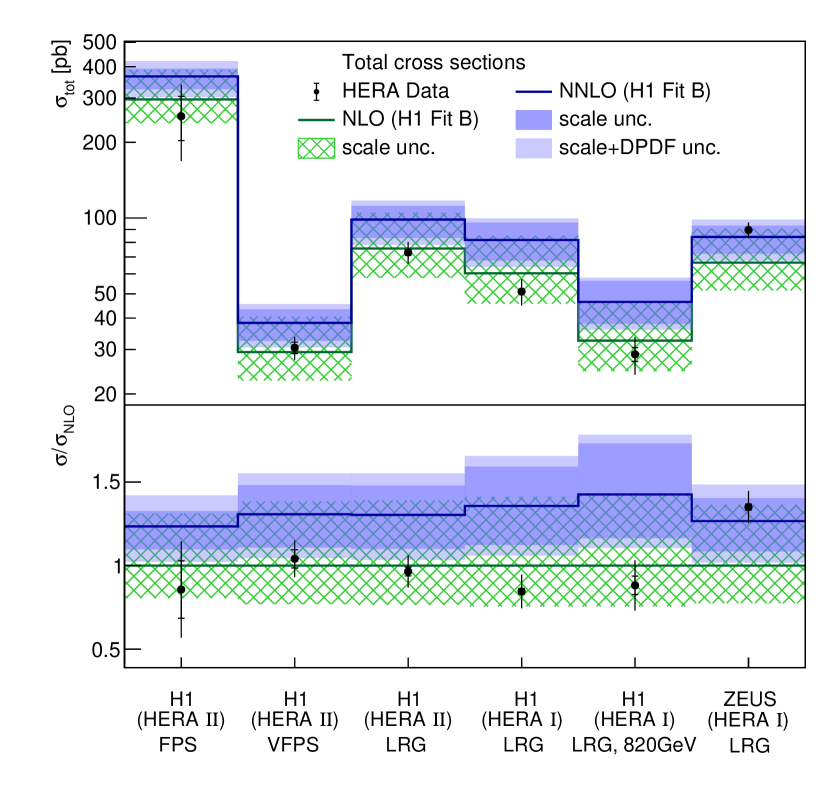
First, we present the results for total cross sections in the left plot of Fig. 2 and compare to measurements and previously employed NLO calculations . The NNLO predictions are higher than the NLO predictions and data (with the exception of ZEUS measurement) by about 30%. As found previously [1, 2, 3, 4, 5, 6], the NLO predictions are mainly in good agreement with data. The scale uncertainties, obtained by simultaneous variation of the renormalisation and factorisation scale by a factor of and , are found to be somewhat reduced for NNLO predictions as compared to NLO.
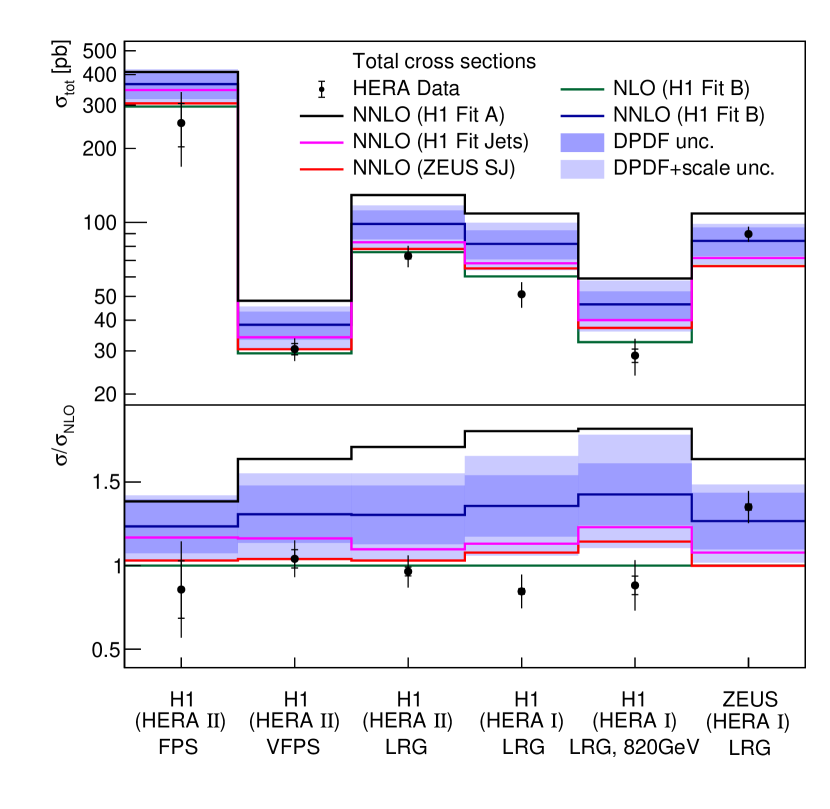
In Fig. 2 (right) we study the dependence of the total cross sections on the DPFS, using H1 2006 Fit A [8], H1 2006 Fit B [8], H1 2007 Fit Jets [4] and ZEUS SJ [9]. The NNLO prediction mainly overshoot the data also for different DPDFs. However, it is observed that the DPDFs considering also dijet data in their determination [4, 9] give smaller predictions than the inclusive-only fits. The differences between the predictions are mostly covered by the DPDF uncertainties of the H1 2006 Fit B. The DPDF H1 2006 Fit A [8], which considers only inclusive data in its determation, appears to overestimate the gluon component significantly.
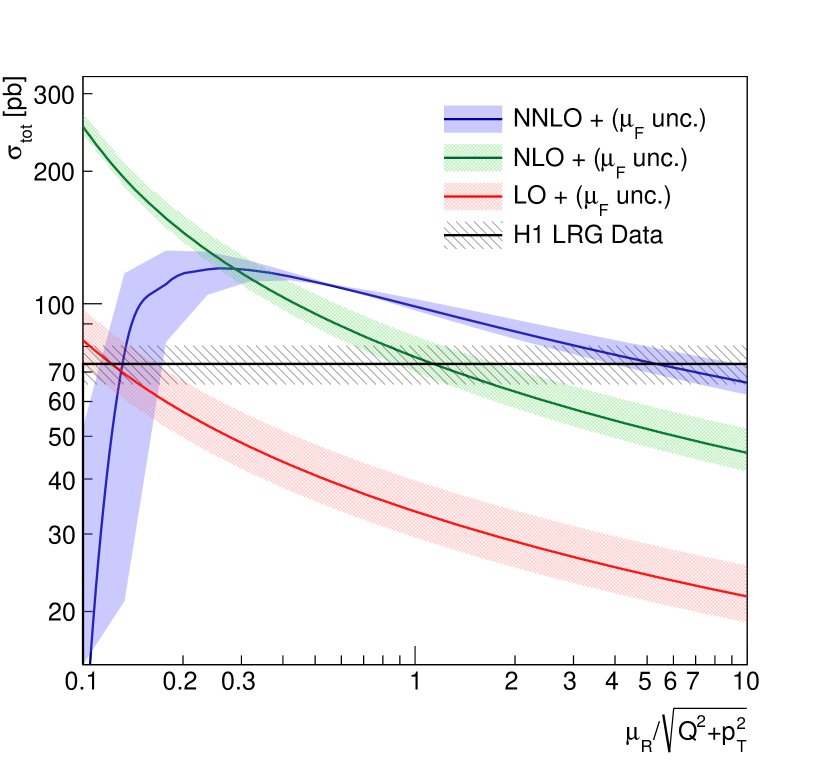
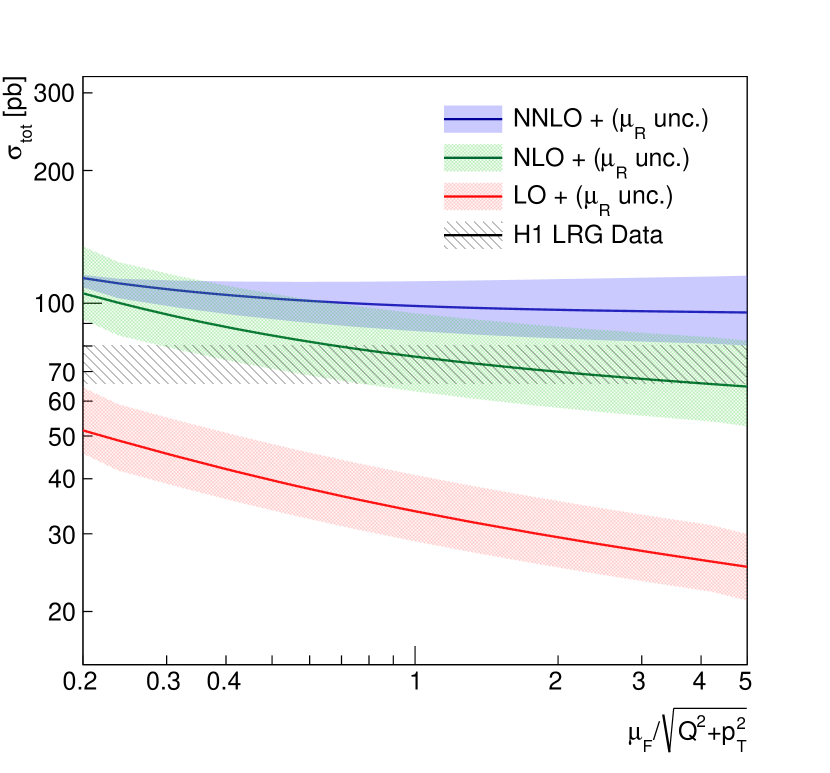
We study the dependence of the total cross section on the renormalisation and factorisation scales and for the H1 LRG phase space in Fig. 3 (left). The nominal value of the scales is , where denotes the average transverse momentum of the leading and sub-leading jet. In the left plot we varied by factors between and , while was fixed to its nominal value. The effect of the variation of is displayed by an error band corresponding to a variation by factors of and . Fig. 3 (right) shows the same but with and swapped. The NNLO cross sections are found to be less dependent on scale variations as compared to LO or NLO prediction. The prediction exceeds the H1 HERA \@slowromancapii@ data for a wide range of the scale factors.
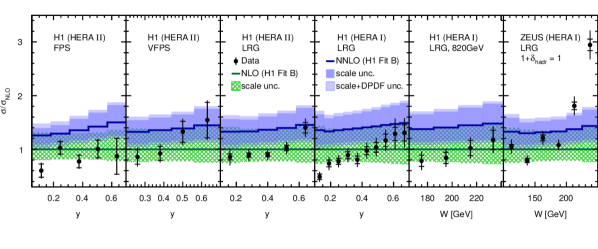
In total we computed 57 differential distributions. Fig. 4 shows the distributions for inelasticity , and normalised to the respective NLO predictions. For , which is related to the centre-of-mass energy , the NNLO predictions provide an improved description of the shape as compared to NLO, while still being too high in normalisation.
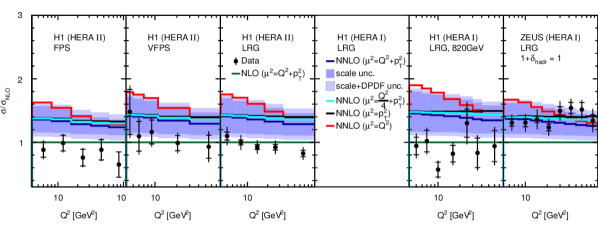
Together with distributions the predictions for various functional forms of the hard scale are displayed in addition. We use . The prescriptions containing mean of the dijets , and give all similar results, whereas the scale choice results in higher cross sections and a steeper spectrum. However, all these scale choices are covered by the scale uncertainty.
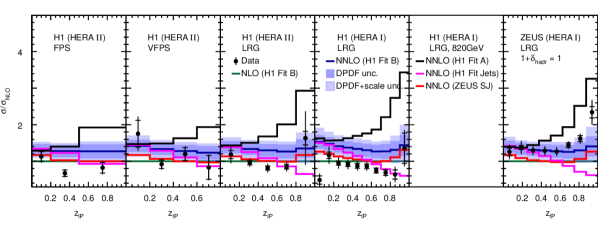
The bottom pad of Fig. 4 shows the variable which represents in leading order approximation one of the DPDF arguments. The NNLO predictions exceed the data for most of the measurements. The H1 2006 Fit A overestimates the cross section for higher values significantly whereas the H1 2007 Fit Jet DPDFs gives the smallest cross section. The remaining two DPDFs (H1 2006 Fit B and ZEUS SJ) behave quite similar. There is an indication that the NNLO predictions describe data distributions better in shape, in particular, we found that for every DPDF and every studied scale functional form the NNLO predictions on average gives lower than NLO predictions.
5 Conclusions
We present the first NNLO QCD predictions for diffractive jet production processes. These were calculated for dijet production in diffractive DIS and were confronted to six measurements by H1 or ZEUS. We observe that the NNLO cross sections are typically significantly higher than the data and are about higher than NLO calculations. Since no DPDFs in NNLO accuracy exist, only available NLO DPDFs were used for the calculations which may already explain the discrepancy between the NNLO predictions and data. The NNLO predictions exceed the data also for all DPDFs studied. However, the shapes of the differential distributions are typically better described by NNLO predictions, which was quantified by -calculations. The NNLO predictions provide a reasonable description of the ZEUS data, while, however, these are in general found to be higher than the five H1 measruementes and no hadronisation corrections are available to us. We believe that the normalisation difference between data and NNLO predictions could be explained by the inconsistent order of the employed NLO DPDFs, and new DPDFs in NNLO accuracy, including dijet data for their determinations, would be highly recommended.
References
- [1] H1 collaboration, F. D. Aaron et al., Measurement of Dijet Production in Diffractive Deep-Inelastic Scattering with a Leading Proton at HERA, Eur. Phys. J. C72 (2012) 1970, [1111.0584].
- [2] H1 collaboration, V. Andreev et al., Diffractive Dijet Production with a Leading Proton in Collisions at HERA, JHEP 05 (2015) 056, [1502.01683].
- [3] H1 collaboration, V. Andreev et al., Measurement of Dijet Production in Diffractive Deep-Inelastic ep Scattering at HERA, JHEP 03 (2015) 092, [1412.0928].
- [4] H1 collaboration, A. Aktas et al., Dijet Cross Sections and Parton Densities in Diffractive DIS at HERA, JHEP 10 (2007) 042, [0708.3217].
- [5] H1 collaboration, A. Aktas et al., Tests of QCD factorisation in the diffractive production of dijets in deep-inelastic scattering and photoproduction at HERA, Eur. Phys. J. C51 (2007) 549–568, [hep-ex/0703022].
- [6] ZEUS collaboration, S. Chekanov et al., Dijet production in diffractive deep inelastic scattering at HERA, Eur. Phys. J. C52 (2007) 813–832, [0708.1415].
- [7] J. C. Collins, Proof of factorization for diffractive hard scattering, Phys. Rev. D57 (1998) 3051–3056, [hep-ph/9709499].
- [8] H1 collaboration, A. Aktas et al., Measurement and QCD analysis of the diffractive deep-inelastic scattering cross-section at HERA, Eur. Phys. J. C48 (2006) 715–748, [hep-ex/0606004].
- [9] ZEUS collaboration, S. Chekanov et al., A QCD analysis of ZEUS diffractive data, Nucl. Phys. B831 (2010) 1–25, [0911.4119].
- [10] J. Currie, T. Gehrmann and J. Niehues, Precise QCD predictions for the production of dijet final states in deep inelastic scattering, Phys. Rev. Lett. 117 (2016) 042001, [1606.03991].
- [11] J. Currie, T. Gehrmann, A. Huss and J. Niehues, NNLO QCD corrections to jet production in deep inelastic scattering, JHEP 07 (2017) 018, [1703.05977].
- [12] H1 collaboration, V. Andreev et al., Measurement of Jet Production Cross Sections in Deep-inelastic ep Scattering at HERA, Eur. Phys. J. C77 (2017) 215, [1611.03421].
- [13] T. Gleisberg, S. Hoeche, F. Krauss, M. Schonherr, S. Schumann, F. Siegert et al., Event generation with SHERPA 1.1, JHEP 02 (2009) 007, [0811.4622].
- [14] Z. Nagy, Next-to-leading order calculation of three jet observables in hadron hadron collision, Phys. Rev. D68 (2003) 094002, [hep-ph/0307268].
- [15] fastNLO collaboration, D. Britzger, K. Rabbertz, F. Stober and M. Wobisch, New features in version 2 of the fastNLO project, in Proceedings, 20th International Workshop on Deep-Inelastic Scattering and Related Subjects (DIS 2012): Bonn, Germany, March 26-30, 2012, pp. 217–221, 2012, 1208.3641, DOI.