Flow of deformable droplets: discontinuous shear thinning and velocity oscillations
Abstract
We study the rheology of a suspension of soft deformable droplets subjected to a pressure-driven flow. Through computer simulations, we measure the apparent viscosity as a function of droplet concentration and pressure gradient, and provide evidence of a discontinuous shear thinning behaviour, which occurs at a concentration-dependent value of the forcing. We further show that this response is associated with a nonequilibrium transition between a ‘hard’ (or less deformable) phase, which is nearly jammed and flows very slowly, and a ‘soft’ (or more deformable) phase, which flows much more easily. The soft phase is characterised by flow-induced time dependent shape deformations and internal currents, which are virtually absent in the hard phase. Close to the transition, we find sustained oscillations in both the droplet and fluid velocities. Polydisperse systems show similar phenomenology but with a smoother transition, and less regular oscillations.
Concentrated suspensions of colloidal particles in a liquid solvent are often found in industry and nature. Familiar examples include paint, ink, food like mayonnaise and ice cream, and biological fluids such as blood Jones . The flow properties of colloidal suspensions can be distinctively non-trivial: for example, a suspension of colloidal spheres in water first exhibits shear thinning and then shear thickening, as the external forcing (pressure gradient or shear) is increased Jones ; jamming_rheology_Cates ; Rheol_studies_2 ; PRL_Guy_shear_thickening ; DST_Cates . In dense suspensions, the fact that shear thickening can be discontinuous has recently attracted a lot of attention: this behaviour marks a transition between a lubrication-dominated and a frictional flow regime DST_Cates .
Often, in such colloidal fluids, the dispersed particles are not hard, but soft, and deformable RBC_Pagonabarraga . Examples are the fat droplets found in milk, or eukaryotic cells: all these can deform under flow, or when subjected to a mechanical stress. While hard sphere fluids have been studied extensively, and provide the basis for our understanding of the glass transition Glass_transition_Cates ; Glass_transition_Weeks ; Glass_Pusey and of soft glassy rheology Glassy_material_Cates_Fielding , less is known about the flow response of suspensions of deformable particles RBC_Pagonabarraga ; AIP_droplets ; AIP_droplets_2 ; Droplets_shear_Loewenberg ; Droplets_extensional_shear_Zinchenko ; Droplets_extensional_shear_Zinchenko2 . Nonetheless, there is a number of examples suggesting that the physics of soft suspensions is both highly interesting and important in applications. For example, experiments and simulations have recently demonstrated that glass transitions and jamming can be observed in dense monolayers of living cellsGlassy_tissue_expt_manning ; Glassy_cells_expt_angelini ; MotilityDrive_jamming_manning ; Glass_Chiang . Emulsions – which are dispersion of liquid droplets in a continuous medium – are also used in medicine and food, and their flow properties play a pivotal role in applications. Particle deformability is important to determine the rheology of a material: for example, emulsions and foams do not normally display shear thickening, unlike hard sphere colloidal fluids.
Here, we use 2D lattice Boltzmann simulations to investigate the dynamics of a suspension of soft, and non-coalescing, droplets (Figs. 1a,b) under pressure-driven flow within a channel. Two key parameters determine the flow response of our system: (i) the concentration, , defined as the ratio between the area of all droplets and the total area of the simulation domain, and (ii) the applied pressure difference driving the flow. We calculate the apparent viscosity, , of the suspension as a function of and – this is the focus of the current paper, in contrast to previous numerical works on droplet rheology AIP_droplets ; AIP_droplets_2 ; Droplets_shear_Loewenberg ; Droplets_extensional_shear_Zinchenko . As expected, we find that, for a fixed , increases sharply with , as droplets approach jamming. The behaviour of with is more surprising, and constitutes our central result: if the concentration is large enough, we find shows discontinuous shear thinning rheology. This non-Newtonian behaviour signals a nonequilibrium (flow-induced) transition between a ‘hard’ (or less deformable) phase, where the flow does not appreciably affect droplet shape, and a ‘soft’ (or more deformable) phase, where the droplets deform substantially, in a time-dependent fashion . Close to the transition, we find strong and sustained oscillations in the velocity of the droplets (or of the underlying fluid). These oscillations are strikingly similar to those observed for hard colloidal particles under Poiseuille flow velocity_oscillations . In our case, the underlying mechanism is the proximity to the discontinuous shear-thinning transition, which leads to unabating hopping between the hard and soft viscosity branches. Discontinuous shear thinning and oscillations are more easily seen in a monodisperse suspension: in a binary system with droplets of two different sizes the transition is much smoother, more akin to a crossover. To study the hydrodynamics of our soft droplet fluid, we follow the evolution of: (i) phase-field variables describing the density of each of the droplets, , , where is the total number of droplets, and (ii) the velocity field of the underlying solvent . The equilibrium behaviour is governed by the following free energy density,
| (1) |
In Eq. 1, the first two terms ensure that each droplet is stable, as, for every , inside the -th droplet, and otherwise; these two terms also determine the surface tension of each of the droplets as and their interfacial thickness as LB_Pagonabarraga . The third, final term describes soft repulsion pushing droplets apart when they overlap: controls the strength of this repulsion.
The dynamics of the compositional order parameters evolve according to a set of Cahn-Hilliard-like equations,
| (2) |
where is the mobility and is the chemical potential of the -th droplet. Eq. 2 conserves the area of each of the droplets (i.e., the integral of each over the whole simulation domain).
The solvent flow obeys the Navier-Stokes equation,
| (3) |
where indicates the fluid density, denotes its pressure and the solvent viscosity. The term represents the internal forces due to the presence of non-trivial compositional order parameters, and as such it can also be expressed as a divergence of a stress tensor Binary_Cates . In what follows, we report results from hybrid lattice Boltzmann (LB) simulations LB_method ; HybridLB_Gonnella where Eq. 3 is solved by an LB algorithm, and Eqs. 2 are solved via a finite difference. We consider flow in a channel with no-slip boundary conditions at the top and bottom walls. The flow is driven by a fixed, externally imposed pressure difference, leading to Poiseuille flow in an isotropic fluid, and neutral wetting boundary conditions for each of the droplets Neutral_wetting_Gonnella (see SI). Parameters used are listed in the SI, together with Reynolds and capillary numbers, and values of in what follows are given in simulation units. While the trends we discuss are generic, the simulations we report can be mapped to a system with m-size droplets whose surface tension is mN/m (see SI), embedded in a background Newtonian fluid with viscosity cP. Our model differs from that used in Succi_LB to study the glassy dynamics of foams and sprays, which in general allows for droplet coalescence.
Figure 1 shows two typical snapshots of our system, under weak pressure-driven flow and for two different values of . These snapshots clarify that, when is low, we obtain a suspension of well-separated droplets: while these droplets interact hydrodynamically and may in principle deform, there is a substantial region between them occupied by the background solvent (Fig. 1a). At larger concentrations, droplets touch each other even in the absence of flow, to form a percolating foam (Fig. 1b). The snapshots also highlight that the neutral wetting boundary conditions we use lead to spreading on droplets close to the wall, with a contact angle of . We note that droplets need to approach the wall close enough in order to stick: this only happens for above .
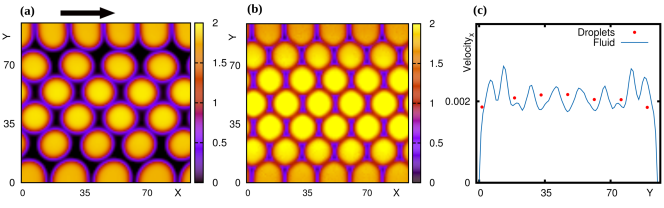
We start by analysing the flow profile. To do so, we plot the average velocity along (the velocity direction) as a function of (the velocity gradient direction). While for low the profile is approximately parabolic (SI, Fig. S1), the flow becomes plug-like at higher (see Fig. 1c). We note that the velocity of the droplets remains close to that of the fluid throughout the channel.
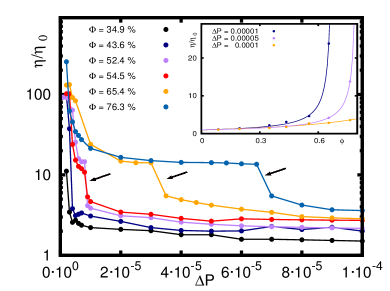
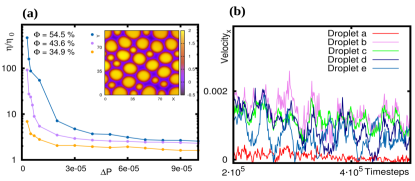
Pressure-driven flow in these suspensions is therefore strongly non-Newtonian, at least for foam-like structures with large . We can nevertheless define, as in experiments, an apparent viscosity, , by analysing the throughput flow =. A useful quantity is the ratio between and the throughput flow of a Newtonian fluid with viscosity , that of the underlying solvent (when no droplets are present). The inverse of this ratio gives a measure of . A plot of as a function of for a given value of (Fig.2, inset) shows that viscosity increases sharply and non-linearly with , which is suggestive of jamming as the droplet concentration increases Jamming_Nagel ; Review_Glass_Jamming_Ikeda . Our current data, though, do not allow us to conclude whether, for small , there is a linear regime with a finite albeit large viscosity at any , or whether for above a critical , as in jammed granular flow Jamming_Nagel ; Review_Glass_Jamming_Ikeda .
In Figure 2 we focus instead on the variation of with pressure difference, at fixed . For all concentrations, we find strong shear thinning. This behaviour resembles that seen in experiments probing the rheology of emulsions and foams. Remarkably, though, for we find this shear thinning behaviour to be “discontinuous”: in other words, there is a jump in the viscosity for a critical value of the forcing (arrows in Fig. 2), signalling a possible flow-induced nonequilibrium transition. This behaviour contrasts with the smooth (or continuous) shear thinning found in hard colloidal dispersions at intermediate shear rates Jones , or in previous simulations of droplet emulsions under shear AIP_droplets ; Droplets_shear_Loewenberg ; Droplets_extensional_shear_Zinchenko . Discontinuous shear thinning is observed for and , with the jump occurring for larger pressure differences as increases (the trend is approximately linear, see SI, Fig. S3). A viscosity jump is also present for larger system size than in Figure 2 (Fig. S4), while it is absent for non-wetting boundary conditions (Fig. S5).
For sufficiently large , therefore, we can define two viscosity branches, lying either side of the discontinuity. To identify the difference between the left and right viscosity branches, we first characterise how the flow affects droplet shape (Figs. 3a,b). To do so, we compute the semiaxes of the ellipse defined by the inertial tensor of each droplet Gyration (see SI) The results point to a clear difference: on the left (high viscosity) branch, the droplet shape is constant over time (Fig. 3a, and SI SI , Suppl. Movie 1); on the right (low viscosity) branch, there are more significant deformations, and, importantly, these display marked variations over time (Fig. 3b, and SI, Fig. S2 and Suppl. Movie 2). We therefore name the left branch ‘hard’, and the right branch ‘soft’. We conclude that the discontinuity in the apparent viscosity shown in Fig.2 can be interpreted as a transition (or sharp crossover) between a hard phase, where the droplets are effectively rigid, and a soft one, where they are highly deformable.
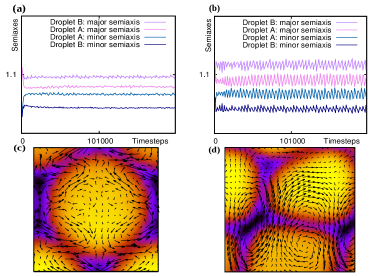
The hard and soft branches also differ in the flow patterns observed in the steady state. When the average flow along is subtracted out, the residual flow is mainly limited to gaps between droplets in the hard branch (Fig. 3c), whereas it penetrates more deeply within the droplet interior in the soft branch (Fig. 3d). The larger internal flow in the soft phase arises mainly due to interaction between neighbouring lanes of droplets, and is therefore maximal close to the boundary, where the wetting layer of droplets leads to the largest effective friction with the rest of the suspension.
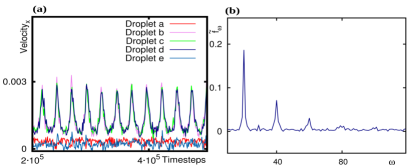
Closer inspection of the simulation results reveal a further intriguing phenomenon. Consider for example a suspension with , for – i.e., just after the drop in viscosity in Fig. 2 (the corresponding dynamics is shown in SI, Suppl. Movie 3). As the flow sets in, the droplets that are initially close to the boundary (droplets a and e in Fig. 4a) stick to the wall and slow down dramatically, while those close to the centre (droplets b, c, and d) undergo a ‘stick-slip’ motion whereby they periodically accelerate and decelerate. The oscillations are visually clear when tracking droplet velocity over time (Fig. 4a); Fourier transforming these data shows they are also very regular (Fig. 4b).
Oscillations also occur for other values of and , and for larger system size (see SI, Fig. S4 and Table S1): notably, the region in phase space where they do is, in all cases, close to the discontinuity in the viscosity curve. This is reasonable, as we expect that near the discontinuous shear thinning transition there should be hysteresis – similarly to what happens next to a thermodynamic first-order transition. Consequently the suspension can hop between the hard and soft viscosity branches, giving rise to oscillations. An analysis of Suppl. Movie 3 additionally suggests that oscillations correlate well with deformations arising from contact interactions between the wetting layer and the nearest lane of droplets. Thus, each droplet in that array slows down when it first touches one of the droplets in the wetting layer, while it squeezes faster through the gap once it is deformed. This latter microscopic mechanism is consistent with the former explanation that oscillations require proximity to the hard-to-soft transition, because shape deformations – which play a key role in the microscopic argument – define the soft phase. Consistently with these arguments, we observe no transition, and no oscillations, with non-wetting boundary conditions (see SI, Suppl. Movie 4, for a typical example of flow at high without droplet deformation). The droplet velocity oscillations we observe are qualitatively similar to those found in driven colloidal suspensions close to the glass transition velocity_oscillations , as those, too, correlate well with the gap between flowing and boundary colloids. It would be of interest to ask whether even for the colloidal case oscillations arise close to the discontinuous (shear thickening) transition.
The suspension we have considered up to this point has been monodisperse – all droplets had the same size. Polydispersity is known to strongly affect the behaviour of colloidal systems, for instance in so far as the glass transition is concerned Glass_Pusey . To explore the effect of polydispersity on discontinuous shear thinning in a selected case, we show in Figure 5a the viscosity curves of a bidisperse suspension (where the droplet radius of one component is twice as large as that of the other). While the suspension still clearly shear thins, with a comparable overall drop in viscosity with respect to the monodisperse case, here no discontinuity can be found, apart from the case of . For this concentration, we find again oscillations (Fig. 5b), however these are much more irregular than in the monodisperse case. These findings suggest that a sufficiently strong polydispersity smooths out the nonequilibrium transition between the hard and soft phases, turning it into a crossover. The reason is that larger droplets start to deform at a weaker forcing than smaller ones, hence the transition occurs more gradually with respect to the monodisperse case.
In summary, we have shown that the rheology of a suspension of deformable non-coalescing droplets, under a pressure-driven flow entails discontinuous shear thinning behaviour. This discontinuity may be viewed as a nonequilibrium transition between a hard droplet regime, which flows slowly, and a soft droplet phase, which flows much more readily. In the former phase, droplet shape is constant over time; in the latter, it varies significantly as they flow. To observe discontinuous shear thicknening, we need large enough concentration, . At a given value of , our physical interpretation of the soft-to-hard transition suggests that a key dimensionless parameter is the capillary number AIP_droplets ; AIP_droplets_2 ; Droplets_shear_Loewenberg ; Droplets_extensional_shear_Zinchenko denoting the ratio between external forcing and interfacial tension. Close to the transition, we find sustained oscillations which are reminiscent of those reported previously for hard colloidal systems close to the glass transition velocity_oscillations . It is tempting to speculate that in both cases oscillations arise due to proximity to a discontinuous transition.
In the future, it would be interesting to recreate discontinuous shear thinning in the lab, by studying the rheology of suspensions of non-coalescing droplets Pastes_Cloitre . Theoretically, our findings prompt new questions. For instance, it would be useful to characterise the dependence of the hard-to-soft transition on surface tension. It would also be informative to study the microrheology Microrheology_Cloitre of our droplet suspensions and see what signatures discontinuous shear thinning leaves there.
Acknowledgements:
We thank ERC (COLLDENSE network) and EPSRC (EP/N019180/1) for support.
References
- [1] R. A. L. Jones. Soft Condensed Matter. Oxford University Press, 2002.
- [2] C. B. Holmes, M. Fuchs, and M. E. Cates. Jamming transitions in a schematic model of suspension rheology. Europhysics Letters, 63(2):240–246, 2003.
- [3] P. Sollich, F. Lequeux, P. Hébraud, and M. E. Cates. Rheology of soft glassy materials. Phys. Rev. Lett., 78:2020–2023, 1997.
- [4] N. Y. C. Lin, B. M. Guy, M. Hermes, C. Ness, J. Sun, W. C. K. Poon, and I. Cohen. Hydrodynamic and contact contributions to continuous shear thickening in colloidal suspensions. Phys. Rev. Lett., 115:228304, 2015.
- [5] M. Wyart and M. E. Cates. Discontinuous shear thickening without inertia in dense non-brownian suspensions. Phys. Rev. Lett., 112:098302, 2014.
- [6] G. R. Lazaro, A. Hernandez-Machado, and I. Pagonabarraga. Rheology of red blood cells under flow in highly confined microchannels: I. effect of elasticity. Soft Matter, 10:7195–7206, 2014.
- [7] C B Holmes, M E Cates, M Fuchs, and P Sollich. Glass transitions and shear thickening suspension rheology. J. Rheol., 49(1):237 – 269, 2005.
- [8] G. L. Hunter and E. R. Weeks. The physics of the colloidal glass transition. Reports on Progress in Physics, 75(6):066501, 2012.
- [9] P. N. Pusey, E. Zaccarelli, C. Valeriani, E. Sanz, W. C. K. Poon, and M. E. Cates. Hard spheres: crystallization and glass formation. Phil. Trans. R. Soc. A, 367:4993–5011, 2009.
- [10] S. M. Fielding, M. E. Cates, and P. Sollich. Shear banding, aging and noise dynamics in soft glassy materials. Soft Matter, 5:2378–2382, 2009.
- [11] H. Zhou and C. Pozrikidis. Pressure-driven flow of suspension of liquid drops. Phys. Fluids, 6:80, 1994.
- [12] A. Nourbakhsh, S. Mortazavi, and Y. Afshar. Three-dimensional numerical simulation of drops suspended in poiseuille flow at non-zero reynolds numbers. Phys. Fluids, 23:123303, 2011.
- [13] M. Loewenberg and E. J. Hinch. Numerical simulation of a concentrated emulsion in shear flow. J. Fluid Mech., 321:395–419, 1996.
- [14] A. Z. Zinchenko and R. H. Davis. Extensional and shear flows, and general rheology of concentrated emulsions of deformable drops. J. Fluid Mech., 779:197–244, 2015.
- [15] A. Z. Zinchenko and R. H. Davis. General rheology of highly concentrated emulsions with insoluble surfactant. J. Fluid Mech., 816:661–704, 2017.
- [16] E. M. Schotz, M. Lanio, J. A. Talbot, and M. L. Manning. Glassy dynamics in three-dimensional embryonic tissues. J. Roy. Soc. Interface, 10:20130726, 2013.
- [17] T. E. Angelini, E. Hannezo, X. Trepat, M. Marquez, J. J. Fredberg, and D. A. Weitz. Glass-like dynamics of collective cell migration. Proc. Natl. Acad. Sci. USA, 108:4714–4719, 2011.
- [18] Dapeng Bi, Xingbo Yang, M. Cristina Marchetti, and M. Lisa Manning. Motility-driven glass and jamming transitions in biological tissues. Phys. Rev. X, 6:021011, Apr 2016.
- [19] M. Chiang and D. Marenduzzo. Glass transitions in the cellular potts model. EPL, 116(2):28009, 2016.
- [20] L. Isa, R. Besseling, A. N. Morozov, and W. C. K. Poon. Velocity oscillations in microfluidic flows of concentrated colloidal suspensions. Phys. Rev. Lett., 102:058302, 2009.
- [21] I. Pagonabarraga, A. J. Wagner, and M. E. Cates. Binary fluid demixing: the crossover region. J. Stat. Phys., 107:39, 2002.
- [22] M. E. Cates, J. Vollmer, A. Wagner, and D. Vollmer. Phase separation in binary fluid mixtures with continuously ramped temperature. Philosophical Transactions of the Royal Society of London A: Mathematical, Physical and Engineering Sciences, 361(1805):793–807, 2003.
- [23] Michael R. Swift, E. Orlandini, W. R. Osborn, and J. M. Yeomans. Lattice boltzmann simulations of liquid-gas and binary fluid systems. Phys. Rev. E, 54:5041–5052, 1996.
- [24] A. Tiribocchi, N. Stella, G. Gonnella, and A. Lamura. Hybrid lattice boltzmann model for binary fluid mixtures. Phys. Rev. E, 80:026701, 2009.
- [25] G Gonnella, A Lamura, and A Piscitelli. Dynamics of binary mixtures in inhomogeneous temperatures. Journal of Physics A: Mathematical and Theoretical, 41(10):105001, 2008.
- [26] G. Falcucci, S. Chibbaro, S. Succi, X. Shan, and H. Chen. Lattice boltzmann spray-like fluids. EPL (Europhysics Letters), 82(2):24005, 2008.
- [27] C. S. O’Hern, L. E. Silbert, A. J. Liu, and S. R. Nagel. Jamming at zero temperature and zero applied stress: The epitome of disorder. Phys. Rev. E, 68:011306, 2003.
- [28] A. Ikeda, L. Berthier, and P. Sollich. Disentangling glass and jamming physics in the rheology of soft materials. Soft Matter, 9:7669–7683, 2013.
- [29] A. Tiribocchi, M. Da Re, D. Marenduzzo, and E. Orlandini. Shear dynamics of an inverted nematic emulsion. Soft Matter, 12:8195–8213, 2016.
- [30] See Supplemental Material for more details on simulations, and for additional results, Supplementary Figures and Movies. The Supplementary Material also includes Refs. [31, 32, 33, 34, 35, 36].
- [31] Zhengdong Cheng, Jixiang Zhu, Paul M. Chaikin, See-Eng Phan, and William B. Russel. Nature of the divergence in low shear viscosity of colloidal hard-sphere dispersions. Phys. Rev. E, 65:041405, 2002.
- [32] N. Yoshinaga. Spontaneous motion and deformation of a self-propelled droplet. Phys. Rev. E, 89:012913, 2014.
- [33] A. Tiribocchi, N. Stella, G. Gonnella, and A. Lamura. Hybrid lattice boltzmann model for binary fluid mixtures. Phys. Rev. E, 80:026701, 2009.
- [34] Colin Denniston, Enzo Orlandini, and J. M. Yeomans. Lattice boltzmann simulations of liquid crystal hydrodynamics. Phys. Rev. E, 63:056702, 2001.
- [35] A. J. Wagner. The origin of spurious velocities in lattice boltzmann. Int. J. Mod. Phys. B, 17:193–196, 2003.
- [36] E. Tjhung, A. Tiribocchi, D. Marenduzzo, and M. E. Cates. A minimal physical model captures the shapes of crawling cells. Nat. Comm., 6:5420, 2015.
- [37] M. Cloitre, R. Borrega, F. Monti, and L. Leibler. Glassy dynamics and flow properties of soft colloidal pastes. Phys. Rev. Lett., 90:068303, 2003.
- [38] L. Mohan, M. Cloitre, and R. T. Bonnecaze. Active microrheology of soft particles. J. Rheol., 58:1465–1482, 2014.