Dust concentration and emission in protoplanetary disks vortices
Abstract
We study the dust concentration and emission in protoplanetary disks vortices. We extend the Lyra-Lin solution for the dust concentration of a single grain size to a power-law distribution of grain sizes . Assuming dust conservation in the disk, we find an analytic dust surface density as a function of the grain radius. We calculate the increase of the dust to gas mass ratio and the slope of the dust size distribution due to grain segregation within the vortex. We apply this model to a numerical simulation of a disk containing a persistent vortex. Due to the accumulation of large grains towards the vortex center, increases by a factor of 10 from the background disk value, and decreases from 3.5 to 3.0. We find the disk emission at millimeter wavelengths corresponding to synthetic observations with ALMA and VLA. The simulated maps at 7 mm and 1 cm show a strong azimuthal asymmetry. This happens because, at these wavelengths, the disk becomes optically thin while the vortex remains optically thick. The large vortex opacity is mainly due to an increase in the dust to gas mass ratio. In addition, the change in the slope of the dust size distribution increases the opacity by a factor of 2. We also show that the inclusion of the dust scattering opacity substantially changes the disks images.
=1 \fullcollaborationNameThe Friends of AASTeX Collaboration
1 Introduction
There is not yet a full theory that successfully explains the formation of solid planet that starts with the concentration and growth of dust particles in protoplanetary disks from millimeter to planetesimal sizes. One of the main problems is the fast radial migration of millimeter and micrometer dust particles toward the central star, which prevents the formation of large bodies during the disk lifetime (e.g., Testi et al. 2014; Johansen et al. 2014). This inward drift is due to the collisions of the dust grains (which tend to rotate at the Keplerian speed) with the gas molecules (which flow at sub-Keplerian speed), causing the loss of the dust angular momentum and, thus, dust radial migration. A natural way to prevent the fast migration is growth, because the inward radial velocity is a function of the dust grain size. For example, in the minimum mass solar nebula (MMSN) model, the inward radial migration has a maximum speed for 1 m objects (Weidenschilling, 1977). Thus, the dust particles should grow to sizes larger than 1 m in order to prevent their fast radial migration. However, to build meter-sized bodies (or larger) via dust collisions is not very effective, because the typical collision velocities are so violent that the final result is dust fragmentation instead of coagulation (Brauer et al., 2008). These two obstacles are known as the radial drift barrier and the fragmentation barrier, respectively.
One of the ideas proposed in order to avoid this problem is dust trapping in pressure bumps. Barge & Sommeria (1995) found that persistent gaseous vortices can effectively concentrate and segregate large amounts of solid particles via pressure gradients, possibly starting the formation of planetesimals. The dynamics of large scale vortices has been studied using 2D (Surville & Barge, 2015) and 3D (Richard et al., 2013) hydrodynamical simulations in protoplanetary disks; these azimuthal asymmetries naturally arise due to the Rossby wave instability (Li et al., 2000) or the baroclinic instability (e.g. Barge et al. 2016) in the outer edge of the dead zone, where turbulence due to the Magneto Rotational Instability (MRI) is depressed due to the low ionization state of the disk material. These structures can survive over a hundred rotation periods (measured at the radius of the center of the vortex) and increase the dust to gas mass ratio one order of magnitude (Inaba & Barge, 2006). This large concentration of dust mass could become gravitationally unstable, and start the formation of planetesimals.
In the last years, high angular resolution mm observations with ALMA and VLA, and infrared observations with SPHERE on the VLT have found large scale structures in several sources that could be the signatures of vortices in the disk. Some examples are the disks around the young stars Oph IRS 48 (van der Marel et al., 2013), HD 142527 (Casassus et al., 2013), LkH (Isella et al., 2013), MWC 758 (Marino et al., 2015), SAO 206462, and SR 21 (Pérez et al., 2014). Spiral arms structures have also been found in the dust emission, e.g., around MWC 758 and Elias 2-24 (Benisty et al. (2015); Pérez et al. (2016)). These observations are important to understand the physical processes suffered by the dust during the formation of planetesimals and the gas dynamics in protoplanetary disks; they also set important constrains to the parameters used in the theoretical models.
In this paper we consider the millimeter emission of a dust vortex in a protoplanetary disk obtained from the gas numerical simulation performed by Barge et al. (2017) (hereafter B17). We extend the Lyra-Lin dust vortex model (Lyra & Lin, 2013) for a single grain size to a power-law distribution of grain sizes. To calculate the dust millimeter emission we compute dust opacities in different regions of the vortex according to the size segregation, which changes the dust to gas mass ratio and the slope in the particle size distribution. We include the dust opacity due to both scattering and true absorption. The dust surface density model (Section §2) allows us to calculate the local dust properties (particle size distribution and dust to gas mass ratio) as a function of the position in the disk vortex . The Section §3 presents the simulated disk observations at mm wavelengths and their Spectral Energy Distribution (SED). In the Section §4 we compare with the emission of a model without dust segregation (§4.1), and without scattering (§4.2). In subsection §4.3, we discuss the maximum dust to gas mass ratio obtained in the vortex with the expected values in numerical simulations. And finally, in §4.4, we discuss the case when the maximum grain radius in the dust particle size distribution is cm. The conclusions are presented in the Section §5.
2 Disk model
2.1 Gas Disk Model
For the disk and the vortex, we use the result of numerical simulations of B17 performed over 100 rotations of the vortex around a star. The vortex is located at 60 AU from the star. The disk has a mass and a disk radius AU, which mimic the disk around the Oph IRS 48 young star. Figure 1 shows the gas surface density and the gas temperature of the disk as a function of the cartesian coordinates ().
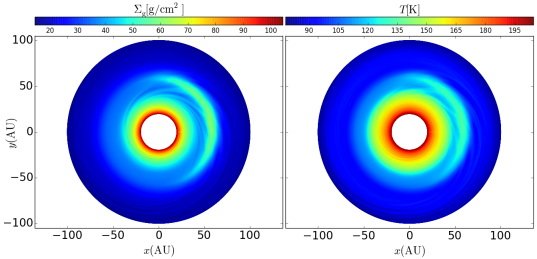
In the vertical direction , the disk is assumed to be isothermal and in hydrostatic equilibrium. We assume a distance pc, similar to the distance to Oph IRS 48.
2.2 Dust Disk Model
In a gaseous vortex, the dust particles tend to drift toward the pressure maximum at a rate that depends on their coupling with the gas, measured by the Stokes number
| (1) |
where is the radius of spherical dust particles, g cm-3 is the material density and is the gas surface density. Lyra & Lin (2013) found an analytic formulation for the dust concentration in a vortex as a function of the normalized Stokes number (), where is the turbulent viscosity parameter in the vortex (Shakura & Sunyaev, 1973). In their model, the surface density of the gas and dust depends on the semi minor axis coordinate that defines concentric ellipses with an aspect ratio , such that the semi major axis is . For each ellipse, the gas and dust surface density are given by
| (2) |
| (3) |
where , are the gas and dust maximum surface densities, is the vortex scale length, where multiplies the isothermal scale height , this factor depends on the aspect ratio of the vortex . The normalized Stokes number
| (4) |
is evaluated in the vortex center, since the vortex is small compared with the disk size, and the gas surface density does not vary much over its area.
For a given position in the vortex with polar coordinates , the corresponding ellipse has a coordinate
| (5) |
where are the coordinates of the vortex center.
The total gas surface density and the dust surface density of grains with radius can be written as
| (6) | |||||
| (7) |
where are the background disk gas and dust surface densities, respectively.
Since is a function of the grain size, the total surface density of the dust depends on the particle size distribution, , that gives the number of dust particles per unit volume with a radius between and . A typical value for the slope in protoplanetary disk is (Mathis et al., 1977).
Integrating the eqs. (6, 7) in all the disk, the mass of gas and the mass of dust with grain radius are
| (8) | |||||
| (9) |
where is the gas mass of the background disk and is the background disk mass of dust with radius .
We define the global dust to gas mass ratio of particles with size as
| (10) |
We assume that is conserved in the disk, i.e. the background disk also satisfies . This implies that the dust is redistributed in the vortex but does not coagulate and/or fragment. Therefore, the dust maximum surface density for a size is
| (11) |
For a particle size distribution in the background disk with , the mass is dominated by the large grains. If is the cumulative dust mass from the minimum grain size to a size , then, the ratio between the cumulative mass and the total dust mass in the disk () is
| (12) |
where we have assumed that . Furthermore, because the dust mass is dominated by the large dust particles, we approximate the dust mass of the grain population with size by the cumulative mass, i.e., . Thus, equation (12) can be rewritten as
| (13) |
where is the total dust to gas mass ratio taking into account all the dust grain sizes.
Then, using the eqs. (7, 11, 13), the dust surface density for grains with size is
| (14) | |||||
In this equation, we have written the background dust surface density as .
For the hydrodynamic simulation of B17, the center of the vortex is located at rad and AU. We fit the gas surface density by using a function of the form
| (15) |
where the first term represents the vortex structure (see eqs. 2, 5) and the second term is the background surface density. The best fit of the numerical data leads to: g cm-2, AU, , g cm-2, . Note that and in eq. (2).
For a disk in hydrostatic equilibrium, the dust particle size distribution is related with the dust surface density (see eq. B4), as
| (16) |
where and is the dust scale height. Then, from eq. (14), the dust particle size distribution is
| (17) | |||||
The first term of this equation represents the concentration of the dust particles within the vortex, it is only important for . We approximate eq. (17) with a simple power law function of the form . The left and middle panels of Figure 2 show the slope , the fractional standard deviation (). The slope decreases in the vortex and reaches a minimum value at the vortex center. The fit is very good as shown by the low values of the fractional standard deviation.
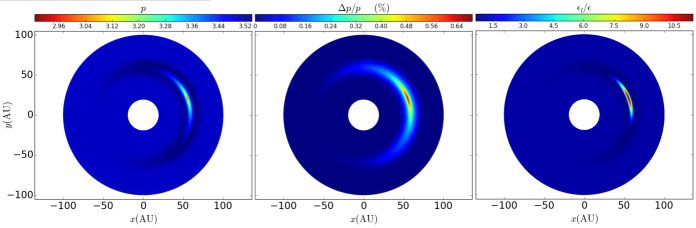
. Right panel: Map of the local dust to gas mass ratio (normalized to ).
Since the dust mass is dominated by the large grains, the local dust to gas mass ratio () reduces to
| (18) |
This function is shown in the right panel of Figure 2, normalized to the total dust to gas mass ratio (). The maximum dust to gas mass ratio () is quite large at the vortex center, reaching a value . Note that the increase of the dust to gas mass ratio in the vortex center is due to the accumulation of dust grains from a small region around the vortex, while the rest of the disk remains with the standard value.
3 Dust emission
Now we solve the radiative transfer equation to obtain the SED and the dust emission maps of the face-on disk at different wavelengths. The disk images are convolved with ALMA and VLA beams to simulate high angular resolution observations that are able to reveal the vortex structure.
3.1 Methodology
We use a grid of pixels in the plane of the sky and solve the radiative transfer equation along the line of sight in order to obtain the emergent specific intensity ,
| (19) |
The dust optical depth along the line of sight is given by
| (20) |
where is the coordinate in the line of sight, is the volumetric gas density, and the total monochromatic mass opacity is , where the scattering and absorption mass opacity coefficients are and , respectively. The source function is given by (Mihalas, 1978)
| (21) |
where the albedo is , is the Planck function, and is the zeroth order moment of the specific intensity, , where is the cosine of the angle between the direction perpendicular to the disk plane and the direction of . We use the analytical solution of for a plane-parallel isotropically scattering medium found by Miyake & Nakagawa (1993)
| (22) |
where , and is the total optical depth of the disk measured perpendicular to plane of the disk.
The total monochromatic opacity is computed with the code from D’Alessio et al. (2001). For the dust composition, we adopt a mixture of silicates, organics and ice with a mass fractional abundance relative to the gas , , and . This implies a total dust to gas mass ratio . The material densities are g cm-3, g cm-3, and g cm-3 (e.g. Pollack et al. 1994). We assume a dust particle size distribution , where varies according to the disk region; the minimum and maximum dust radii are m and mm. The maximum grain radius is larger in protoplanetary disks than in the ISM due to grain growth. Grain growth occurs due to coagulation during collisions induced by Brownian motions (important only for m particles), radial drift, vertical settling and turbulent mixing; it is, however, counteracted by fragmentation and bouncing of the mm-cm particles, which collide at high velocities (e.g. Brauer et al. 2008; Zsom et al. 2010). Recent radio observations of protoplanetary disks also infer a radial dust size gradient with dust grains of centimeter sizes in the inner disk regions and millimeter sizes in the outer disk regions (e.g. Pérez et al. 2015).
3.2 Images and SED
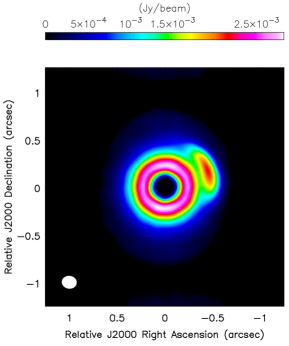
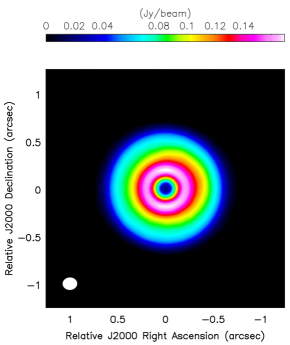
We use CASA (v 4.7.0) 111CASA, the Common Astronomy Software Applications package, is a software developed to support data processing of radio astronomical telescopes. to simulate ALMA observations of the disk model shown in Figure 1 with the dust properties of Figure 2. We calculate the images at 1 and 3 mm for the configurations C4-6 (Band 7) and C4-8 (Band 4). The precipitable water vapor (PWV) was set to 1.3 and 1.5 mm in the Band 7 and Band 4 configuration, respectively. These antenna arrays provide a similar angular resolution , which corresponds to 12 AU at the assumed distance of 120 pc.
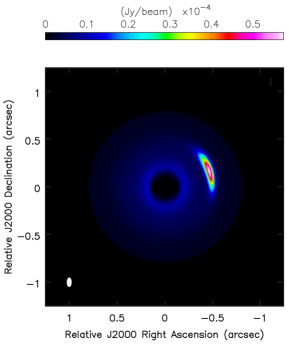
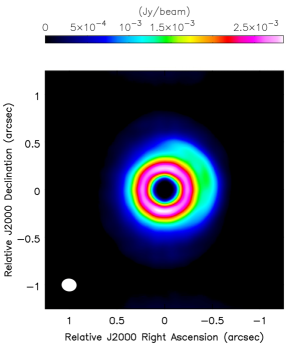
We also simulate VLA observations at 7 mm and 1 cm with CASA in the A configuration (the highest resolution). The FWHM beam of these configurations are and , respectively. In both simulations the PWV was set to 1.5 mm.
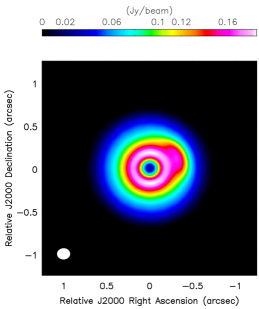
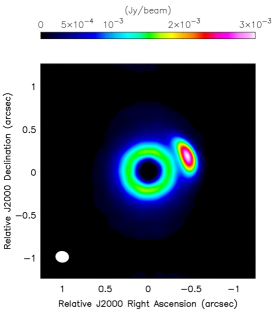
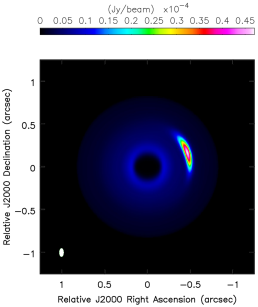
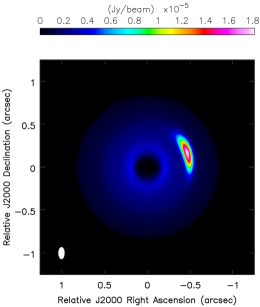
Figure 3 shows the ALMA simulated maps in the upper panels (left: 1 mm, right: 3 mm). Lower panels show the VLA maps (left: 7 mm, right: 1 cm). The vortex emission starts to show at 3 mm and becomes very evident at larger wavelengths, in the VLA images.


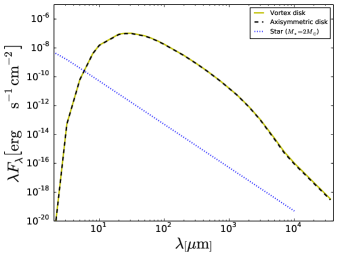
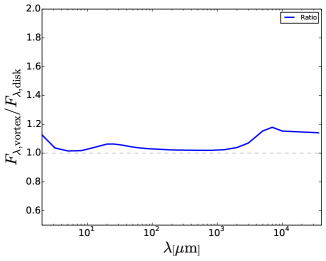
The left panel of Figure 4 shows the SED of the disk (yellow solid line). We also include the SED of an axisymmetric disk (black dashed line) and the contribution of a 2 star (blue dotted line). Note that the SED is not modified by the emission associated to the vortex, except at mm wavelengths where the disk becomes optically thin. The right panel shows the ratio between the flux from the vortex disk and the axisymmetric disk. The ratio has a maximum value of at mm. The reason for this behaviour is that the numerical simulation of B17 uses an adiabatic equation of state, thus, the disk temperature increases with the surface density; therefore, the flux associated to vortex is larger than the flux from the same region in the axisymmetric disk.
4 Discussion
4.1 Effect of the Dust Concentration
Strong azimuthal asymmetries at mm wavelengths, as observed, e.g, in the OpH IRS 48 disk (van der Marel et al., 2013), are obtained in the disk models with a concentration of the dust particles around the vortex center, as shown in the Figure 3. The strong disk asymmetry comes from the enhancement of the dust to gas mass ratio due to size segregation inside the vortex, the opacity is increased by a factor of 10 at the vortex center. The smaller slope of the size distribution within the vortex also increases the opacity at mm wavelengths (see Appendix A). For example, for and mm, the opacity increases by a factor of compared with the case . Both effects (higher dust to gas mass ratio and lower slope of the size distribution) are responsible for the increase of the opacity by a factor of 18 at the vortex center.
In order to explore the effect of dust concentration in the vortex, we made maps of the disk model at 1, 3, 7 mm and 1 cm assuming a constant dust to gas mass ratio of and a fixed slope of the dust particle size distribution throughout the disk. These maps are shown in Figure 5 with the same observational parameters described in the subsection §3.2.
The ALMA maps at 1 and 3 mm do not change much from those in Figure 3 where segregation is taken into account. However, there is a dramatic change for the VLA observations at 7 mm and 1 cm. If the dust segregation is not included, the high contrast between the vortex and the disk vanishes.


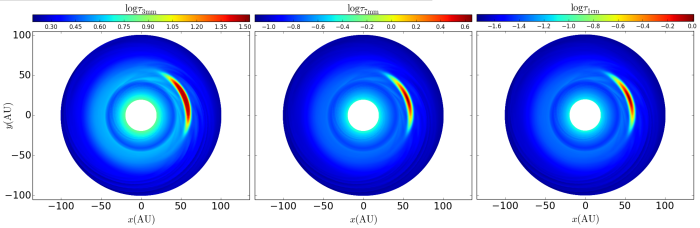
In the model with dust segregation, the vortex dominates the emission at long wavelengths. For those wavelengths the disk becomes optically thin while the vortex remains optically thick due to the increase of the dust opacity in this region. Figure 6 shows the logarithm of the optical depth at 3, 7 mm and 1 cm. At 3 mm, all the disk is optically thick (). At 7 mm, the vortex is optically thick, but the rest of the disk becomes optically thin (). At 1 cm, the vortex still remains optically thick, while the background disk is optically thin. Therefore, dust segregation is a crucial ingredient to produce strong azimuthal asymmetries in the dust thermal emission at 7 mm and 1 cm. Note, however, that jets and photoevaporated disk winds will also contribute to the 1 cm emission. Thus, high resolution images are necessary to distinguish the vortex at this wavelength (e.g. Macías et al. (2016)).
4.2 Absorption and Scattering
The contribution of the scattering coefficient to the total opacity is important at mm wavelengths, where the albedo is close to 1. In particular, for large grains with mm, for mm wavelengths; thus, scattering increases the total opacity and the albedo is large (see Figure 10).
In this section we produce synthetic images without scattering to compare them with the results of the previous section §3.2, i.e., we set , in the eqs. (20), (21), and (22).
Figure 7 shows the simulated ALMA maps at 1 and 3 mm and the simulated VLA maps at 7 mm and 1 cm when only the monochromatic absorption mass coefficient is included in the opacity. An important effect of ignoring scattering is that the emission at all wavelengths is higher than the emission of the maps in Figure 3. In addition, the 3 mm map shows a stronger azimuthal asymmetry compared with the 3 mm map of Figure 3. This happens because the optical depth decreases by an order of magnitude making the background disk optically thin at 3 mm, 7 mm and 1 cm, while the vortex remains optically thick.
Recently, Kataoka et al. (2015) found that self-scattering of thermal dust emission in protoplanetary disks produces polarized emission at millimeter wavelengths. The highest degree of polarization occurs for , where is the observing wavelength. Also, in the disk inner region, the direction of the polarization vectors tend to align with the disk minor axis. This property could help to discriminate scattered emission from direct emission from elongated grains aligned perpendicular to the magnetic field, which is used to determine the magnetic field morphology, e.g, Rao et al. (2014). Yang et al. (2016) studied the relative importance of both scattering and direct emission from magnetically aligned grains as a function of the inclination of the disk in the plane of the sky . They found that the scattering polarization dominates for edge-on ( deg) disks. Kataoka et al. (2016) and Yang et al. (2016) argue that millimeter emission from the disk around HL Tau can be explained by dust self-scattering, while in the case of the disk around NGC 1333 IRAS 4A1, it can be explained as a combination of direct emission by aligned grains and scattering (Yang et al., 2016).
4.3 Dust to Gas Mass Ratio
Surville et al. (2016) propose a model to follow the evolution of the dust population in the gas vortex during the linear capture regime that has an invariant
| (23) |
where is the Rossby number and is the slope of the angular velocity of the background disk. This equation is a good approximation for the first hundred rotations of the disk (measured at the vortex orbit). As a function of the time, the Rossby number tends to zero at the center of the vortex (Surville et al., 2016), so, for a Keplerian disk with , the maximum dust to gas mass ratio () is only a function of the initial Rossby number and the initial dust to gas mass ratio
| (24) |
Surville & Barge (2015) obtained appropriate values of the Rossby number for 300 simulations by varying temperature, surface density and scale height of the disks; they found that most of the vortices have . With this range of values, the expected dust to gas mass ratio in the vortex center is .
The dust to gas mass ratio found at the vortex center in section §2.2 is . For a standard value , the dust to gas mass ratio predicted in this work is lower by a factor of than the value given by eq. (24). It would be important to follow the dust evolution in the vortex disk simulation of B17 used in this work.
4.4 Maximum grain size
In the previous sections was set up to 1 mm; however, observational evidences suggest that the maximum grain size could reach 1 cm (e.g., Pérez et al. 2015). Figure 8 shows the dust properties when cm. The slope does not change significantly compared to the previous model ( mm). However, the maximum dust to gas mass ratio within the vortex is 7 times larger. This happens because 1 cm grains are more concentrated toward the vortex center since they have a Stokes number 10 times larger than 1 mm grains (eq. 3).

Dust opacity also depends on (see Appendix A). For cm the opacity at 1, 3, 7 mm, and 1 cm is modified by a factor of , respectively, compared with the case of mm. This means that at 7 mm and 1 cm the vortex emission will dominate the disk emission, but will have a small spatial extent, due to the strong dust concentration. At 1, 3 mm, the increase of the dust to gas mass ratio can overcome the decrease of the opacity; however, the background disk remains optically thick, thus, one expects maps similar to those in Figure 3.
5 Conclusions
Dust emission of vortices in protoplanetary disks is studied using the Lyra-Lin model for the concentration of dust grains towards the vortex center. Their analytic model gives the dust surface density for a single particle size. We have extended this model to the case of a dust size distribution . To extend the model, we assume that the dust mass for each grain size is conserved in the disk, i.e., the dust grains can change their spatial distribution and segregate in the vortex but cannot change their size. With this assumption we obtain the dust surface density as a function of the grain radius and the gas surface density. We have applied this model to the disk vortex obtained in the numerical simulations of Barge et al. (2017). Due to dust segregation inside the vortex, the local dust to gas mass ratio increases significantly and the slope of the size distribution decreases. We find that dust segregation and the inclusion of the scattering opacity are crucial to describe the azimuthal asymmetry in disk emission at mm wavelengths. Our main results are summarized as follows:
1. Dust segregation and concentration inside the vortex significantly increases the local dust to gas mass ratio inside the vortex (Figure 2, right panel); the maximum is reached near the vortex center. This high value is due to concentration of sub-mm and mm particles that dominate the mass distribution at the vortex center.
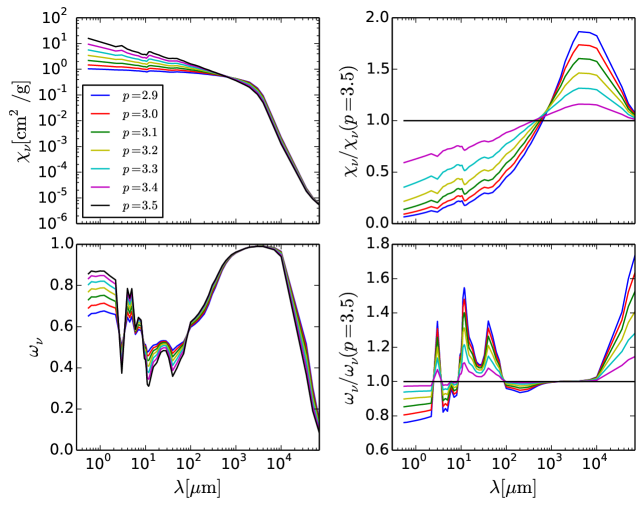
2. Dust segregation also changes the slope of the dust particle size distribution. In our disk model (eq. 17), the slope of the dust size distribution is found to be less than the standard value (); the slope has a minimum close to the vortex center with . This change of slope affects both the absorption and scattering coefficients of the dust population. At mm wavelengths, the ratio between the opacities corresponding to the slopes and is 1.8 times larger (Fig. 9).
3. The change of the dust properties due to the segregation of dust particles in the vortex (dust to gas mass ratio and the slope of the dust size distribution) has an important effect: it tends to enhance azimuthal asymmetries in the mm emission (see the simulated maps at mm and 1 cm in Fig. 3). If one only considers the effect of an increase of the dust surface density within the vortex using a constant dust to gas mass ratio , the vortex region does not dominate the emission of the disk at mm wavelengths (see Fig. 5). The main difference is that when dust segregation is included, the vortex remains optically thick even at long wavelengths, but the rest of the disk becomes optically thin. Instead, for a uniform dust to gas mass ratio, the vortex is optically thin.
4. For mm, dust scattering affects the disk image at millimeter wavelengths: the scattering mass coefficient increases the opacity of the disk by almost one order of magnitude. If scattering is not included in the monochromatic opacity, the optically thick vortex region appears as a dominant structure at = 3, 7 mm and 1 cm, due to smaller optical depth of the background disk.
Finally, the dust concentration model we developed extending the work of Lyra & Lin (2013) allows us to predict the disk emission at millimeter wavelengths with high angular resolution observations. It will be interesting to study the dust concentration and its emission in other large scale structures like ring gaps and/or spiral arms.
Acknowledgments: A. S. and S. L. acknowledge support of grants PAPIIT-UNAM IN105815 and CONACyT 238631. Computations were performed using HPC resources from GENCI [TGCC and CINES] (Grant - x2016047407) and also at LAM on the mib MPI cluster maintained by CESAM. We also thank the anonymous referee for his/her useful comments.
Appendix A Opacity
Using the code from D’Alessio et al. (2001), where the Mie theory and the dielectric constants of the dust components are used, we construct the total opacity (absorption + scattering) of the dust particles within the disk as a function of wavelength for the dust abundances described in Pollack et al. (1994). The opacity is not only a function of the wavelength, but also a function of the local pressure and temperature. The temperature dependence can be stronger than the pressure dependence when sublimation of different dust species occurs. For example, the ice grains sublimate at a temperature around 150 K for typical disk pressures, which causes a significant decrease of the total opacity.
The dust distribution also plays an important role in the magnitude of the opacity. For a given dust particle size distribution that gives the number of particles with sizes between and per volume unit, the total mean opacity coefficient is
| (A1) |
where is the monochromatic opacity associated to a single particle with dust size . The total opacity is given by , where and are the monochromatic absorption and scattering coefficients, respectively. The albedo is defined as . The left panels of Figure 9 shows the opacity , and the albedo for different dust size distributions with slopes in steps of 0.1, and for the dust composition discussed in §3.1. In all the cases the opacity units are cm2 per gram of gas. We define a standard opacity given by
a size distribution with a slope . The right panels show the normalized opacity and albedo normalized to the standard case. Note that for short wavelengths, the opacity is lower than the standard value, however, for large wavelengths, the opacity is larger than the standard value. The maximum increase (a factor of 1.8) occurs at mm.
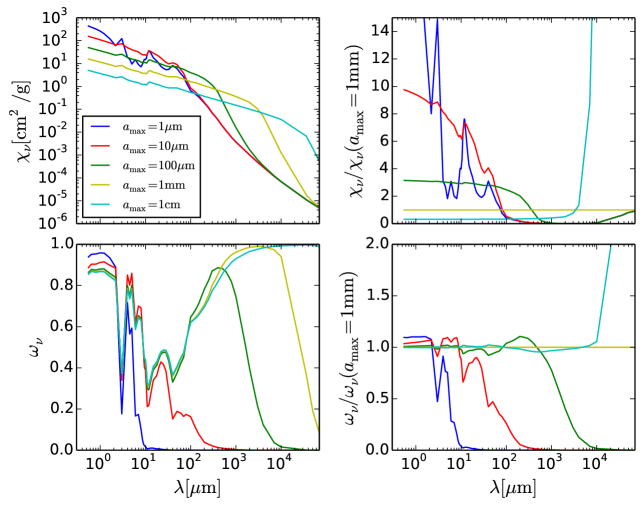
The opacity and albedo curves are also a function of the maximum grain radius in the dust particle size distribution. The left panels of the Figure (10) shows the opacity and albedo as a function of the maximum grain radius. The right panels show the normalized opacity and the albedo normalized with the case mm. The albedo becomes important at mm wavelengths for big grains, mm and 1 cm. Although the albedo are similar for these grain sizes, the opacity for cm at 1, 3, 7 mm, and 1 cm is a factor of times the opacity for mm (respectively).
Appendix B Dust particle size distribution
In an isothermal disk, the vertical dust volume density distribution is given by , where is the scale height of the dust disk, and is the dust volume density at the midplane. The midplane volume density can be obtained by adding the mass of all the dust particles with material density and radius as
| (B1) |
where is the material density, and the dust particle size distribution . The total dust surface density for the isothermal disk is given by
| (B2) |
and it can also be obtained as the sum of the surface densities of all the dust particles with different sizes
| (B3) |
For example, when the dust surface density increases with the dust size as , one obtains the typical dust particle size distribution with a slope .
References
- Barge et al. (2017) Barge, P., Ricci, L., Carilli, C. L., & Previn-Ratnasingam, R. 2017, A&A, 605, A122
- Barge & Sommeria (1995) Barge, P., & Sommeria, J. 1995, A&A, 295, L1
- Barge et al. (2016) Barge, P., Richard, S., & Le Dizès, S. 2016, A&A, 592, A136
- Benisty et al. (2015) Benisty, M., Juhasz, A., Boccaletti, A., et al. 2015, A&A, 578, L6
- Brauer et al. (2008) Brauer, F., Dullemond, C. P., & Henning, T. 2008, A&A, 480, 859
- Casassus et al. (2013) Casassus, S., van der Plas, G., M, S. P., et al. 2013, Nature, 493, 191
- Chang & Oishi (2010) Chang, P., & Oishi, J. S. 2010, ApJ, 721, 1593
- D’Alessio et al. (2001) D’Alessio, P., Calvet, N., & Hartmann, L. 2001, ApJ, 553, 321
- Inaba & Barge (2006) Inaba, S., & Barge, P. 2006, ApJ, 649, 415
- Isella et al. (2013) Isella, A., Pérez, L. M., Carpenter, J. M., et al. 2013, ApJ, 775, 30
- Johansen et al. (2014) Johansen, A., Blum, J., Tanaka, H., et al. 2014, Protostars and Planets VI, 547
- Kataoka et al. (2015) Kataoka, A., Muto, T., Momose, M., et al. 2015, ApJ, 809, 78
- Kataoka et al. (2016) Kataoka, A., Muto, T., Momose, M., Tsukagoshi, T., & Dullemond, C. P. 2016, ApJ, 820, 54
- Li et al. (2000) Li, H., Colgate, S. A., & Lovelace, R. V. E. 2000, Bulletin of the American Astronomical Society, 32, 02.15
- Lyra & Lin (2013) Lyra, W., & Lin, M.-K. 2013, ApJ, 775, 17
- Macías et al. (2016) Macías, E., Anglada, G., Osorio, M., et al. 2016, ApJ, 829, 1
- Marino et al. (2015) Marino, S., Casassus, S., Perez, S., et al. 2015, ApJ, 813, 76
- Mathis et al. (1977) Mathis, J. S., Rumpl, W., & Nordsieck, K. H. 1977, ApJ, 217, 425
- McMullin et al. (2007) McMullin, J. P., Waters, B., Schiebel, D., Young, W., & Golap, K. 2007, Astronomical Data Analysis Software and Systems XVI (ASP Conf. Ser. 376), ed. R. A. Shaw, F. Hill, & D. J. Bell (San Francisco, CA: ASP), 127
- Mihalas (1978) Mihalas, D. 1978, San Francisco, W. H. Freeman and Co., 1978. 650 p.,
- Miyake & Nakagawa (1993) Miyake, K., & Nakagawa, Y. 1993, Icarus, 106, 20
- Pérez et al. (2014) Pérez, L. M., Isella, A., Carpenter, J. M., & Chandler, C. J. 2014, ApJ, 783, L13
- Pérez et al. (2015) Pérez, L. M., Chandler, C. J., Isella, A., et al. 2015, ApJ, 813, 41
- Pérez et al. (2016) Pérez, L. M., Carpenter, J. M., Andrews, S. M., et al. 2016, arXiv:1610.05139
- Pollack et al. (1994) Pollack, J. B., Hollenbach, D., Beckwith, S., et al. 1994, ApJ, 421, 615
- Rao et al. (2014) Rao, R., Girart, J. M., Lai, S.-P., & Marrone, D. P. 2014, ApJ, 780, L6
- Richard et al. (2013) Richard, S., Barge, P., & Le Dizès, S. 2013, A&A, 559, A30
- Rybicki & Lightman (1979) Rybicki, G. B., & Lightman, A. P. 1979, New York, Wiley-Interscience, 1979. 393 p.,
- Shakura & Sunyaev (1973) Shakura, N. I., & Sunyaev, R. A. 1973, A&A, 24, 337
- Surville et al. (2016) Surville, C., Mayer, L., & Lin, D. N. C. 2016, arXiv:1601.05945
- Surville & Barge (2015) Surville, C., & Barge, P. 2015, A&A, 579, A100
- Testi et al. (2014) Testi, L., Birnstiel, T., Ricci, L., et al. 2014, Protostars and Planets VI, 339
- van der Marel et al. (2013) van der Marel, N., van Dishoeck, E. F., Bruderer, S., et al. 2013, Science, 340, 1199
- Yang et al. (2016) Yang, H., Li, Z.-Y., Looney, L., & Stephens, I. 2016, MNRAS, 456, 2794
- Yang et al. (2016) Yang, H., Li, Z.-Y., Looney, L. W., et al. 2016, MNRAS, 460, 4109
- Weidenschilling (1977) Weidenschilling, S. J. 1977, MNRAS, 180, 57
- Zsom et al. (2010) Zsom, A., Ormel, C. W., Güttler, C., Blum, J., & Dullemond, C. P. 2010, A&A, 513, A57