A Molecular-Line Study of the Interstellar Bullet Engine IRAS05506+2414
Abstract
We present interferometric and single-dish molecular line observations of the interstellar bullet-outflow source IRAS05506+2414, whose wide-angle bullet spray is similar to the Orion BN/KL explosive outflow and likely arises from an entirely different mechanism than the classical accretion-disk-driven bipolar flows in young stellar objects. The bullet-outflow source is associated with a large pseudo-disk and three molecular outflows – a high-velocity outflow (HVO), a medium-velocity outflow (MVO), and a slow, extended outflow (SEO). The size (mass) of the pseudo-disk is 10,350 AU6,400 AU (0.64–0.17 ); from a model-fit assuming infall and rotation we derive a central stellar mass of 8–19 . The HVO (MVO) has an angular size () AU, and a projected outflow velocity of km s-1 ( km s-1). The SEO size (outflow speed) is pc ( km s-1). The HVO’s axis is aligned with (orthogonal to) that of the SEO (pseudo-disk). The velocity structure of the MVO is unresolved. The scalar momenta in the HVO and SEO are very similar, suggesting that the SEO has resulted from the HVO interacting with ambient cloud material. The bullet spray shares a common axis with the pseudo-disk, and has an age comparable to that of MVO (few hundred years), suggesting that these three structures are intimately linked together. We discuss several models for the outflows in IRAS 05506+2414 (including dynamical decay of a stellar cluster, chance encounter of a runaway star with a dense cloud, and close passage of two protostars), and conclude that 2nd-epoch imaging to derive proper motions of the bullets and nearby stars can help to discriminate between them.
Subject headings:
ISM: clouds, ISM: individual objects: IRAS05506+2414, stars: formation, stars: pre-main sequence, stars: mass loss, radio lines: ISM1. Introduction
High-mass ( ) stars play a decisive role in the evolution of galaxies; throughout their life-cycles, they inject large amounts of energy and momentum into their environments through massive stellar winds, UV radiation, and finally in their deaths as supernovae (Zinnecker and Yorke 2007). In the earliest, very poorly understood, stages of their lives, massive stars and their immediate environments are characterised by high luminosities (), dense and warm molecular gas, strong far-infrared dust emission (e.g., Sridharan et al. 2002), and very weak or no free-free continuum emission at cm wavelengths (as they have not yet developed an ultracompact HII region).
Like their low-mass counterparts, high-mass protostars also exhibit bipolar outflows having varying degrees of collimation and outflow luminosities (Qiu et al. 2008). An exciting recent result in the understanding of this early evolutionary stage, based on a CO J=2-1 interferometric mapping study of the Orion BN/KL region (Zapata et al. 2009), is that its enigmatic wide-angle outflow has been produced by a violent explosion during the dynamical decay of a non-hierarchical massive young stellar system 500 yr ago (e.g., Bally et al. 2011: BCM11, Bally et al. 2017). A competing hypothesis is the chance encounter of a runaway star (BN) with the KL star-forming core (Tan 2004, Chatterjee & Tan 2012).
These are entirely different mechanisms from the classical accretion-disk-driven bipolar flows in YSOs, and begs the important question: is the Orion BN/KL explosive outflow and its engine unique, or simply the most prominent example of a relatively commonplace phenomenon? The latter scenario appears more likely, given that most massive stars form in dense clusters where dynamic interactions between the most massive members may be common, and that 30% of O-type stars are high-velocity runaways.
Our discovery, using HST, of the second clear-cut example of this phenomenon in our Galaxy, IRAS 05506+2414 (hereafter IRAS 05506) (Sahai et al. 2008 [Setal08]), now provides a new opportunity to test these models. A few additional examples of the explosive outflow phenomenon are listed in BCM11 (e.g., DR21, Zapata et al. 2013), but they are somewhat less compelling, and/or lack the detailed similarity with Orion BN/KL.
The HST optical and near-infrared images of IRAS 05506 show a bright, compact central source (Sa: Setal08) with a jet-like extension (Sa-jet: Setal08), and a fan-like spray of elongated knots which appear to emanate from it. Optical spectra show that these knots are moving at high velocities (radial velocity 350 km s-1) (Setal08). These structures are analogous to the near-IR “bullets” seen towards the BN/KL source in the Orion nebula. Interferometric observations of IRAS 05506 at 2.6 mm showed the presence of a high-velocity CO outflow (hereafter HVO) aligned with the optical jet structure and roughly orthogonal to the bullet-spray. Setal08 also found extended NH3 (1,1) emission towards IRAS 05506, which together with the combined presence of far-IR, H2O and OH maser, CO and CS J=2–1, emission, strongly suggested a dense, dusty star-forming core associated with IRAS 05506. Setal08 concluded that IRAS 05506 is probably an intermediate-mass or massive protostar. The lack of radio continuum and the late G – early K spectral type derived by Setal08 from the optical spectrum of this object (Sánchez Contreras et al. 2008) implied that this star is very young since its temperature is still too low to provide sufficient UV flux for ionisation. The time-scale of its bullet-outflow is very short (a few hundred years).
In this paper, we present a new study of IRAS 05506, based on extensive millimeter-wave observations of molecular lines, using both single-dish and high-angular resolution interferometric data. The plan of the paper is as follows. We first describe our observational results for the large-scale (arminute) cloud structure in which IRAS 05506 is embedded, as seen in molecular-line and thermal dust emission observed with single apertures (§ 3.1). We then describe observational results for the small-scale (arcsecond) structure around the central source in IRAS 05506 (§ 3.2). Next, in § 4, we discuss the properties of the main physical components associated with IRAS 05506, as derived from the above datasets – these include a pseudo-disk and several outflows. In § 5, we compare IRAS 05506 with the well-studied Orion BN/KL bullet-spray source, in the context of the published theoretical models that have been used to explain such sources. We present our conclusions in § 6.
2. Observations
2.1. SMA
We obtained observations at mm with the SMA111The Submillimeter Array is a joint project between the Smithsonian Astrophysical Observatory and the Academia Sinica Institute of Astronomy and Astrophysics and is funded by the Smithsonian Institution and the Academia Sinica using the subcompact and extended array configurations. The subcompact track was obtained as “filler” (i.e., the observations were carried out sharing the track with another project), with phase center coordinates (J2000 RA,Dec): 05:53:43.539, +24:14:45.2, using 7 antennas, with system temperatures, K. We shifted the phase center to 05:53:43.549, +24:14:43.999 in order to be consistent with the later extended tracks. The frequency coverage was GHz in the LSB, and GHz in the USB. Additional observational details (beam-size, orientation) are provided in Table 1.
The doppler correction for LO frequency was based on an extragalactic source which was being observed for the main track, with which we shared our observations. This led to a shift of km s-1 in the central velocity for our source (IRAS 05506). Our visibility data were post-corrected using the task uti_doppler_fix in MIR-IDL222https://www.cfa.harvard.edu/ cqi/mircook.html for this velocity shift.
With the extended array, data were taken over two tracks, one on 2012 January 20 (with 6 antennas, on-source time 6.5 hr) and another on 2012 February 9 (with 7 antennas, on-source time 8 hr). During the extended array observations in Feb 2012, the atmospheric conditions were very good (atmospheric optical depth at 225 GHz was around 0.03), and phase stability was also excellent. Since the system temperatures during January 20 ( K) were much higher than in the February 9 ( K), we have not used the former.
Comparing the visibility amplitudes in the subcompact-array (hereafter “subcom”) data with the extended-array (hereafter “ext”) data, over similar u-v spacings, we find the extended amplitudes to be weaker by a factor of 0.85. Hence the visibilities in the ext data were scaled upwards by a factor 1/0.85 in order to make these datasets consistent, before combining them into a single dataset (hereafter “extsub”), with high angular resolution () as well as sensitivity to extended structures on a scale of . In the rest of the paper, the default data cube used for presenting SMA observational results is the extsub one.
2.2. OVRO
We obtained observations at mm with OVRO using the H, E, and L array configurations; data were obtained with 2 tracks for each of arrays. The units of the digital spectral-line correlator were arranged to provide a total bandwidth of 90 MHz ( 234 km s-1) with a channel spacing of 1 MHz (corresponding to 2.6 km s-1). The 3 mm continuum emission was observed simultaneously using the dual-channel analog continuum correlator, which provided a total bandwidth of 4 GHz (after combining both IF bands). Additional observational details (beam-size, orientation) are provided in Table 1.
The calibration of the data was performed using the MMA software package333MMA is written and maintained by the Caltech’s Millimeter Interferometry Group.. Data were gain-calibrated in baseline-based mode using the quasar J0530135, which was observed at regular time intervals of 20 minutes before and after our target. The quasars 3C 273 and 3C 84 were used as passband and flux calibrators.
Reconstruction of the maps from the visibilities was done using the Multichannel Image Reconstruction, Image Analysis and Display (MIRIAD) software. We Fourier transformed the measured visibilities with robust weighting (which is an optimized compromise between natural and uniform weighting) for 12CO and natural weighting for the continuum map for S/N optimization.
2.3. Single-Dish Observations
We obtained single-dish observations of a variety of molecular lines (listed in Table 2) towards IRAS 05506 using the Arizona Radio Observatory’s (ARO) SMT-10m and Kitt Peak 12m (KP12m) telescopes, and the Caltech Submillimeter Observatory’s (CSO) 10-m telescope. These “on-source” spectra were obtained towards the coordinates of the optical/infrared source in IRAS 05506 (i.e., Sa) using coordinates (J2000 RA, Dec): 5:53:43.6, 24:14:45, by position-switching the telescopes using an emission-free reference position. The beam-sizes (FWHM) for the SMT-10m at nominal frequences of 345 and 230 GHz are and , respectively. For the KP12m (CSO), at 115 (461) GHz, the beam-size is (). The beam-sizes scale with the wavelength over broad wavelength ranges within the 0.65, 0.8, 2.6 and 1.3 mm windows.
We mapped the 12CO and 13CO J=2-1 emission simultaneously towards a area centered on IRAS 05506 using the SMT’s On-The-Fly (OTF) mapping observational mode (see, e.g., Bieging & Peters 2011 for details of the technique).
All data were calibrated using the standard chopper calibration method. Telescope pointing was checked frequently, i.e., every 45 to 60 minutes – at the ARO, we used Mars as a continuum pointing source, and at the CSO, we used the circumstellar shell of the evolved star GX Mon as a line (CO J=2–1) pointing source. Additional relevant observing details (e.g., system temperatures, spectrometer backends, beam efficiencies) are given in Table 2.
3. Results
3.1. Single-dish Data: The Large-Scale Environment of IRAS 05506
3.1.1 CO Observations
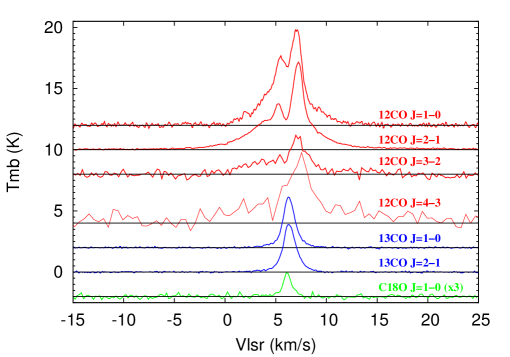
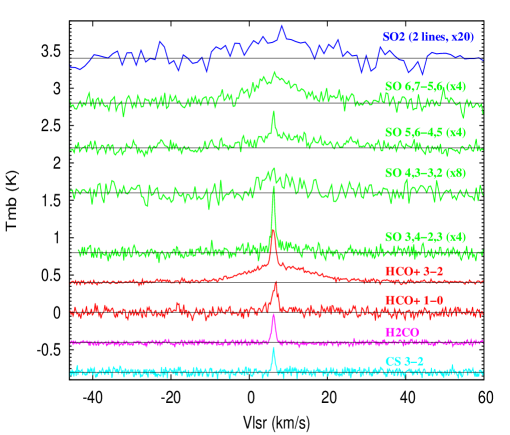
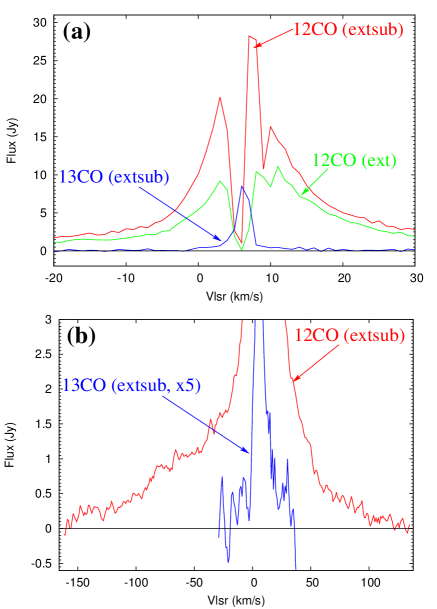
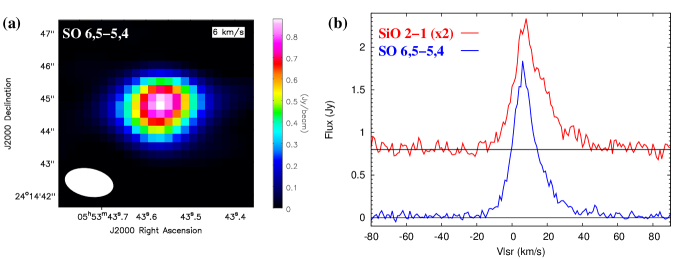
The on-source 12CO J=2-1 and 1-0 lines show a double-peaked core, with a central minimum at km s-1, and prominent wings (Fig. 1). The on-source 12CO J=3-2 and 4-3 lines shows an emission peak near km s-1 with a FWHM velocity width of 2 km s-1, as well as a weaker, significantly broader component, having a FWHM of roughly 10 (15) km s-1. In contrast, the corresponding 13CO 2-1 and 1-0 line profiles are centrally peaked at km s-1, with a FWHM=1.5 km s-1.
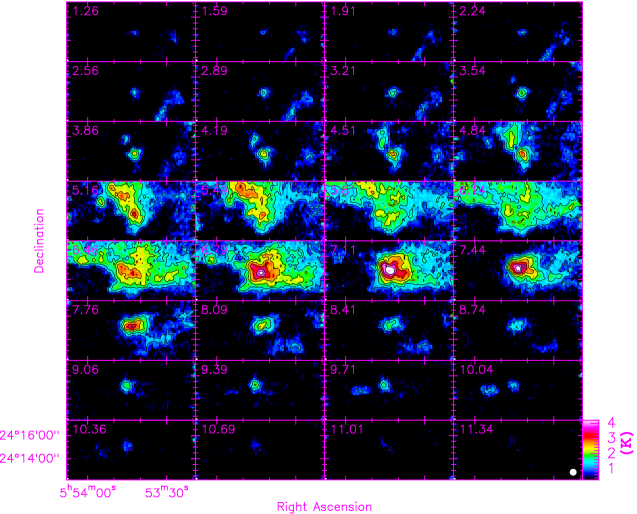
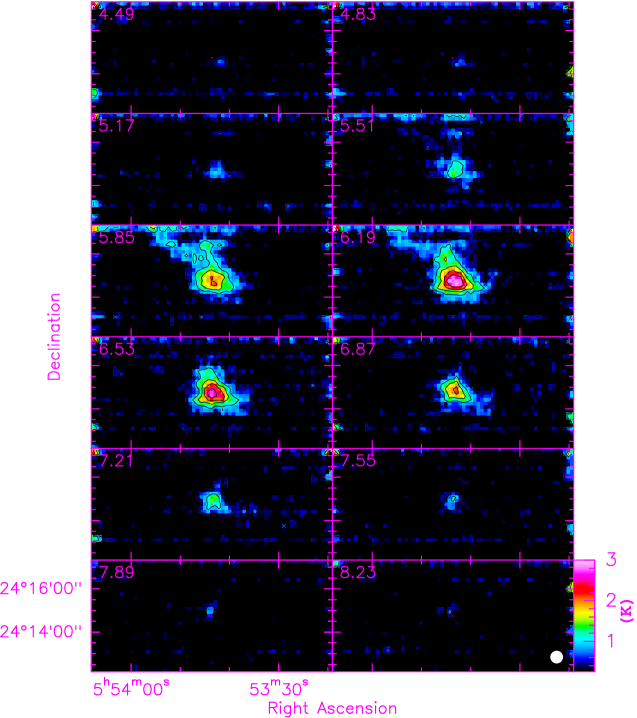
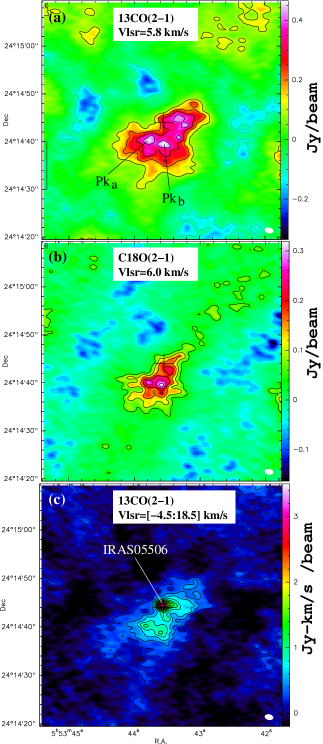
Our OTF mapping shows that 12CO J=2-1 emission is very extended, and at and around km s-1, it covers the full extent of the mapped area (i.e., ) at the noise level (1 K intensity) (Fig. 2). We will refer to this cloud as “cloud A”; this cloud is likely a substructure of an even larger cloud, extending EW and NS, that was mapped by Setal08 in 12CO J=1-0 around IRAS 05506 with ARO’s KP12m dish. The 13CO J=2-1 emission at km s-1 is much less extended (Fig. 3), and is strongly peaked towards IRAS 05506 – the contour at 30% of the peak 13CO intensity defines a roughly triangular-shaped region (with east-west and north-south aligned sides of length ). We will refer to this structure as “cloud A core”.
The on-source C18O J=1-0 line profile has the narrowest width (FWHM0.4 km s-1) amongst all the single-dish CO line profiles, is likely dominated by dense, cold gas in the cloud A core, whereas the other 12CO and 13CO J=1–0 line profiles likely include contributions from an outflow (see below).
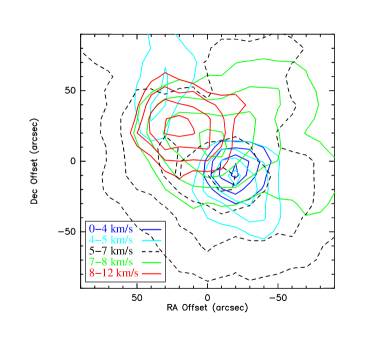
Using the OTF, we find that the emission in the blue wing ( km s-1) and red wing ( km s-1), as seen in the on-source 12CO(2-1) profile, delineates two large extended bipolar outflow lobes around the location of IRAS 05506, with the blue (red)-shifted lobe located SW (NE) of center (Fig. 4). Hereafter, we refer to this outflow as the Slow Extended Outflow, or SEO. We do not find emission in our OTF map at velocities shortward (longwards) of km s-1( km s-1).
3.1.2 Shock and High-Density Tracers
Out of the four SO lines observed (N,J=6,7-5,6, N,J=5,6-4,5, N,J=4,3-3,2 and N,J=3,4-2,3: hereafter SO lines 1, 2, 3, & 4, respectively), two (SO lines 2 and 3) show a narrow central component, together with weak wings. The highest-excitation line, SO line 4, shows only the broad component, and the lowest-excitation line, SO line 1444the energies of the upper levels for SO lines 1–4 are respectively, 11.02, 19.93, 24.30, 33.04 cm-1, shows only the narrow component (Fig. 5). We also detected weak, broad emission from the SO2 J(Ka,Kc)=4(3,1)-4(2,2) and 12(1,12)-11(1,11) lines. The SO and SO2 emission likely arises from shocked gas, as has been proposed in the case of the HH 212 jet (Podio et al. 2015).
The HCO+ J=3-2 line profile has a central narrow component with FWHM 1.3 km s-1, and a broad component with wings extending to km s-1 and km s-1; the HCO+ J=1-0 line shows only the narrow component. We show later that the broad velocity wings of the SO lines likely arise in a very compact outflow in IRAS 05506 (§ 3.2.2). The SO2 and HCO+ broad-wing emission which covers a similar velocity range as SO, most likely also comes from the same outflow.
The CS J=3-2 and H2CO 2(1,1)-1(1,0) lines show only a narrow component centered at km s-1, which most likely comes from dense gas in the cloud A core.
3.1.3 Continuum
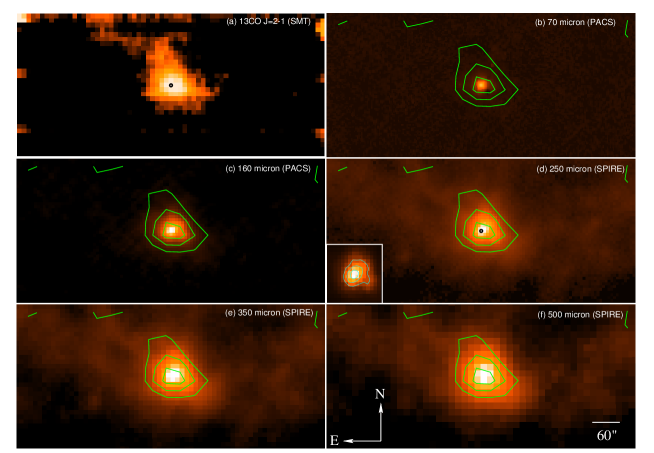
IRAS 05506 was observed with the SPIRE and PACS instruments onboard the Herschel Space Observatory (HSO) as part of the Hi-Gal survey (Molinari et al. 2016). We have downloaded the Level 2.5 images from the Herschel Science Archive. The SPIRE images (at 500, 350, and 250 µm) show a bright emission source roughly centered at the location of the 2MASS optical/infrared source in IRAS 05506 (Sa) found by Setal08555J2000 RA, Dec: 05:53:43.56, 24:14:44.7 (Fig. 6). The far-IR source has a morphology that is similar to that of the 13CO J=2-1 emission from the cloud A core. Much fainter dust nebulosity can be seen extending roughly towards the ENE and W, with the same extent and morphology as the faint emission seen in the 12CO J=2-1 emission at the radial velocity of cloud A. The central peak appears to be elongated SE-NW (Fig. 6d, inset). The half-power size of this peak is (deconvolved size is , given the SPIRE beam at 250 µm).
The PACS images (70 µm and 160 µm) show emission predominantly from a bright, round source with a half-power diameter of at 70 µm, centered at the location of HST source Sa (deconvolved size is , given the PACS beam at 70 µm).
3.2. Interferometric Data: The central source of IRAS 05506
We detected emission in the J=2-1 lines of 12CO, 13CO, and C18O, and the SO N,J=5,6-4,5, and SiO J=5-4 (v=0) lines from IRAS 05506 with the SMA. Additional, more extended tracks were observed towards IRAS 05506 with the OVRO array666during the course of a survey of post-AGB objects by Sánchez Contreras & Sahai 2012 than those presented in Setal08 for the 12CO and 13CO J=1-0 lines.
3.2.1 CO Observations
IRAS 05506 (Sa) is located near the north-east (NE) periphery of an extended, structured cloud of size – the latter is best seen in the 13CO and C18O J=2-1 maps, since these lines are more optically-thin than 12CO J=2-1 (Fig. 7a,b). This cloud (hereafter “cloud B”) has its long axis oriented roughly along the SE-NW direction as seen in the 13CO J=2-1 map at km s-1.
We note that cloud B shows several distinct compact peaks in the 13CO and C18O J=2-1 maps at km s-1, none of which are associated with the IRAS 05506 Sa. These compact cores (the brightest of these are labelled and ) show no evidence for stars, as no associated point-sources are found in the near-IR (HST 0.8 µm image, Setal08) or IR (2MASS J,H, K-band images, Setal08) or an archival Spitzer/IRAC 4.5 µm image. In the 2MASS and Spitzer images, the wings of the PSF of the very bright IRAS 05506 source at these wavelengths overlap the locations of these dense cores, making it difficult to discern faint counterparts. However, in the HST image this is not an issue, and althoough faint stars can be seen even closer to the bright IRAS 05506 source than and (Setal08) there are no optical counetrparts for these peaks. There is also no evidence for broad-velocity emission signifying the presence of outflows associated with these peaks.
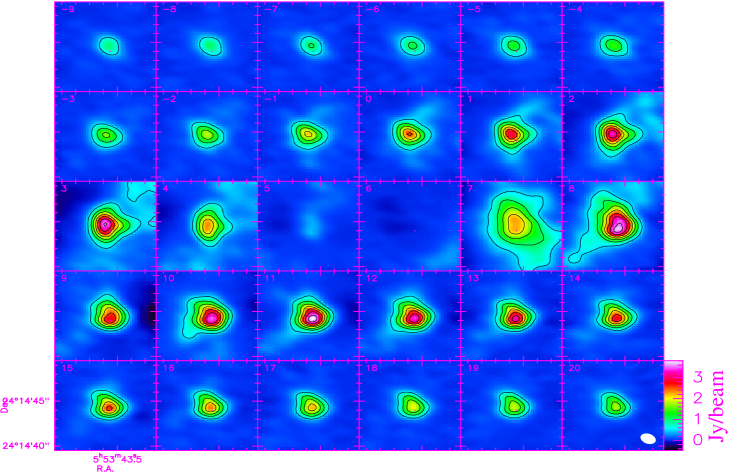
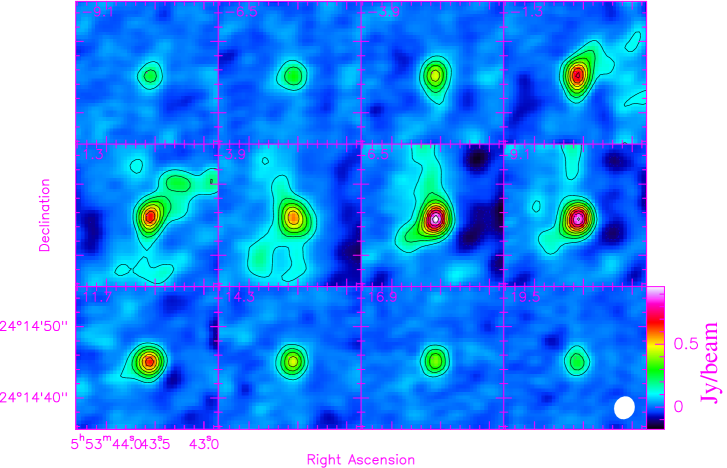
At the location of IRAS 05506, no emission peak is seen in the 13CO J=2-1 map at km s-1, but when the emission is integrated over a broad velocity range, V to 18.5 km s-1 (Fig. 7c), a bright compact source becomes visible there. Channel maps of the 12CO J=2-1 emission, covering a central velocity range around IRAS 05506’s systemic velocity, i.e., , show emission mostly confined to a rather compact structure, about in size, centered at coordinates (J2000 RA, Dec): 05:53:43.55, 24:14:45.1 (Fig. 8), except in the =5 and 6 km s-1 channels, where the emission is very weak or absent. This absence of emission results from strong absorption by cold gas in cloud A (described above, § 3.1.1).
A similar compact source is seen in the OVRO 12CO J=1-0 map at the same location (Fig. 9), but appears slightly more extended because of the larger beam size in these data. However, unlike J=2-1, the J=1-0 data show the compact source also in the km s-1 (2.6 km s-1 wide) channel, which overlaps the velocity range of the =5 and 6 km s-1 channels in the SMA map. We infer that the foreground cloud A has a significantly lower optical depth in 12CO J=1-0, compared to J=2-1, along the line-of-sight towards the compact source. The compact source in IRAS 05506 is not seen in C18O J=2-1 or 13CO J=1-0, either at the systemic velocity or when integrated over a broad-velocity range (as above, V to 18.5 km s-1), and we conclude that the emission from the source in the lines of CO and its isotopologues is dominated by relatively optically-thin emission extending over a broad velocity range.
In order to understand the kinematic structure of this compact CO source, we have extracted a 12CO J=2-1 spectrum from the extsub datacube using a box-aperture centered on IRAS 05506. The spectrum shows a triple-peaked structure in its core (Fig. 10a), which is a combination of two features: the first is a broad absorption feature extending over km s-1 due to foreground absorption from cloud A (and/or cloud A core), and the second is emission in the km s-1 range from an extended structure evident in the 12CO channel map at these velocities (see Fig. 8) (hereafter “cloudlet B1”).
The 13CO J=2-1 spectrum does not show the triple-peaked structure seen in 12CO J=2-1. It is centrally-peaked with a narrow core of FWHM 1.8 km s-1(1.5 km s-1 deconvolved), a broad component extending about 10 km s-1 from the peak at km s-1. The broad component comes from the compact source identified above in the 13CO J=2-1 moment 0 map (Fig. 7c).
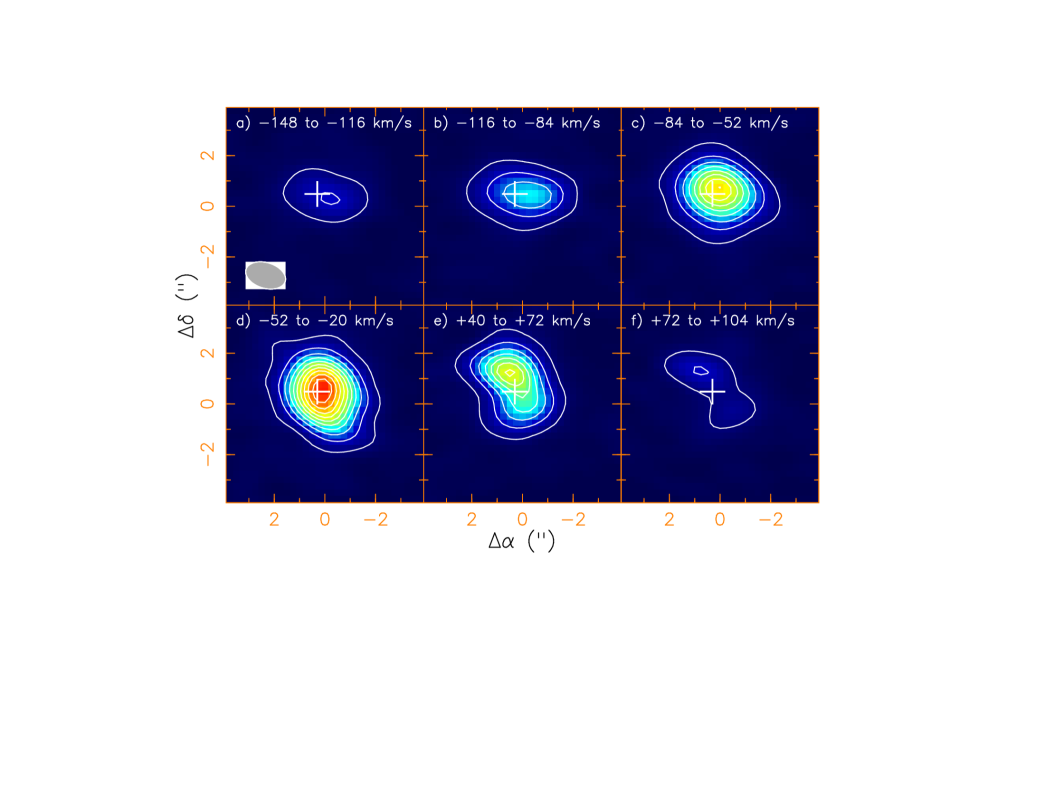
The 12CO spectrum shows very extended wings seen out to of km s-1 in the blue wing and km s-1 in the red wing (Fig. 10b) In order to elucidate the structure of the faint emission in the line wings at and , we plot the integrated emission in selected velocity intervals covering the line wings (Fig. 11). The strongest blue-shifted and red-shifted emission 12CO J=2-1 emission at large velocity offsets from the systemic velocity (i.e., to km s-1 in the blue and to km s-1 in the red) is separated by along an axis that is roughly oriented along 40°, with the blue-shifted emission in the south-west (SW). At more extreme velocity offsets (i.e., km s-1 and km s-1) the orientation of the vector joining the blue- and red-shifted emission shifts to a larger , 55°, but the uncertainty in this value is large because the red-shifted emission at these velocities is very weak, and because a weaker, secondary red-shifted peak is found located to the SW of the blue-shifted peak by . We conclude that although the HVO direction in the SMA 12CO J=2-1 data is roughly consistent with that inferred by Setal08 from their OVRO 12CO J=1-0 data, the HVO is likely more complex than a single bipolar outflow.
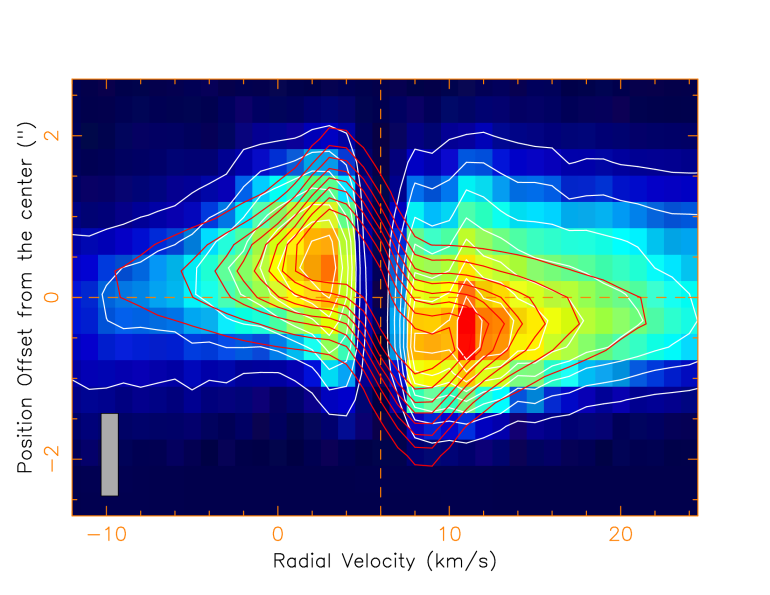
At small offset velocities ( km s-1) relative to the systemic velocity, we find a structure that is kinematically different from the HVO. We find that the intensity peaks at 2.7 and 10.9 km s-1 in the 12CO J=2-1 line profile (Fig. 10a), are separated spatially by along an axis at 40°, in our highest-resolution data (i.e., the ext datacube, with a beam of at ). A position-velocity plot of a cut along this axis shows that the low-velocity emission is suggestive of differential rotation (Fig. 12), such that the north-east (NE) side is moving towards us, and the SW side is moving away from us. This gradient is opposite to that seen for the HVO emission. We label the structure producing this emission as the pseudo-disk (We present a model for the pseudo-disk in ). We infer that the axis of this pseudo-disk, orthogonal to the direction of maximum velocity gradient above, is oriented at 130°.
However, the kinematics of this structure is likely more complex than simply differential rotation, since in the latter case, the separation of the red- and blue-shifted emission should become progressively smaller for increasingly larger offset velocities from the central velocity, but in the PV-plot shown in Fig. 12 there appears to be a net separation even at the highest velocities.
A position-velocity plot of a cut along the pseudo-disk major axis extracted from the 13CO J=2-1 ext datacube (not shown) also shows a spatially compact emission structure extending over a velocity range km s-1 that appears similar to the structure seen in the 12CO J=2-1 PV plot; we conclude that this emission also comes from the pseudo-disk.
3.2.2 Shock and High-Density Tracers
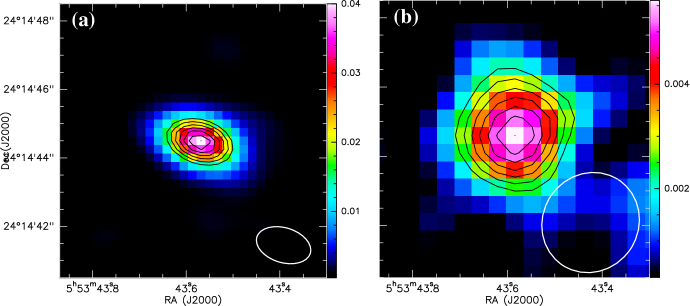
The SO N,J=5,6-4,5 map at the peak emission velocity ( km s-1)777a map of the emission integrated over the line-width is similarly compact (not shown), shows that most of the emission arises from a compact source – the FWHM size of the core in the SO ext image (Fig. 13a) is , ). The emission peak is located at coordinates (J2000 RA, Dec): 5:53:43.565, 24:14:44.68. Hence, given the FWHM beam-size (), the SO source is marginally resolved, with a deconvolved size of about . The SiO 5-4 (v=0) emission map, shows similar properties as SO N,J=5,6-4,5, but is weaker and therefore has lower signal-to-noise. The SO and SiO line profiles extracted from apertures twice the FWHM source sizes in these lines (thus capturing almost all of the source flux), have roughly triangular shapes, with clearly visible wings covering about 60 km s-1 (from to 40 km s-1) (Fig. 13b).
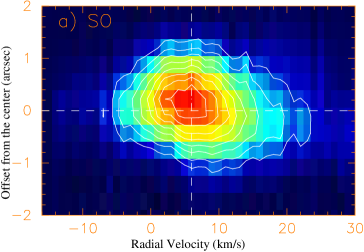
Position-velocity plots of the intensity along a cut at ° in the SO N,J=5,6-4,5 ext maps show weak evidence for a velocity gradient along ° over the velocity range km s-1 (Fig 14), which has the same sense as that seen in the pseudo-disk. We therefore conclude that some fraction of the emission seen in the SO line in the velocity range arises in the pseudo-disk.
The SO and SiO profiles are asymmetric about the central peak with the red-shifted side being brighter and broader than the blue one. Such a shape is a characteristic signature of self-absorption in an optically-thick outflow with a radially-decreasing temperature distribution. We propose that some or all of the high-velocity wing emission, i.e., at velocities offset by from the systemic velocity arises in an outflow (hereafter “medium-velocity outflow” or MVO). We do not find a convincing velocity gradient for this outflow, since the SO emission is only marginally resolved in our maps.
The asymmetry of the line profiles from the MVO is opposite to that seen for the emission from the HVO – for the latter, the 12CO emission from the blue-shifted component ( km s-1) is stronger than the red-shifted one ( km s-1) (see Fig. 10b). The 12CO profile, in the velocity range of the MVO, has the same asymmetry as seen in the SO and SiO lines. This difference in profile asymmetries between the MVO and HVO strengthens our inference that these two outflows are distinct kinematic components.
The SO N,J=5,6-4,5 flux measured with the SMA is consistent with that measured with the SMT. We infer that the emission seen in the single-dish spectra of the SO arises in the pseudo-disk and MVO.
3.2.3 Continuum
The 1.3 mm continuum integrated over line-free channels, shows a largely unresolved source, located at coordinates (J2000 RA, Dec): 5:53:43.570 24:14:44.47 (Fig. 15a), with a FWHM size (), and () that is very similar to that of the beam (, ). Hence, the intrinsic source size is . The 2.6 mm continuum source is also unresolved (Fig. 15b) (beam ).
The total flux at 1.3 mm is 50 mJy (45 mJy at a frequency of 220.4 GHz from the lower sideband, and 56 mJy at a frequency of 230.5 GHz from the upper sideband). Comparing this with the continuum flux at 2.6 mm of mJy measured by Setal08, we derive a power-law dust emissivity exponent of 1.4, in the Rayleigh-Jeans approximation.
4. The Structure of IRAS 05506
The structure of IRAS 05506 and its environment is complex. However, as a result of being able to map several different molecular lines at different angular resolutions, we are able to identify the major components and derive their physical properties. Many of the derived values are sensitive to the adopted distance, and we have modified the 2.8 kpc distance to IRAS 05506 adopted in Setal08. We use km s-1 to determine a distance of 3.7 kpc. This value is similar to that derived by Lumsden et al. (2013), as part of the Red MSX Source Survey of massive protostars.
Note, however, because of the typical intrinsic velocity dispersion in molecular clouds, the uncertainty in the distance to IRAS 05506 is relatively large. We show below that proper motion measurements of IRAS 05506’s high-velocity bullets can be used to determine its expansion-parallax distance, with each bullet providing an independent measure of the distance.
The expected proper motion of the knots is 22.7 mas yr-1 sin (/400 km s-1) (3.7 kpc/D), where is the 3D velocity of the knot, and is the inclination of the axis, relative to the line-of-sight, along which each knot is moving. Both and can be estimated from the radial velocity profiles of the bow-shock emission associated with each knot. Bow-shock models show that for =90°, the velocity structure is symmetric around the systemic velocity, and becomes increasingly asymmetric as becomes smaller or larger than 90° (see Fig. 1 of Hartigan et al. 1987: HRH87); the velocity width of the profiles at the base is equal to the 3D velocity of the shocked material at the apex of the bow-shock, i.e., . We have extracted the H velocity profile of knot K1 in IRAS 05506’s bullet spray, from the optical spectrsocopy in Setal08. The observed line profile, with a narrow peak near the systemic velocity, and a broad shoulder extending towards blue-shifted velocities (Fig. 16), appears to closely resemble the =60° model profile for a shock velocity km s-1, including its width at the base, km s-1(panel N in Fig. 1 of HRH87)888although the profile shape in panel R also looks similar, its width at the base ( km s-1) is significantly smaller than observed. We conclude that 60° for knot K1, and that 400 km s-1. Thus the total proper-motion from our 1st-epoch imaging in 2002 Oct to (say) a 2nd-epoch in 2018, is 363 mas (3.7 kpc/D), and thus easily measurable, even for D as large as 15 kpc. Conservatively accounting for uncertainties in and the proper motion, the expansion-parallax distance to IRAS 05506 can be determined with an uncertainty of about 10%.
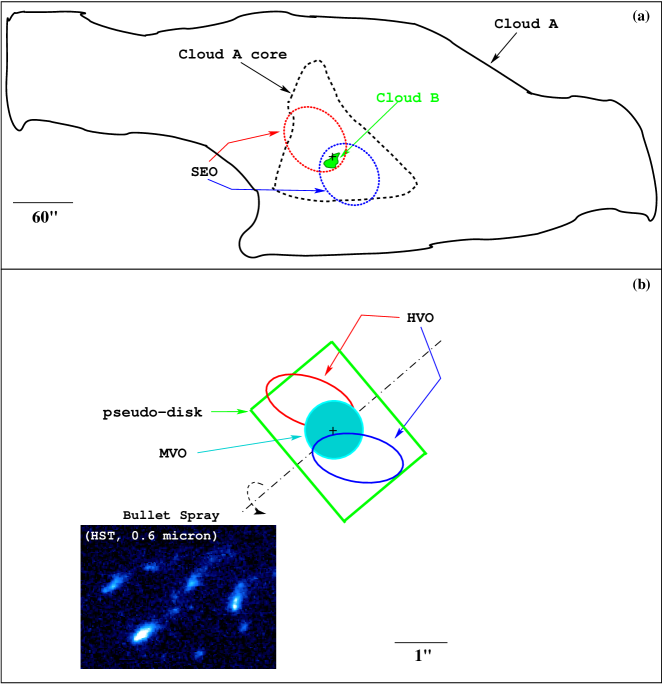
The major components of IRAS 05506 and its environment are shown schematically in Fig. 17, and described below. Some salient properties of these components are tabulated in Tables 3 and 4 for easy reference.
4.1. Large-Scale Structure
4.1.1 Cloud A and its Dense Core
Our single-dish 12CO J=2-1 (e.g., Fig. 2) and J=1-0 (Setal08) maps reveal that IRAS 05506 is located towards a very extended cloud (cloud A) with km s-1. The “absorption” feature that is seen in the 12CO J=2-1 and 1-0 single-dish spectra of IRAS 05506 at km s-1 is presumably due to relatively cold gas in this cloud that is optically thick these lines. The brightness temperatures of the line emission in these spectra at km s-1 (4 K and 2.5 K, respectively, after convolving the 12CO J=2-1 data to the larger beam-size of the 12CO J=1-0 data) indicates an average kinetic temperature 7 K in Cloud A.
As noted previously (§ 3.1.1,3.1.3), the 13CO J=2-1 map delineates a dense core (see Figs. 3, 6) within cloud A. We make the reasonable assumption that the single-dish profiles of 13CO (J=1-0 and 2-1) and C18O (J=1-0), all of which are centrally-peaked at km s-1, arise from this dense core. The ratio of the single-dish 13CO J=1-0 to C18O J=1-0 spectra is 6.3, close to the local interstellar 13CO to C18O abundance ratio of, [13CO]/[C18O]=6.1 (Wilson 1999), from which we infer that the 13CO J=1-0 line in the cloud A core, averaged over a scale, has an optical depth of slightly less than unity (), and the kinetic temperature is about 9.5 K. The beam-averaged column density of C18O is N(C18O)= cm-2, implying a molecular hydrogen column density, N(H2)= cm-2, assuming a standard ISM C18O/H2 abundance ratio of (Goldsmith, Bergin, & Lis 1997).
4.1.2 Cloud B
Our SMA 13CO J=2-1 map resolves out the smooth extended emission from cloud A and its core, and shows a roughly trapezoidal-shaped cloud (cloud B), extending about (at its half-intensity countour) along (Fig. 7a), i.e., roughly along the axis of the wide-angle bullet spray. The C18O J=2-1 map shows a roughly similar shape (Fig. 7b). A moment 0 map of the 13CO J=2-1 emission over the velocity range V to 18.5 km s-1 shows the outflow source in IRAS 05506 located near the NE periphery of this cloud. Emission from cloud B is seen in the km s-1 range, peaking between channels centered at and km s-1.
Assuming that the densities are high enough for the lines to be thermalized, and [13CO]/[C18O]=6.1 (as above), we find that the 13CO J=2-1 emission is optically thick everywhere in cloud B, by fitting the brightness temperatures of the 13CO to C18O J=2-1 emission in the SMA maps. Towards the location of IRAS 05506, the 13CO J=2-1 optical depth is, and the kinetic temperature is, . In comparison, and in Pkb, located 53 south of IRAS 05506.
4.1.3 Cloudlet B1
The nature and association of Cloudlet B1 with the IRAS 05506 outflow source is not clear. For now, all we can say is that it produces additional features in some of the maps and spectra, adding to their complexity. For example, it is likely responsible for the emission peak near km s-1 seen in the single-dish profiles of 12CO J=3-2 and 4-3, and the prominent peak at km s-1 in the 12CO J=2-1 SMA extsub line profiles. This component was shown to be modestly extended relative to the SMA extsub beam, but since the ratio of the 12CO J=4-3 to the J=3-2 peak intensity is about 1.8, it must be significantly smaller than the 12CO J=4-3 beam size (), in order for beam-dilution to account for this ratio.
4.1.4 SEO
The SEO, extends over about 1 pc, and is seen in our single-dish 12CO J=2-1 maps. The age of the SEO, estimated by dividing the separation between its blue- and red-shifted lobes, of (as seen in the velocity ranges km s-1 and km s-1 (Fig. 4)), by the average velocity separation of 8 km s-1 between these lobes, is yr.
We estimate a total 12CO J=2-1 flux of 22.9 and 28.8 Jy–km s-1 in the blue and red lobes of the SEO, which, assuming a nominal kinetic temperature of 15 K and optically-thin emission, implies a total mass, scalar momentum and kinetic energy of 1.6 , 4.7 km s-1, and ergs. We have assumed a fractional CO abundance =[CO]/[H2]= (here and elsewhere in the paper). Its presence implies that a very significant amount of kinetic energy has been added to a pc region around IRAS 05506.
The sense of the velocity gradient, the axis orientation, as well as the scalar momentum, of the HVO and SEO are similar. Hence, it is likely that the SEO has resulted from the interaction of the HVO with the surrounding ambient cloud material. Thus the value of derived above is an upper limit. A better approximation to the SEO age can be derived assuming a uniform deceleration, in which case, yr, where and are the initial and final velocities of the material in the SEO, taken to be the average outflow velocity of the HVO (94 km s-1; see § 4.2.2 below) and the SEO (4 km s-1).
4.2. Small-Scale Structure
The central compact source in IRAS 05506 as seen in our high-angular rsolution molecular-line maps, has several major structural components that can be identified by their spectral signatures (Fig. 10) and spatial extents – we describe these below.
4.2.1 The Pseudo-Disk
The pseudo-disk is seen in 12CO J=2-1 emission at km s-1, with its axis aligned roughly along that of the wide-angle bullet spray. We estimate a rough upper limit to the optical depth of the pseudo-disk emission at the velocity of the blue peak by comparing the average intensities of the 12CO J=1-0 ( K) and J=2-1 emission ( K) in spectra extracted by averaging over a region, after convolving the 12CO J=2-1 map to the same beam size as the J=1-0 one. We find that the 12CO J=2-1 optical depth is , implying an optical depth for 13CO J=2-1 that is a factor 60 lower.
We have made a simple squat-cylindrical, edge-on model of the pseudodisk, assuming that it has both a free-fall velocity (i.e., radial) component and rotation, with a conservation of angular momentum, using a code described in Lee et al. (2014). We have therefore assumed that , and , and adjusted and , in order to obtain a good fit to the contours in the PV plot shown in Fig. 12, as well as the observed brightness. The temperature is assumed to be , and the molecular hydrogen density, . The temperature power-law index, is assumed to be the same as in low-mass envelopes (e.g., Hogerheijde 2001, Lee et al. 2006). The density power-law exponent, , results in a constant mass infall rate, given our assumption of a fixed disk thickness and for the power-law exponent of the infall velocity above. The parameters and are adjusted to reproduce the absolute intensity of the 12CO J=2-1 emission from the pseudo-disk. All models have a disk thickness of , and an outer disk radius of (the inner radius is assumed to be much smaller than the outer radius.) The model PV plot is generated after convolving the model brightness distribution with the beam.
We find good fits with km s-1, km s-1, cm-3, and K. A representative model is shown in Fig. 12. The central stellar mass is, , and the disk mass is . This mass range is consistent with the mass of the young star associated with IRAS 05506, Sa, derived from SED modelling (Setal08: 11.2 at D=3 kpc), and scaled to our distance of 3.7 kpc.
The compact continuum source reported above (S 3.2.3), is likely to be thermal dust emission from the dense, inner region of the pseudo-disk. Without a detailed knowledge of the dust density structure, it is not possible to build a robust model of the thermal dust emission, although we can derive some rough constraints from the observed size of the continuum source. The characteristic dust emission radius, assuming no extinction or reddening of the starlight, is given by , where is the dust emissivity exponent (Sahai et al. 1999). Since , then K. We have taken K and a luminosity scaled up to D=3.7 kpc, , from Setal08.
However it is likely that there is significant absorption of the starlight by intervening dust close to the star. If we assume that, say, 20–50% of the starlight is re-radiated at an effective temperature of K by a compact source of optically-thick dust surrounding the central star, then K in order that .
From our measured 1.3 mm dust continuum flux, the above dust temperature estimate, and a dust emissivity (per unit dust mass) of 1.5 cm2 g-1 at 1.3 mm, we derive a dust mass and total mass of and (assuming the standard gas-to-dust ratio of 100). This disk mass is in reasonable agreement with that derived from our pseudo-disk kinematical model, given the uncertainties in the absolute value of the dust emissivity and our very simple thermal dust model.
4.2.2 Outflows
There are three outflows emanating from the lcation (or near vicinity of) IRAS 05506 Sa – the SEO, the HVO, and the MVO. The physical properties of the SEO have been derived earlier (§ 4.1.4); those for the HVO and MVO properties are derived below.
HVO
The HVO is seen most clearly in 12CO J=2-1 emission at km s-1and km s-1, and is aligned along °, with the blue- (red-) shifted component SW (NE) of the center. The HVO axis is thus roughly orthogonal to that of the wide-angle spray (121°–155°: Setal08). This outflow was already noted by Setal08 in their 12CO J=1-0 data, at a somewhat larger but uncertain since the spatial separation of the blue- and red-shifted components was small compared to the angular resolution of the data presented here ().
For this outflow, the 12CO J=1-0 and J=2-1 brightness temperatures in the HVO averaged over a 5.5″ box, are rather low – e.g., about 0.4 K and 1 K, respectively in the range , and about 0.1 K and 0.59 K in the range . For larger velocity offsets from the systemic velocity, the brightness temperatures are even lower. The ratio of the J=1-0 to 2-1 brightness temperature, , is about 0.34 in the 40 to 110 km s-1range (i.e., for the red-shifted outflow), and 0.47 in the -20 to -100 km s-1range (i.e., for the blue-shifted outflow), demonstrating that emission from both lines is optically thin.
The age of the HVO, estimated by dividing the separation of between blue- and red-shifted lobes of the HVO as seen in the velocity ranges km s-1 and km s-1 (Fig. 11), by the average velocity separation of 188 km s-1 between these lobes, is yr.
The total 12CO J=1-0 and 2-1 flux from the high-velocity blue-shifted (red-shifted) outflow component is 9.8 (2.5) and 80 (30) Jy-km s-1, from which we estimate that K, and the mass, scalar momentum and kinetic energy are about () , 7.2 (2.6) km s-1, and () ergs, giving a total mass, scalar momentum and kinetic energy for the HVO of 0.074 , 9.8 km s-1, and ergs.
MVO
The MVO is seen most prominently in emission in the extreme wings of the SO N,J=5,6-4,5 and SiO J=5-4 lines in the SMA data. This outflow is relatively compact, hence we have used the ext datacube for our subsequent analysis of this line.
We estimate the age of the MVO as follows. We average the moment 0 maps of the blue-wing (i.e., ) and red-wing (i.e., ) emission, and determine its size to be (FWHM). Deconvolving this with the beam, , we obtain a deconvolved size of . We divide the mean size by the average velocity separation between the blue and red-velocity intervals, i.e., 43 km s-1, giving an age yr. The (relatively uncertain) age of the MVO is thus comparable to that derived for the knots in the wide-angle spray by Setal08: e.g., 265 (D/3.7 kpc) and 225 (D/3.7 kpc) for knots K1 and K2, suggesting that these outflows are associated with the same triggering event.
Convolving the 12CO J=2-1 extsub datacube to the same angular resolution as the 12CO J=1-0 datacube, we find that the flux ratio of the 12CO J=1-0 to 2-1 in the MVO, is about 0.1 for the blue-shifted component, and 0.075 for the red-shifted component. Modeling these ratios shows that emission from both lines is optically thin, and that the kinetic temperature lies in the K range. From the total 12CO J=2-1 flux of 8.3 (14.7) Jy-km s-1 for the blue-shifted (red-shifted) component of the MVO extracted from an aperture equal to the FWHM size of the MVO, we estimate the mass, scalar momentum and kinetic energy999since the fractional flux within an aperture of size equal to the FWHM of a Gaussian distribution is 0.5 of the total to be about 0.011 (0.02 , 0.21 (0.44) km s-1, () ergs. The total mass, scalar momentum and kinetic energy in the MVO is thus 0.031 , 0.65 km s-1, ergs.
We can also use the SO data to further constrain the properties of the shocked gas in the MVO. The peak intensity of the SO N,J=5,6-4,5 source in the SMA extended array data is 1 Jy beam-1, implying a brightness temperature of 26 K, and since the source is marginally resolved at best, this should be considered a lower limit.
Since the broad emission in the four SO lines observed with the ARO (Fig. 5) likely arises in the MVO (S 3.2.2), we can use the relative ratios of the integrated fluxes in the velocity ranges for the MVO component for these lines (corrected for beam-dilution) to constrain the density and temperature of shocked gas in the MVO. As these data have modest S/N, we only use the red component of the MVO, which appears to be stronger than the blue one, to compute these ratios. We find that the uncorrected ratios for the four SO lines 1, 2, 3, and 4 (§ 3.1.2), are 0.26:0.26:0.51:1. The ratios, corrected for beam-dilution, are 0.69:0.51:0.72:1, assuming the source-size is significantly smaller than the single-dish beams. We have used the non-LTE RADEX code (van der Tak et al. 2007) to compute the line ratios for a variety of kinetic temperatures and densities, and we find that only for densities cm-3, does the excitation temperature of the 5,6-4,5 and 6,7-5,6 lines approach the kinetic temperature; at this density, we find that K for a reasonable fit to the line ratios (for lower values of , the model intensities of the lower-frequency pair, N,J=3,4-2,3 and N,J=4,3-3,2, become too large relative to the higher frequency pair, N,J=6,7-5,6 and N,J=5,6-4,5). Fits can be obtained at somewhat lower densities as well, by increasing the kinetic temperature – the lowest viable value of the density is cm-3, for which the temperature is K. The significantly higher temperatures derived from the SO lines compared to the CO lines implies that the former is tracing the hot, shocked fraction of the material in the MVO.
5. Discussion
The closest counterpart to the wide-angle bullet spray that Setal08 found towards IRAS 05506 is the explosive BN-KL wide-angle outflow in OMC1. Furthermore, in IRAS 05506, the HVO is directed along an axis orthogonal to that of the bullet-spray, a likely counterpart to the collimated outflow that emerges from Source I in BN/KL (Plambeck et al. 2009, Zapata et al. 2012) along an axis that is orthogonal to the wide-angle outflow as seen in and [FeII] line emission (Allen & Burton 1993, BCM11). However, in addition to these similarities, we note that IRAS 05506 shows three additional components, namely the pseudo-disk, the MVO and the SEO, for which there are no clear counterparts in BN/KL.
The wide-angle bullet spray shares a common axis with the pseudo-disk, and has an age comparable to that of MVO, suggesting that these three structures are intimately linked together. The rotation of the pseudo-disk may be a result of the overall rotation of cloud B for the following reasons. The observed alignment of cloud B’s long axis with that of the wide-angle outflow is unlikely to be due to the impact of the outflow on Cloud B as there is no obvious velocity gradient seen along this axis in cloud B. It is plausible that cloud B’s long axis is aligned with its rotational axis and thus cloud B is the pre-existing dense cloud core in which IRAS 05506’s pseudo-disk was formed, naturally accounting for these two structures having a common axis
We note that Cloud B shows several distinct compact sources of dense gas (e.g., , ) in emission at the systemic velocity km s-1 which do not appear to be associated with stars or outflows. In contrast, IRAS05506, which is associated with a massive star and multiple outflows, cannot be distinguished from Cloud B emission at the systemic velocity km s-1. Thus, much of the low-velocity gas in the pre-existing density peak where IRAS05506’s massive star was born, has largely been removed, presumably by the outflows that came into existence after its formation.
We briefly discuss below past and current models for the BN/KL outflows, in order to investigate their applicability to IRAS 05506. A model involving dynamical decay of a non-hierarchical system of massive stars was proposed for the BN/KL wide-angle outflow (Bally & Zinnecker 2005, Rodríguez et al. 2005, BCM11), with the two most massive components of the stellar system being BN (10-13 runaway B star) and radio Source I (a hypothetical massive binary). BCM11 proposed that these stars were ejected from their natal cloud core due to a dynamical interaction between them, and that the gravitational energy released by the formation of binary Source I powers the bullet spray.
An alternative hypothesis was proposed by Tan (2004) and Chatterjee & Tan (2012) in which the BN-KL outflow source is produced by the chance encounter of a runaway star (BN) with the KL star-forming core. According to this hypothesis, BN was supposedly ejected from the Ori C system 4500 yr ago and its interaction with the KL cloud within the last 1000 years has produced recently enhanced accretion and outflow activity (i.e., the bullet spray) from Source I.
The major weaknesses in each of the above models have been summarized in a recent study by Luhman et al. (2017). In the dynamical decay model, the mass of for Source I implied by conservation of momentum with BN alone is much larger than the dynamical mass of Source I (7 : Plambeck & Wright 2016). In the chance-encounter model, there are two problems – first, BN appears to be younger than the Trapezium stars, and second, this model does not explain the large motion of Source I.
Goddi et al. (2011: Getal11) discuss the above models and two additional ones (nos. 1–4 in § 6 of their paper). The latter involve a close passage between two (initially unbound) protostars, BN and Source I. In the first of these (no. 2), this passage produces enhanced accretion in the disk of Source I, but Goddi et al. reject this model, since a binary encounter cannot produce stellar ejection, as appears to be the case for BN and Source I. In the second one (no. 4), favored by Getal11, Source I was originally a soft, massive (20 ) binary which got hardened as a result of the encounter with BN, and the resulting increase in gravitational potential energy powered both the wide-angle spray and the ejection of BN and Source I.
Luhman et al. (2017) provide new evidence that resolves the mass discrepancy for Source I mentioned above, thus strengthening the dynamical decay model as the likely one for the BN/KL explosive outlow. Specifically, they find that source x (from Lonsdale et al. 1982) in the KL nebula, which has a high proper motion, was involved in the dynamical decay that separated Source I from BN, and source x’s momentum reduces the momentum requirement for Source I, bringing the latter’s mass inferred from momentum balance into consistency with its dynamical mass. However, the relatively large value of the disk mass in Source I ( ) is difficult to obtain in the dynamical decay model, either from retention of a pre-existing disk or re-formation in the short time that has elapsed after the decay (500 yr) (Plambeck & Wright 2016).
Since we have not identified the multiple individual members of a dynamically-decaying stellar cluster that may be associated with IRAS 05506, we cannot yet test the dynamical decay model for this source. We note, though, that near-IR HST imaging shows the presence of several faint stars (stars fs1, fs2, fs3, fs4 in Fig. 2 of Setal08) and bright stars (e.g., Sb: see Figs. 2 and 5 of Setal08) within a radius around the central optical/infrared source of IRAS 05506, Sa, some of which may be members of such a cluster. Second-epoch HST imaging observations can be used to look for proper motions of the stars found in the near vicinity of Sa. If any of the stars around the IRAS 05506 outflow source was ejected from a common center somewhere in the vicinity of IRAS 05506 Sa as a result of the dynamical decay, then from their typical angular offsets of about from Sa, we estimate that the corresponding stellar proper motions would be in the range 8–20 mas yr-1. The resulting total proper motion of 128-320 mas over 16 yr between epoch 1 and a future observing epoch 2, is easily measureable.
The rather long age of the SEO may argue against the dynamical decay model of BCM11 for IRAS 05506. In this model, the collimated outflow from Source I results from a disk that is formed after the explosive disintegration event producing the wide angle spray101010The apparent major axis of the disk in Source I (and in BN) is aligned with Source I’s (BN’s) proper motion, and BCM11 explain this as the result of these disks being formed by Bondi-Hoyle accretion onto these stars from the cloud through which they are moving, assuming the latter has a significant density or velocity gradient orthogonal to the stellar motion (see last para in Section 4.2 of their paper). Thus the collimated outflow in Source I is younger than the wide angle spray, i.e., yr. However the SEO’s age of yr suggests that the HVO (the presumed counterpart to the collimated outflow from Source I), which has likely produced the SEO (§ 4.2.2), has been in operation for an equally long time. Thus, contrary to the expectation of the dynamical decay model, the HVO, and thus the disk that drives it, is much older than the bullet-spray in IRAS 05506111111An obvious caveat to this line of reasoning is that the disk in the IRAS 05506 source may be long-lived, having survived the violent distintegration process.. If the chance-encounter model does apply to IRAS 05506, then the origin of the MVO and bullet spray is due to a sudden increase in the accretion rate of the pseudo-disk resulting from a chance-encounter of a runaway star with the latter.
A model involving close passage between two protostars (no. 2 of Getal11) may also be applicable IRAS 05506, since (unlike BN/KL) we do not have any evidence for a stellar ejection in its case. If so, then one of the two protostars in IRAS 05506 is the massive star associated with the pseudo-disk (i.e., Sa), and the other is a star with a disk that produces the HVO. The observed specific orientations of the axes of the pseudo-disk and the HVO (which are roughly orthogonal) would then be purely coincidental.
6. Conclusions
We have carried out a study of molecular-line and continuum emission from the interstellar bullet source IRAS 05506 and its environment using both single-dish
and interferometric observations. Our major conclusions are listed below:
-
1.
The central optical/IR source Sa in IRAS 05506 is located at the north-east periphery of a dense, trapezoidal shaped cloud (cloud B) with an extent of about (at its half-intensity countour). Cloud B lies within the dense core (Cloud A core, size ) of a large cloud (cloud A, size ). The radial velocity of clouds A and B is 6 km s-1. The Cloud A dense core is prominently seen in thermal dust emission at wavelengths in the µm range, as observed with the Herschel/SPIRE camera.
-
2.
A very extended bipolar outflow (SEO), of size with its axis aligned along , appears to emanate from the central source in IRAS 05506.
-
3.
The central source consists of a pseudo-disk and two compact outflow components, a a high-velocity outflow (HVO) and a medium-velocity outflow (MVO). The HVO (MVO), seen most clearly in the wings of the 12COJ=2-1 (SO N,J=5,6-4,5 and SiO J=5-4) emission lines, is compact with an angular size (), and has a (projected) outflow velocity of km s-1 ( km s-1).
-
4.
Since the sense of the velocity gradient, the axis orientation, as well as the scalar momentum, of the HVO and SEO are roughly similar, the SEO is likely a result of the interaction of the HVO with the surrounding ambient cloud material.
-
5.
The MVO emission produces prominent broad wing emssion in three of the four SO lines observed. The SO emission comes from a hot, shocked gas in the MVO at relatively high densities cm-3 and temperatures ( K). The lowest feasible value of the density is cm-3, but then a high temperature ( K) is needed.
-
6.
The pseudo-disk has a size of about 9,600–11,100 AU, and a thickness of 7,400 AU. A simple disk model with infall and rotation that fits its observed position-velocity structure gives a central stellar mass of , and a disk mass of . The disk mass is consistent, within uncertainties, with that derived from the millimeter-wave thermal dust emission (1.7 ).
-
7.
The wide-angle bullet spray shares a common axis with the pseudo-disk, and has an age comparable to that of MVO (few hunded years), suggesting that these three structures are intimately linked together.
-
8.
A second-epoch imaging program with HST will be able to provide proper motions of nearby stars and help in distinguishing between three possible models (dynamical decay of a stellar cluster, chance encounter of a runaway star with a dense cloud, and close passage of two protstars) to explain the IRAS 05506 outflow source.
References
- Allen & Burton (1993) Allen, D. A., & Burton, M. G. 1993, Nature, 363, 54
- Bally et al. (2011) Bally, J., Cunningham, N. J., Moeckel, N., et al. 2011, ApJ, 727, 113
- Bally et al. (2017) Bally, J., Ginsburg, A., Arce, H., et al. 2017, ApJ, 837, 60
- Bally & Zinnecker (2005) Bally, J., & Zinnecker, H. 2005, AJ, 129, 2281
- Bieging & Peters (2011) Bieging, J. H., & Peters, W. L. 2011, ApJS, 196, 18
- Chatterjee & Tan (2012) Chatterjee, S., & Tan, J. C. 2012, ApJ, 754, 152
- Goddi et al. (2011) Goddi, C., Humphreys, E. M. L., Greenhill, L. J., Chandler, C. J., & Matthews, L. D. 2011, ApJ, 728, 15
- Goldsmith et al. (1997) Goldsmith, P. F., Bergin, E. A., & Lis, D. C. 1997, ApJ, 491, 615
- Hartigan et al. (1987) Hartigan, P., Raymond, J., & Hartmann, L. 1987, ApJ, 316, 323
- Hogerheijde (2001) Hogerheijde, M. R. 2001, ApJ, 553, 618
- Lee et al. (2014) Lee, C.-F., Hirano, N., Zhang, Q., et al. 2014, ApJ, 786, 114
- Lee et al. (2006) Lee, C.-F., Ho, P. T. P., Beuther, H., et al. 2006, ApJ, 639, 292
- Lonsdale et al. (1982) Lonsdale, C. J., Becklin, E. E., Lee, T. J., & Stewart, J. M. 1982, AJ, 87, 1819
- Luhman et al. (2017) Luhman, K. L., Robberto, M., Tan, J. C., et al. 2017, ApJ, 838, L3
- Lumsden et al. (2013) Lumsden, S. L., Hoare, M. G., Urquhart, J. S., et al. 2013, ApJS, 208, 11
- Molinari et al. (2016) Molinari, S., Schisano, E., Elia, D., et al. 2016, A&A, 591, A149
- Plambeck et al. (2009) Plambeck, R. L., Wright, M. C. H., Friedel, D. N., et al. 2009, ApJ, 704, L25
- Plambeck & Wright (2016) Plambeck, R. L., & Wright, M. C. H. 2016, ApJ, 833, 219
- Podio et al. (2015) Podio, L., Codella, C., Gueth, F., et al. 2015, A&A, 581, A85
- Qiu et al. (2008) Qiu, K. et al. 2008, ApJ 685, 1005
- Sahai et al. (2008) Sahai, R., Claussen, M., Sánchez Contreras, C., Morris, M., & Sarkar, G. 2008, ApJ, 680, 483
- Sahai et al. (1999) Sahai, R., te Lintel Hekkert, P., Morris, M., Zijlstra, A., & Likkel, L. 1999, ApJ, 514, L115
- Sridharan et al. (2002) Sridharan, T. K., Beuther, H., Schilke, P., Menten, K. M., & Wyrowski, F. 2002, ApJ, 566, 931
- Sánchez Contreras et al. (2008) Sánchez Contreras, C., Sahai, R., Gil de Paz, A., & Goodrich, R. 2008, ApJS, 179, 166-194
- Rodríguez et al. (2005) Rodríguez, L. F., Poveda, A., Lizano, S., & Allen, C. 2005, ApJ, 627, L65
- Sánchez Contreras & Sahai (2012) Sánchez Contreras, C., & Sahai, R. 2012, ApJS, 203, 16
- Tan (2004) Tan, J. C. 2004, ApJ, 607, L47
- Tenenbaum et al. (2006) Tenenbaum, E. D., Apponi, A. J., Ziurys, L. M., et al. 2006, ApJ, 649, L17
- Tenenbaum et al. (2010) Tenenbaum, E. D., Dodd, J. L., Milam, S. N., Woolf, N. J., & Ziurys, L. M. 2010, ApJS, 190, 348
- van der Tak et al. (2007) van der Tak, F. F. S., Black, J. H., Schöier, F. L., Jansen, D. J., & van Dishoeck, E. F. 2007, A&A, 468, 627
- Wilson (1999) Wilson, T. L. 1999, Rep. Prog. Phys., 62, 143
- Zapata et al. (2009) Zapata, L. A., Schmid-Burgk, J., Ho, P. T. P., Rodríguez, L. F., & Menten, K. M. 2009, ApJ, 704, L45
- Zapata et al. (2012) Zapata, L. A., Rodríguez, L. F., Schmid-Burgk, J., et al. 2012, ApJ, 754, L17
- Zapata et al. (2013) Zapata, L. A., Schmid-Burgk, J., Pérez-Goytia, N., et al. 2013, ApJ, 765, L29
- Zhang et al. (2008) Zhang, Y., Kwok, S., & Dinh-V-Trung 2008, ApJ, 678, 328-346
- Zinnecker & Yorke (2007) Zinnecker, H., & Yorke, H. W. 2007, ARA&A, 45, 481
| Lines, Cont | Freq | Array | Beam (MajMin) | PA | Date |
|---|---|---|---|---|---|
| GHz | deg. | ||||
| SMA Observations | |||||
| CO 2-1aaThe 13CO (220.398 GHz) and C18O (219.560 GHz) lines were also observed simultaneously; and the beam-sizes scale inversely with their frequencies. | 230.538 | Subcompact | 20-Mar-2010 | ||
| CO 2-1aaThe 13CO (220.398 GHz) and C18O (219.560 GHz) lines were also observed simultaneously; and the beam-sizes scale inversely with their frequencies. | 230.538 | Extended | 09-Feb-2012 | ||
| CO 2-1aaThe 13CO (220.398 GHz) and C18O (219.560 GHz) lines were also observed simultaneously; and the beam-sizes scale inversely with their frequencies. | 230.538 | Ext+Sub | … | ||
| SiO 5-4 (v=0) | 217.105 | Ext+Sub | … | ||
| SO 5,6-4,5 | 219.949 | Ext+Sub | … | ||
| Continuum | 225 | Ext+Sub | … | ||
| OVRO Observations | |||||
| CO 1-0 | 115.271 | H+E+L | 31-Oct-2003 | ||
| Continuum | 112 | H+E+L | 31-Oct-2003 |
| Lines | Freq | Tel. | Tsys | aaBeam-efficiencies for the ARO SMT and KP12m are taken from Tenenbaum et al. (2006, 2010), and Zhang et al. (2008). The CSO beam-efficiency was taken from http://www.submm.caltech.edu/cso/receivers/beams.html. | Backend | Date |
|---|---|---|---|---|---|---|
| GHz | K | |||||
| CO 1-0 | 115.271 | ARO KP12m | 557 | 0.83 | 12M-MACbbThe Millimeter Autocorrelator (MAC) is a correlation spectrometer, and a number of different spectral resolutions are available. The intrinsic spectral resolution (bandwidth) was typically 24.4 kHz (150 MHz). Spectra were post-processed to a lower spectral spectral resolution to increase the S/N ratio as appropriate. | 18-Nov-2007 |
| CO 2-1 | 230.538 | ARO SMT | 144 | 0.74 | CTSccThe Chirp Transform Spectrometers (CTS) has a bandwidth of 215 MHz, and a spectral resolution of 60–80 kHz. Spectra were post-processed to lower spectral spectral resolutions to increase the S/N ratio as appropriate. | 18-Feb-2008 |
| CO 3-2 | 345.796 | ARO SMT | 1716 | 0.70 | CTS | 20-Feb-2008 |
| CO 4-3 | 461.041 | CSO | 2213 | 0.53 | FFTSddThe Fast Fourier Transform Spectrometer (FFTS), was used in its wide-band mode, which gave a bandwidth of 1000 MHz, and a channel spacing of 122 kHz. Spectra were post-processed to lower spectral spectral resolutions to increase the S/N ratio as appropriate. | 06-Mar-2013 |
| 13CO 1-0 | 110.201 | ARO KP12m | 207 | 0.83 | 12M-MAC | 20-Nov-2007 |
| 13CO 2-1 | 220.399 | ARO SMT | 163 | 0.74 | CTS | 19-Feb-2008 |
| C18O 1-0 | 109.782 | ARO KP12m | 222 | 0.83 | 12M-MAC | 21-Nov-2007 |
| SO 3,4-2,3 | 138.179 | ARO KP12m | 200 | 0.79 | 12M-MAC | 25-Nov-2007 |
| SO 4,3-3,2 | 158.972 | ARO KP12m | 205 | 0.76 | 12M-MAC | 28-Feb-2008 |
| SO 5,6-4,5 | 219.949 | ARO SMT | 150 | 0.74 | CTS | 26-Jan-2008 |
| SO 6,7-5,6 | 261.844 | ARO SMT | 217 | 0.74 | CTS | 19-Feb-2008 |
| SO2 4(3,1)-4(2,2) | 221.965 | ARO SMT | 149 | 0.74 | CTS | 18-Feb-2008 |
| SO2 12(1,12)-11(1,11) | 255.553 | ARO SMT | 181 | 0.74 | CTS | 19-Feb-2008 |
| HCO+ 1-0 | 89.1895 | ARO KP12m | 322 | 0.89 | 12M-MAC | 29-Nov-2007 |
| HCO+ 3-2 | 267.558 | ARO SMT | 209 | 0.74 | CTS | 19-Feb-2008 |
| CS 3-2 | 146.969 | ARO KP12m | 197 | 0.76 | 12M-MAC | 20-Nov-2007 |
| H2CO 2(1,1)-1(1,0) | 150.498 | ARO KP12m | 202 | 0.76 | 12M-MAC | 22-Jan-2008 |
| Name | Range | Size | Tracer | DataSet | |
|---|---|---|---|---|---|
| (km s-1) | (′′) | () | |||
| Central Star(s) | … | … | … | … | … |
| Pseudo-disk | to 20 | 130bb of symmetry axis | CO(2-1) | SMA Ext | |
| MVO | to & 20 to 40 | … | SO, SiO | SMA Ext | |
| HVO | to & 40 to 120 | 1.4 | 40bb of symmetry axis | CO(2-1) | SMA Ext+Sub |
| Bullet SprayccData from Sahai et al. (2008) | to | 5.3 | H | HST/WFC | |
| SEO | 0 to 5 & 7 to 12 | 52 | 45bb of symmetry axis | CO(2-1) | SMT |
| Cloud B | 5 to 7 | 14 | 135dd of long axis | 13CO(2-1), 250 µm | SMA Ext+Sub, HSO |
| Cloudlet B1 | 7 | … | CO J=3-2, 4-3 | SMT, CSO | |
| Cloud A core | 5 to 7 | 125 | 45ee of hypotenuse, of this right-angled triangular-shaped structure | 13CO(2-1), 250–500 µm | SMT, HSO |
| Cloud A | 5 to 7 | ccData from Sahai et al. (2008) | 12CO(2-1) | SMT | |
| ” ” ” | 5 to 7 | … | 12CO(1-0) | KP12m |
| Name | Age | Mass | Scal.Mom. | Energy |
|---|---|---|---|---|
| (yr) | () | ( km s-1) | (erg) | |
| Central Star(s) | … | … | … | |
| Pseudo-disk | … | … | … | |
| MVO | 360 | 0.031 | 0.65 | 0.29 |
| HVO | 130 | 0.074 | 9.8 | 7.8 |
| Bullet SprayaaFor knot , using data from Sahai et al. (2008), scaled to a distance D=3.7 kpc | 230 | 0.018 | 0.074 | |
| SEO | 9300 | 1.6 | 4.7 | 0.3 |