Dense CO in Mrk 71-A: Superwind Suppressed in a Young Super Star Cluster
Abstract
We report the detection of CO() coincident with the super star cluster (SSC) Mrk 71-A in the nearby Green Pea analog galaxy, NGC 2366. Our NOEMA observations reveal a compact, pc, molecular cloud whose mass () is similar to that of the SSC, consistent with a high star-formation efficiency, on the order of 0.5. There are two, spatially distinct components separated by 11 . If expanding, these could be due to momentum-driven, stellar wind feedback. Alternatively, we may be seeing the remnant infalling, colliding clouds responsible for triggering the SSC formation. The kinematics are also consistent with a virialized system. These extreme, high-density, star-forming conditions inhibit energy-driven feedback; the co-spatial existence of a massive, molecular cloud with the SSC supports this scenario, and we quantitatively confirm that any wind-driven feedback in Mrk 71-A is momentum-driven, rather than energy-driven. Since Mrk 71-A is a candidate Lyman continuum emitter, this implies that energy-driven superwinds may not be a necessary condition for the escape of ionizing radiation. In addition, the detection of the nebular continuum emission yields an accurate astrometric position for the Mrk 71-A. We also detect four other massive, molecular clouds in this giant star-forming complex.
1 Introduction
How and when do newborn super star clusters (SSCs), like the progenitors of globular clusters, emerge from dense gas and clear their surroundings? The classical model for starburst mechanical feedback holds that stellar winds and supernovae inside SSCs collide and merge to form strong superwinds (Chevalier & Clegg, 1985). This hot ( K), shock-heated gas carries off most of the newly synthesized heavy elements produced by the massive stars and their supernovae. In dwarf galaxies, these metals could be ejected into the intergalactic medium, retarding chemical evolution of the host galaxy. However, more recent developments in our understanding of both massive star feedback and chemical abundance patterns suggest that this picture is more complex. Theoretical work suggests that catastrophic cooling and large ambient gas pressure may inhibit the development of superwinds and wind-driven superbubbles (Silich et al., 2007; Silich & Tenorio-Tagle, 2017), and radiation feedback is suggested to be important in the youngest and densest clusters (e.g., Freyer et al., 2003; Krumholz & Matzner, 2009). On the observational side, multiple stellar populations with differing abundances are now ubiquitous in individual globular clusters (e.g., Gratton et al., 2012), suggesting that star formation may have recurred in these objects. So then what factors dominate the interaction between a brand-new SSC and its gaseous environment? Observations of newly born SSCs that are still clearing their gas are vital to revealing these processes. Here, we present remarkable CO observations revealing that a young, SSC, Mrk 71-A, located in a relatively clear environment, nevertheless coexists with an extremely compact, molecular cloud of comparable mass.

Mrk 71 is a well-studied starburst complex in the nearby barred Im galaxy, NGC 2366, at a distance of 3.4 Mpc (Tolstoy et al., 1995). It hosts two SSCs, Mrk 71-A and B (Figure 1). Mrk 71-B is an exposed cluster with mass (Micheva et al., 2017) and age of Myr constrained by the presence of classical WR stars (Drissen et al., 2000). Mrk 71-A, however, strongly dominates the complex, producing about ten times more ionizing photons, implying an SSC stellar mass of (Micheva et al., 2017; Drissen et al., 2000). To date, Mrk 71-A has only been detected as a compact, extreme excitation H ii region. No stellar features are spectroscopically detected, but strong nebular continuum is observed, including inverse Balmer and Paschen jumps (e.g., González-Delgado et al., 1994; Guseva et al., 2006). It is marginally spatially resolved with the Hubble Space Telescope (HST), implying a radius of pc. Thus Mrk 71-A has an extremely high nebular surface brightness and is remarkably similar to a massive, ultracompact H ii region (Drissen et al., 2000), but hosting a newly-formed, embedded cluster.
The Mrk 71/NGC 2366 system is especially interesting owing to its status as a local analog to extreme “Green Pea” galaxies. These are objects at (Cardamone et al., 2009) that represent a compelling class of local, candidate Lyman continuum-emitting galaxies. They are low-mass, compact starbursts characterized by high ratios of [O iii]5007/[O ii] and H equivalent widths Å, and they are in many ways good analogs of high-redshift starbursts. We showed that among these objects, those with the most extreme ionization parameters are strong candidate Lyman continuum emitters (LCEs; Jaskot & Oey, 2013). Our prediction was dramatically confirmed when Izotov et al. (2016a, b) detected Lyman continuum emission from all five of their targeted Green Peas, thereby instantly doubling the number of confirmed local LCEs. The properties of Mrk 71 are quantitatively consistent with those of Green Peas and, like those objects, Mrk 71 shows a variety of features that are consistent with optically thin Lyman continuum (Micheva et al., 2017). Thus, Mrk 71/NGC 2366 may also offer a unique opportunity to study what properties facilitate the escape of ionizing radiation.
2 CO Observations
We obtained observations of Mrk 71 on 2016 December 14 and 15, with the Northern Extended Millimeter Array (NOEMA) at Plateau de Bure, in the CO () line at 230.538 GHz, with a local standard of rest velocity of 90 . The observations were carried out with 8 antennae in Configuration A, with baselines between 45 m and 760 m. We used the Widex correlator, with total bandwidth of 3.6 GHz and native spectral resolution 1.95 MHz (2.6 ). The quasars 0716+714 and 0836+710 were observed as phase and amplitude calibrators, 3C 84 as bandpass calibrator, and the stars MWC 349 and LkHA 101 (1.91 Jy and 0.56 Jy at 230.5 GHz) as absolute flux calibrators. System temperatures were between 90 and 240 K, and the precipitable water vapor 2–3 mm. Data reduction, calibration and imaging were performed with CLIC and MAPPING software of GILDAS111http://www.iram.fr/IRAMFR/GILDAS/, using standard procedures. Images were reconstructed using natural weighting, resulting in a synthesized beam of 048035 (PA=55.8∘) and rms noise in the CO map of 2.2 mJy beam-1 in a 2.6 channel. The continuum map has rms noise of 75 Jy beam-1.
| CloudaaValues measured from pixels with fluxes , unless otherwise specified. “Blue” and “red” denote the components of Cloud 1. | Size | bbFWHM of CO line. | Peak | Flux | Flux massccMass based on CO intensity estimated using . The errors shown correspond to measurement uncertainty only, while is uncertain to a factor of a few. | Virial massddVirial mass calculated as (MacLaren et al., 1988), where the cloud radius is half the value in Column 2. Errors shown are estimated only from the error in the fit of . | ||
|---|---|---|---|---|---|---|---|---|
| pc | [km/s] | [km/s] | [mJy] | [mJy km/s] | [K km/s] | [] | [] | |
| 1 | 9.0 | 77.70.7 | 15.91.7 | 10.7 1.0 | 18125 | 132 | 142 | 225 |
| 1 (3) | 5.5 | 78.10.7 | 16.11.7 | 7.70.7 | 13118 | 152 | 101 | 143 |
| 1-blue | 10.7 | 73.60.7 | 6.31.5 | 12.02.0 | 8024 | 5.9 | 6.21.8 | 4.02.0 |
| 1-red | 5.4 | 82.61.2 | 9.02.8 | 9.31.4 | 8931 | 6.62.3 | 6.92.4 | 4.22.6 |
| 2 | 8.5 | 78.70.8 | 15.32.0 | 13.11.4 | 21336 | 122 | 163 | 195 |
| 3 | 9.7 | 75.00.4 | 8.41.0 | 20.12.0 | 18028 | 143 | 142 | 5.71.3 |
| 4 | 8.9 | 79.10.4 | 7.61.0 | 17.02.0 | 13725 | 92 | 112 | 4.61.3 |
| 5 | 8.6 | 73.50.4 | 6.10.9 | 15.61.9 | 10119 | 73 | 7.81.5 | 3.00.9 |
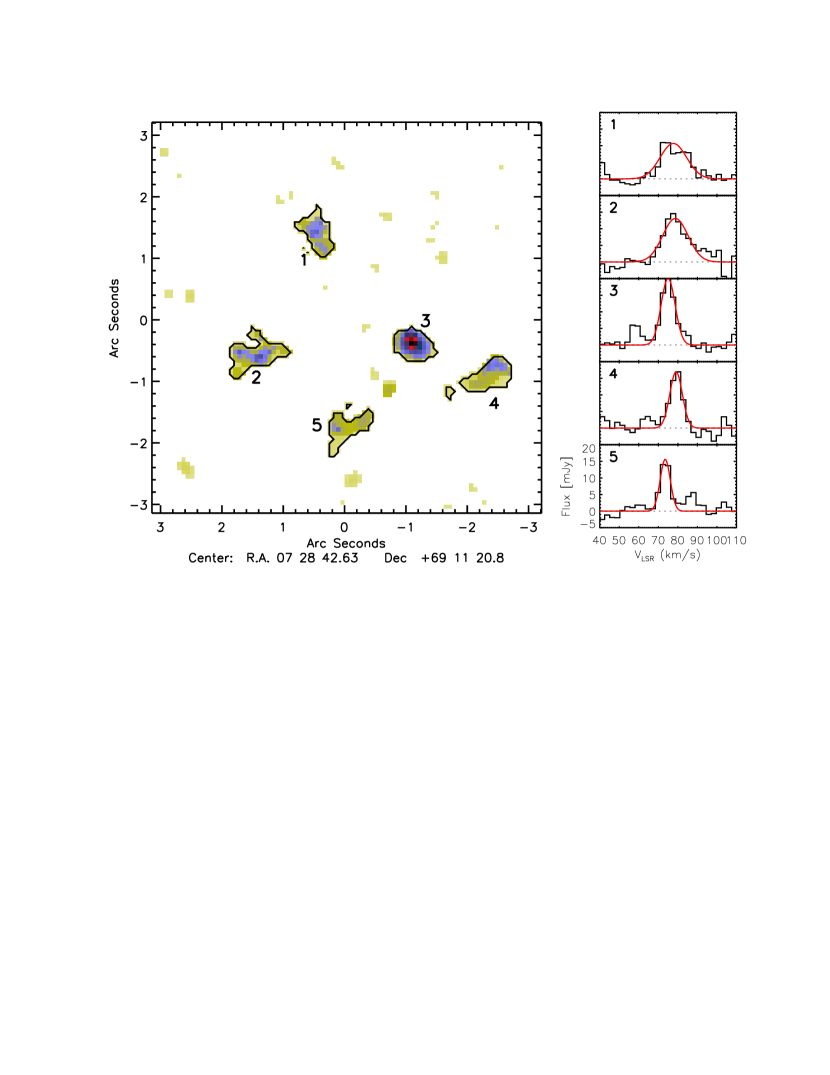
The 22 field of view encompasses the entire Mrk 71 complex. Figure 1 shows a 3-color image using HST/WFC3 data in [O ii] (F373N), [O iii] (F502N), and blue continuum (F438W) superposed with red contours showing the continuum emission at 231 GHz within a bandwidth of 3.6 GHz, and black contours showing line emission of CO(2–1). Five sources are detected, one of which we determine coincides with Mrk 71-A, as follows. The HST absolute astrometry has uncertainty of , while the NOEMA astrometry is good to 0.05. However, since Mrk 71-A is a strong nebular continuum source, our detected mm source must correspond to this target. Flux densities for Mrk 71-A from the VLA reported at 3.6, 6, and 20 cm by Chomiuk & Wilcots (2009) with angular resolution of 3.7 yield a spectral index of –0.13, indicating a thermal H ii region continuum. Our NOEMA continuum observation of 0.71 mJy is less than the predicted value of 3.35 mJy extrapolated from the VLA data. However, we only detect the high surface-brightness core of Mrk 71-A in the NOEMA continuum (Figure 1). Since the VLA beam diameter is about 10 larger than for our observations, the extended nebular emission dominates the flux in the large aperture. The non-detection of any other NOEMA continuum source within the VLA beam and the agreement of the flux densities with a thermal power-law index therefore indicate that the observed emission must be due to the same source, Mrk 71-A. In Figure 1, we have therefore aligned the data so that the mm continuum peak necessarily coincides with the optical H ii region centroid. The position for Mrk 71-A is thus: (J2000) with uncertainty of 0.05.
Figure 1 shows a detection of CO(2–1) coincident with the thermal continuum source. The first two lines of Table 1 show the source parameters based on calculating the flux above and . Mrk 71 has (Izotov et al. 1997). For this low, SMC-like value, the transition ratio CO(2–1)/CO(1–0) is , observed in SMC H ii regions (Rubio et al. 1993), and similar ratios are seen in 30 Doradus (; Sorai et al. 2001). Thus, we take . The CO-to-H2 conversion factor from CO(1–0), , is quite uncertain at this low metallicity; based on studies of other blue compact dwarfs (Amorín et al., 2016; Bolatto et al., 2013; Leroy et al., 2011), we adopt , yielding a total molecular gas mass of . This cloud mass is similar to our estimated mass of for the enshrouded SSC, based on the H luminosity (Micheva et al., 2017). Taken together, the masses agree well with the virial mass (Table 1).
However, we caution that is uncertain to a factor of a few. If the system is not virial, the cloud mass may be a substantial upper limit. On the other hand, the Mrk 71-A system strongly resembles the molecular cloud NGC 5253-D1, which is associated with a radio supernebula and SSC (Turner et al., 2015, 2017). Turner et al. (2017) suggest that the SSC may be overluminous for its mass; this may also apply to Mrk 71-A, where we indeed suggested possible evidence for very massive stars (VMS) of (Micheva et al., 2017). If these dominate the SSC luminosity, then its stellar mass would be overestimated. In any case, the relative masses of the cloud and SSC are consistent with an extremely high star-formation efficiency (SFE), on the order of 0.5. This is again similar to NGC 5253-D1 (Turner et al., 2015) and SGMC 4/5-B1 in the Antennae (Herrera & Boulanger, 2017).
We detect four other sources at . All are in the region south of Knot A, within 50 pc of the SSC (Figures 1, 2), with no continuum detections. These are all molecular clouds similar in mass to Knot A, with parameters given in Table 1. Source 2 has a large line width, similar to Source 1 (Figure 2). Source 3 has the highest peak intensity, but shows no evidence of star formation.
3 Feedback in Mrk 71-A
Young SSCs are thought to clear their environment through massive star feedback, but the details of how and when this takes place are poorly understood. Alternatively, extremely high SFE may itself account for some gas clearing (Kruijssen, 2012). Typically, feedback is characterized by a model in which the mechanical energy of stellar winds and supernova ejecta is thermalized, leading to a high central overpressure. The hot, shocked gas flows away from the cluster as a superwind, colliding with the ambient ISM and forming a bubble that grows in an energy-conserving mode (Weaver et al., 1977; Mac Low & McCray, 1988). Through photoionization and radiation pressure, Lyman continuum (LyC) photons from the hot, massive stars also generate feedback effects that can be of comparable magnitude to mechanical feedback, especially for the youngest and most compact SSCs (e.g., Freyer et al., 2003; Krumholz & Matzner, 2009; Dale, 2015, but see Silich & Tenorio-Tagle 2013; Martínez-González et al. 2014). It is essential to understand how these processes interact to determine the duration of the clearing process, and how the gas properties and conditions evolve. Mrk 71-A offers a unique opportunity to test feedback theories. Its mass, compactness, and extreme youth place it in the critical regime where the dominant processes are unclear, and its proximity, with an unobscured line of sight, allows high quality estimates of the physical parameters for quantitative modeling.
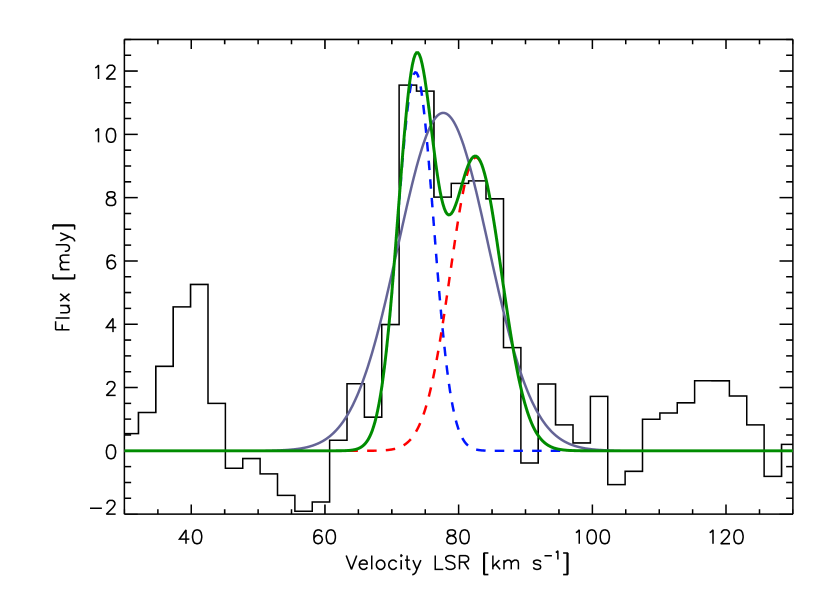
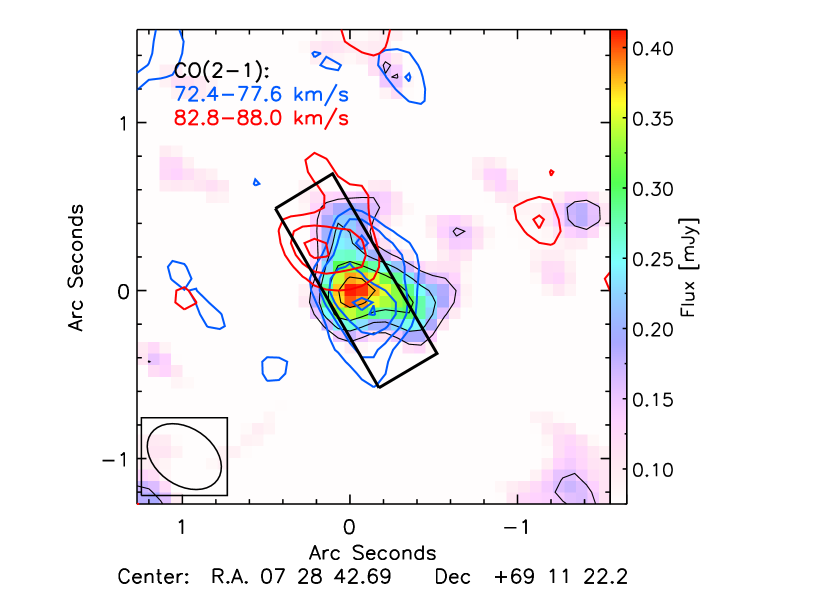
The observed CO(2–1) emission line is double-peaked, with a velocity separation of 11.1 (Figure 3a). Figure 3b shows the spatial distribution of the two components, showing that they are not fully coincident. At face value, the peaks are offset from the continuum peak by about 1.7 pc (0.10) and 6.0 pc ) in projection, for the blue and red components, respectively (Figure 3b), although the beam size should be noted. These may be separate, distinct clouds, with 7 pc (0.42) separation, in projection. Both components appear to be extended, although the red component is marginally resolved at the 3 level. The blue component is resolved, and encompasses the continuum peak in projection, allowing for the possibility that much molecular gas is cospatial with the SSC stars. The kinematics, line fluxes, and implied molecular masses of the two components are given in Table 1, based on gaussian fitting of the spectral lines.
To explain the presence of of molecular gas at such close quarters to the young SSC, a first impression is that the gas could simply be the cluster’s natal material that is still in the process of being destroyed through conventional mechanical and radiation feedback. However, in high-density star-forming conditions, these feedback processes are counteracted by radiative cooling and larger intra-cloud gas pressure. Our new observations support this dynamic, also seen in M82-A1 (Smith et al., 2006).
If the two CO components represent an outflow, they could correspond to mechanical feedback with an expansion radius and velocity of pc and , respectively. If the observed molecular gas corresponds to material swept up within a 3.5-pc radius, the total molecular mass of corresponds to an original uniform density of , a reasonable average value for the dense core of a massive, giant molecular cloud. At these high densities, cooling dictates that either the wind cannot form (Silich & Tenorio-Tagle, 2017), or the system transitions rapidly from the energy-dominated to momentum-dominated regime (e.g., Mac Low & McCray, 1988). The age, (Myr), of a momentum-driven shell can be estimated as Myr. The growth of the shell radius is given by (e.g., McCray & Snow, 1979),
| (1) |
where and are the mechanical luminosity and wind velocity in units of and , respectively, providing the impetus. For , appropriate to massive star winds, this yields , a value fully consistent with that expected for a young, cluster at SMC metallicity. We further confirm that the observed dynamics are inconsistent with a conventional, energy-driven bubble. In this case, the expansion velocity , implying an age of 0.4 Myr. For an adiabatic shell growth (e.g., McCray & Snow, 1979),
| (2) |
the same parameters imply , over an order of magnitude too small. Thus, energy-driven feedback does not dominate, supporting a catastrophic cooling scenario (Mac Low & McCray, 1988; Silich et al., 2007; Krumholz & Matzner, 2009). The importance of cooling is also confirmed by 3-D hydrodynamic simulations (Krause & Diehl, 2014; Yadav et al., 2017). It is therefore likely that radiation dominates the SSC feedback (e.g., Freyer et al., 2003), especially if its age is Myr. The extinction-corrected H luminosity is (Micheva et al., 2017), which is about larger than the total wind power inferred above. Although the bipolar morphology implies only partial shells, this does not affect the basic mechanical feedback calculations; certainly adiabatic, pressure-driven feedback is impossible with partial shells. We will quantitatively examine the possible feedback mechanisms in detail in a future work.
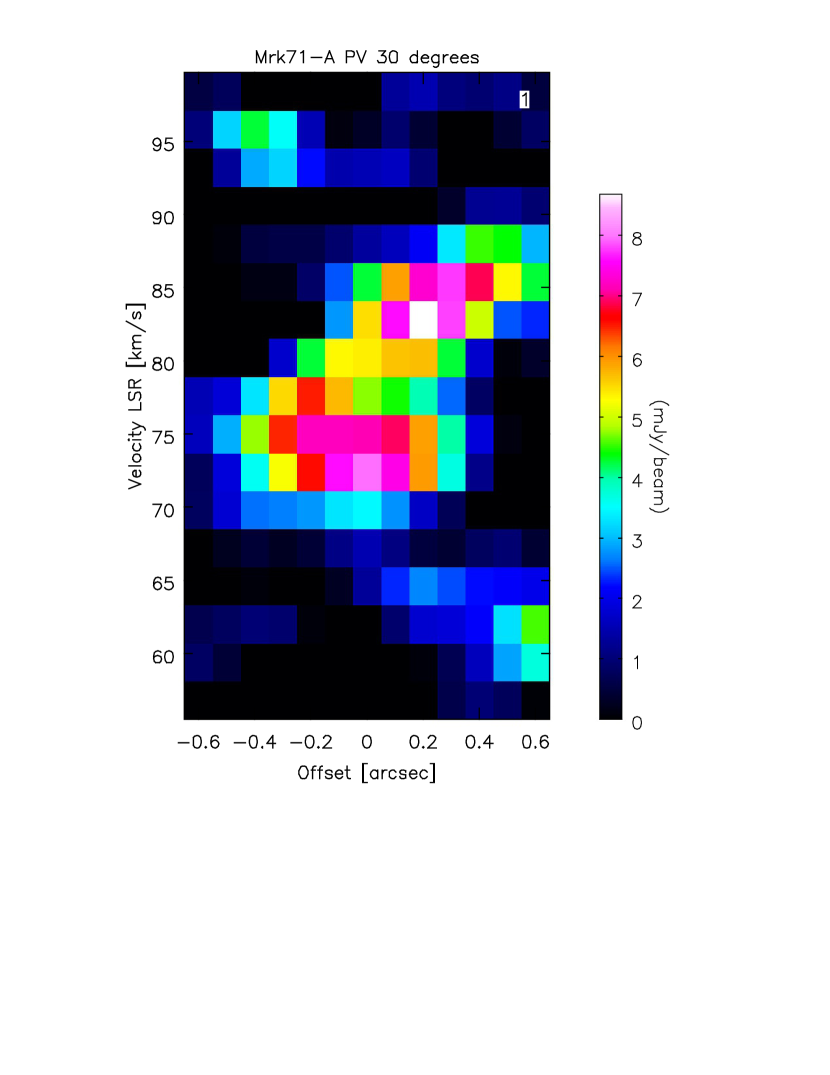
Alternatively, the two molecular components could be infalling, and perhaps be the remnants of two molecular clouds whose collision triggered the formation of the SSC. This scenario has been suggested for other SSCs with similar CO morphology by, e.g., Fukui et al. (2016). Figure 4 shows a position-velocity (PV) diagram for Mrk 71-A, showing the projected kinematic structure. Haworth et al. (2015) find from their simulated observations of colliding clouds that the existence of “broad bridge” material between the blue and red components is consistent with colliding clouds. The existence of emission between the blue and red components in Figure 4 is morphologically similar to their models, although our spatial resolution is relatively low. The components could also represent random accretion infall of vestigial material from the natal molecular environment.
Taken as physically distinct clouds, their kinematics are also fully consistent with a virialized system, together with the SSC, as noted above. The molecular gas is likely clumpy, perhaps dominated by the two unresolved, compact, massive clouds. Since both peaks are offset from the continuum peak (Figure 3b), this enhances the likelihood that the molecular clouds do not obstruct the escape of ionizing radiation in our line of sight, consistent with the low LyC optical depth suggested by Micheva et al. (2017). If the clouds are infalling, then the blue component is likely to be behind the SSC, which further enhances this scenario.
Clarifying the timescale for gas retention and spatial relation to the SSC is critical for understanding the conditions for LyC escape and Green Pea-like systems. In particular, adiabatic superwinds have been suggested to be important in clearing passages for ionizing radiation (e.g., Zastrow et al., 2013; Heckman et al., 2011). The action of mechanical feedback takes time, while after 3 Myr, the ionizing stellar population declines (Dove et al., 2000; Fujita et al., 2003). Thus, in this model, there is significant LyC escape only in a short period dominated by classical Wolf-Rayet stars around age 3 – 5 Myr (Zastrow et al., 2013). However, Mrk 71-A is most likely younger than 3 Myr old, perhaps even by a factor of 10, and it is a strong candidate LCE, quantitatively matching Green Pea properties in all respects, including extreme excitation and low optical depth (Micheva et al., 2017). Since we show that any mechanical feedback in this system is not energy-driven, it suggests that superwinds are not a necessary condition for LyC escape.
4 Conclusion
In summary, our NOEMA CO(2–1) observations detect a compact, pc, molecular cloud coincident with the SSC Mrk 71-A, which is of similar mass. At face value, the implied SFE is high, on the order of 0.5, as seen in similar objects. In the extremely young, high-density star-forming conditions for Mrk 71-A, energy-driven feedback will be suppressed by strong, radiative cooling (e.g., Silich et al., 2007; Krause & Diehl, 2014; Yadav et al., 2017). The presence of a massive, compact, molecular cloud cospatial with the SSC is fully consistent with this expectation, and we quantitatively demonstrate that any mechanical feedback from the SSC must be momentum-driven. Under these circumstances, radiation feedback from the young SSC is likely the dominant feedback mode (e.g., Freyer et al., 2003; Krumholz & Matzner, 2009). Given that Mrk 71-A is an extreme Green Pea analog and strong LCE candidate, our results suggest that superwinds are not necessary to clear gas for LyC escape.
The CO(2–1) data appear to show two, spatially distinct, kinematic components separated by . If expanding, these could be due to momentum-driven, stellar wind feedback. Conversely, the components could be colliding clouds responsible for triggering the formation of the SSC, or simply random vestigial accretion. Finally, the kinematics are also consistent with a virialized system.
We also detect the nebular continuum in Mrk 71-A, allowing accurate measurement of its absolute coordinates, and four additional molecular clouds of similar masses within 50 pc of the SSC. One is unresolved and extremely compact, but no continuum is detected.
References
- Amorín et al. (2016) Amorín, R., Muñoz-Tuñón, C., Aguerri, J. A. L., & Planesas, P. 2016, A&A 588, A23
- Bolatto et al. (2013) Bolatto, A., Wolfire, M. & Leroy, A. 2013, ARAA 51, 207
- Cardamone et al. (2009) Cardamone, C. et. al., 2009, MNRAS, 399, 1191
- Chevalier & Clegg (1985) Chevalier, R. A. & Clegg, A. W. 1985, Nature, 317, 44
- Chomiuk & Wilcots (2009) Chomiuk, L. & Wilcots, E. M. 2009, AJ 137, 3869
- Dale (2015) Dale, J. E., 2015, NewAR, 68, 1
- Dove et al. (2000) Dove, J. B., Shull, J. M., & Ferrara, A. 2000, ApJ 531, 846
- Drissen et al. (2000) Drissen, L., Roy, J.-R., Robert, C., & Devost, D. 2000, ApJ 119, 688
- Freyer et al. (2003) Freyer, T., Hensler, G., & Yorke, H. W. 2003, ApJ, 594, 888
- Fujita et al. (2003) Fujita, A., Martin, C. L., Mac Low, M.-M., & Abel, T. 2009, ApJ 599, 50
- Fukui et al. (2016) Fukui, Y., Torii, K., Ohama, A., et al. 2016, ApJ 820, 26
- Gratton et al. (2012) Gratton, R. G., Carretta, E., & Bragaglia, A. 2012, A&ARv 20, 50
- Guseva et al. (2006) Guseva, N. G., Izotov, Y. I., & Thuan, T. X., ApJ 644, 890
- Haworth et al. (2015) Haworth, T. J., Tasker, E. J., Fukui, Y., et al. 2015, MNRAS 450, 10
- Heckman et al. (2011) Heckman, T. M., Borthakur, S., Overzier, R., et al. 2011, ApJ 730, 5
- González-Delgado et al. (1994) González-Delgado, R. M., et al. 1994, ApJ 437, 239
- Herrera & Boulanger (2017) Herrera, C. N. & Boulanger, F. 2017, A&A 600, A139
- Izotov et al. (2011) Izotov, Y. I. et. al., 2011, ApJ, 728, 161
- Izotov et al. (2016a) Izotov, Y. I. et. al., 2016a, Nature, 529, 178
- Izotov et al. (2016b) Izotov, Y. I. et. al., 2016b, MNRAS, 461, 3683
- James et al. (2016) James, B. L., Auger, M., Aloisi, A., Calzetti, D., & Kewley, L. 2016, ApJ, 816, 40
- Jaskot & Oey (2013) Jaskot, A. E. & Oey, M. S., 2013, ApJ, 766, 91
- Krause & Diehl (2014) Krause, M. G. H., & Diehl, R. 2014, ApJ 794, L21
- Kruijssen (2012) Kruijssen, J. M. D. 2012, MNRAS 426, 3008
- Krumholz & Matzner (2009) Krumholz, M. R. & Matzner, C. D. 2009, ApJ 703, 1352
- Leroy et al. (2011) Leroy, A., Bolatto, A., Gordon, K. et al. 2011, ApJ 737, 12
- MacLaren et al. (1988) MacLaren, I., Richardson, K. M., & Wolfendale, A. W. 1988, ApJ 333, 821
- Mac Low & McCray (1988) Mac Low, M.-M., & McCray, R. 1988, ApJ 324, 776
- Martínez-González et al. (2014) Martínez-González, S., Silich, S., & Tenorio-Tagle, G. 2014, ApJ785, 164
- McCray & Snow (1979) McCray, R. & Snow, T. P. 1979, ARA&A 17, 213
- Micheva et al. (2017) Micheva, G., Oey, M. S., Jaskot, A. E., & James, B. L. 2017, ApJ, in press; arXiv:1704.01678
- Silich et al. (2007) Silich, S. & Tenorio-Tagle, G. & Muñoz-Tuñón, C., 2007, ApJ 669, 952
- Silich & Tenorio-Tagle (2017) Silich, S. & Tenorio-Tagle, G. 2017, MNRAS 465, 1375
- Smith et al. (2006) Smith, L. J., et al. 2006, ApJ 370, 513
- Sorai et al. (2001) Sorai, K. et. al., 2001, ApJ 551, 794
- Tolstoy et al. (1995) Tolstoy, E. et. al., 1995, AJ, 110, 1640
- Turner et al. (2015) Turner, J. L. et. al., 2015, Nature, 519, 331
- Turner et al. (2017) Turner, J. L., et al. 2017, arXiv:1706.09944
- Weaver et al. (1977) Weaver, R., McCray, R., Castor, J., Shapiro, P., & Moore, R. 1977, ApJ 218, 377
- Yadav et al. (2017) Yadav, N., Mukherjee, D., Sharma, P., & Nath, B. B. 2017, MNRAS 465, 1720
- Zastrow et al. (2013) Zastrow, J., Oey, M. S., Veilleux, S., & McDonald, M. 2013, ApJ 779, 76