Photoassociation spectroscopy of ultracold 173Yb atoms near the intercombination line
Abstract
We report on photoassociation (PA) spectroscopy of a degenerate Fermi gas of 173Yb atoms near the dissociation limit of the spin-forbidden – intercombination transition. An atom-loss spectrum is measured from a trapped sample for a spectral range down to GHz with respect to the atomic resonance. The spectrum shows eighty PA resonances, revealing the high nuclear spin nature of the system. We investigate the Zeeman effect on the spectrum near a detuning of GHz, where we examine the quantum numbers of the Zeeman levels using various two-component spin mixture samples. Finally, we measure the atom loss rate under PA light for several pronounced PA resonances.
I Introduction
Photoassociation (PA) is a process in which two colliding atoms form an excited molecule by absorbing a photon. PA spectroscopy provides a versatile tool for probing the physics of rovibrational molecular states Jones_RMP_2006 and precisely determining the collisional properties of atoms, such as scattering length and interatomic potential coefficients Kitagawa_Twocolor_2008 . Furthermore, the PA process can be actively used to control the strength of atomic interaction via coupling to an excited molecular state, a phenomenon called optical Feshbach resonance (OFR) Fatemi_OFR_2000 ; Theis_OFR_2004 ; Ciurylo_OFR_2005 ; Enomoto_OFR_2008 ; Yamazaki2010 ; Yan2013 , and to measure pair correlations in strongly correlated atomic gas systems Partridge_BCS_2005 ; Sugawa_dualMott_2011 .
Recently, there has been broad interest in studies on the PA physics of two-valence-electron atoms such as Yb Takasu_PA1P1_2004 ; Tojo_PA_2006 ; Enomoto_OFR_2008 ; Enomoto_C6_2007 ; Kitagawa_Twocolor_2008 ; Borkowski_Lineshape_2009 ; Enomoto_PLR_2008 ; Borkowski_Hetero_2011 ; Roy_YbLi_2016 , Sr Nagel_PASr_2005 ; Zelevinsky_Narrow_2006 ; Borkowski_Mass_2014 ; Stellmer_Sr2_2012 ; Reinaudi_Sr2_2012 ; Nicholson2015 ; Yan2013 , and Ca Kahmann_Zeeman_2014 ; Tiemann_Zeeman_2015 . These atoms have narrow – intercombination transition, which is beneficial for the precise determination of PA resonances and enables the implementation of OFR without significant atom loss Ciurylo_OFR_2005 ; Enomoto_OFR_2008 ; Yamazaki2010 ; Yan2013 . In particular, Yb atoms have rich, stable isotopes, including five spinless bosons (168Yb, 170Yb, 172Yb, 174Yb, and 176Yb) and two fermions (171Yb, with a nuclear spin of and 173Yb, with ), providing an interesting opportunity to study the mass scaling of PA physics Kitagawa_Twocolor_2008 ; Borkowski_Lineshape_2009 . To date, many PA spectra of Yb atoms have been reported for bosonic isotopes Tojo_PA_2006 ; Enomoto_C6_2007 ; Kitagawa_Twocolor_2008 ; Borkowski_Lineshape_2009 , fermionic 171Yb Enomoto_PLR_2008 , and isotopic mixtures Borkowski_Hetero_2011 ; Roy_YbLi_2016 . However, the complete PA spectrum of fermionic 173Yb, with its high nuclear spin, is still unknown, although a couple of PA resonances have been reported Sugawa_dualMott_2011 ; Taie_Pomeranchuk_2012 ; Kitagawa_Twocolor_2008 . In addition, the 173Yb Fermi gas system has been discussed as a candidate platform for studies of exotic quantum magnetism Gorshkov_SUN_2010 . Information on the PA spectrum of 173Yb near the intercombination line is highly desirable for such a quantum simulation application Reichenbach_OFR_2009 .
In this paper, we report the PA spectrum of a degenerate Fermi gas of 173Yb atoms near the dissociation limit of the intercombination transition. We measured an atom-loss spectrum as a function of the frequency of the PA light and we observed eighty PA resonances in the spectrum on the red-detuned side of the atomic resonance down to GHz. The high density of the spectral lines can be attributed to the high nuclear spin number of 173Yb, which we confirmed by performing a multi-channel calculation of the molecular energy levels based on known spectroscopic results. To collect further spectroscopic information on the excited molecular states, we investigated the Zeeman effect in the spectrum near the frequency detuning of GHz. By employing various two-component spin mixture samples, we determined the quantum numbers of the Zeeman sublevels and estimated the factor of the molecular state corresponding to the PA line at MHz detuning. Finally, we measured the two-body loss rates under PA light for several pronounced PA resonances. Our measurement results provide a starting point for studies of the PA physics of fermionic 173Yb atoms, although further theoretical efforts will be required to interpret the measured spectra.
II Experiment
We prepared an ultracold gas sample of 173Yb atoms as described in Ref. Lee_SOC_2017 . The atoms were first collected in a magneto-optical trap using the 556 nm – intercombination transition and transferred into a 1070 nm optical dipole trap (ODT). Then, the atoms were transported to an auxiliary vacuum chamber by moving the focus of the trapping laser beam and were loaded into a crossed ODT formed by superposing an additional 532 nm trapping laser beam. The atomic sample was evaporatively cooled by lowering the trap depth, and after cooling, it was held for an additional 0.3 s to ensure equilibrium. The final sample was an equal mixture of all six spin components of the ground state, containing approximately atoms. The sample temperature was measured to be nK. The in situ density distribution of the trapped sample was found to be well fit by a Gaussian profile with a radius of m, and the central density was estimated to be cm-3, corresponding to a Fermi energy of nK, where is the Planck constant divided by , is the atomic mass, and is the Boltzmann constant. To measure the sample condition, we take absorption image using the – transition.
PA resonances were detected via atom loss by illuminating the trapped sample with a pulsed PA laser beam. The linewidth of our PA laser was kHz, which is sufficiently narrow to probe excited molecular states with a natural linewidth of kHz, where is the atomic linewidth of the – transition Ciurylo_OFR_2005 . The PA laser beam was –polarized and focused onto the sample with a Gaussian beam waist of m, which was large to uniformly irradiate the entire sample. We obtained a PA spectrum by measuring the remaining atom number fraction as a function of the frequency of the PA laser beam. For each , we determined by measuring the numbers of atoms with and without application of the PA laser beam, respectively.
III Results
III.1 PA spectrum
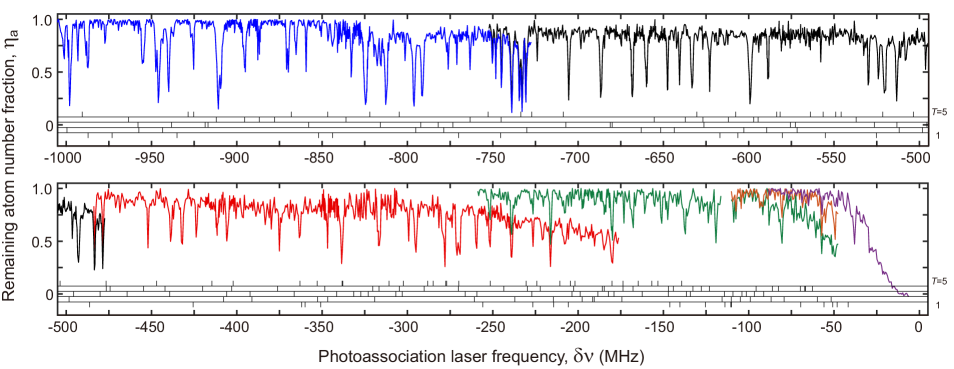
Figure 1 shows the PA spectrum measured for GHz, where is the resonance frequency for the atomic transition. In the measurement, we reduced the PA beam intensity and the pulse duration in a piecewise manner as we approach the atomic resonance to avoid power broadening and photon scattering loss effects, where W/cm2 and ms. The saturation intensity for the atomic transition is mW/cm2. The spectrum shows a high density of spectral lines, and we identified eighty PA resonances in the range of MHz. For MHz, it was difficult to unambiguously identify PA resonances because of high photon scattering loss near the atomic resonance. The positions and linewidths of the spectral lines were determined from Lorentzian line fits to the measured data and are listed in Table 1. In our experiment, the ac Stark shift due to the dipole trapping beams was kHz and insignificant, and the thermal broadening was negligible for 4 kHz.
| (MHz) | (MHz) |
| – | |
| – | |
| – | |
| – | |
| – |
| (MHz) | (MHz) |
| – | |
| – | |
| – | |
| – | |
| – | |
| – | |
| – | |
| – | |
| – | |
| – | |
| – | |
| – | |
| – | |
| – | |
III.2 High spectral density
To understand the observed high density of the spectral lines, we calculate the bound state energy levels for two 173Yb atoms in the + channel, following the methods presented in Refs. Zelevinsky_Narrow_2006 ; Reichenbach_OFR_2009 . The Hamiltonian for the two atoms is
| (1) |
where the first and second terms represent the radial and angular kinetic energies, respectively of the nuclei of the two atoms, is the electronic Born-Oppenheimer (BO) potential, and is the hyperfine interaction term. Here, and denote the reduced mass and radial separation of the two nuclei, respectively, and is the quantum number for the overall rotation of the atom dimer. The BO potential is given by
| (2) |
The first term is the Lennard-Jones potential and the second term represents the dipole-dipole interaction, where for the gerade (ungerade) potential and is the internuclear projection of the angular momentum . Here, is the total electronic angular momentum of atom . From Ref. Borkowski_Lineshape_2009 , we have , , and , where is the Hartree energy and is the Bohr radius. The hyperfine interaction is described by Reichenbach_OFR_2009 , where we assume that the atom belongs to the state, i.e., . We adopt the values of MHz and MHz from Ref. Pandey_Hyperfine_2009 .
At the low temperature of our experiment, we expect only -wave () collisions for two fermionic 173Yb atoms in the ground state, and the initial + dimer state should have total angular momentum of or and even spatial parity (). Here, and . According to the selection rules for optical excitation, excited molecular states should have or and odd parity (). In the modified Hund’s case (e) that is relevant to our condition, with large spin-orbit coupling and hyperfine interaction, we count 205 different configurations of for the final states of the PA transition. Note that the transition from the initial molecular state to a gerade-symmetry state is possible because the u-g symmetry is broken in Hund’s case (e) Pique_ugsymmetry_1984 .
The adiabatic potentials for molecular states can be obtained by diagonalizing the Hamiltonian in Eq. (1) via basis transformation between different Hund’s cases Tiesinga_PA_2005 ; Reichenbach_OFR_2009 . For a short distance , the BO potential, which is diagonal under Hund’s case (c), is dominant. In this case, the basis set is given by , where and are the projections of and onto the internuclear axis, respectively, and is the projection of the total angular momentum onto a space-fixed quantization axis. At large , i.e., when the two atoms are far apart, Hund’s case (p) becomes relevant and results in a basis set consisting of the products of internal atomic states and molecular rotation as follows: . In the intermediate range of , we consider Hund’s case (e), in which rotational and hyperfine interactions are diagonal and use a basis of .

The calculated adiabatic potentials for the 205 channels for excited molecular states are displayed in Fig. 2. At small , the potentials are grouped into four branches, representing the four different dipole-dipole interaction configurations, and at large , they converge to three asymptotes near the dissociation limit, which correspond to and , respectively. We note that the potential related to the asymptote has a local minimum near , predicting purely-long-range molecular states. This is due to the large hyperfine structure of heavy Yb atoms, and purely-long-range states have been observed with 171Yb Enomoto_PLR_2008 .
From the calculated molecular potentials, we compute the bound state energy levels using a multi-channel discrete variable representation (DVR) method Tiesinga_PA_2005 ; Tiesinga_DVR_1998 ; Reichenbach_OFR_2009 . This calculation predicts more than 200 bound states in the range of MHz, whose positions are indicated in Fig. 1 alongside the measured PA spectrum LBE_comment . Considering the limited experimental sensitivity, the observed high density of the spectral lines is reasonably explained by the calculated results. With regard to the resonance positions, a better comparison might be enabled by using an iterative fitting method to tune the potential coefficients values Borkowski_Lineshape_2009 , but because of the heavy calculation load involved, we will leave such an effort as a topic for future studies.
III.3 Zeeman effect
To facilitate the spectroscopic identification of the observed PA lines, we investigated the Zeeman effect by applying an external magnetic field Hamley_RARb_2009 . In the presence of , the total angular momentum and its projection onto the field direction are still good quantum numbers of the system, and for low the Zeeman shift is described as , where and are the Bohr magneton and the Lande -factor of the molecular state, respectively. The number of Zeeman sublevels and the magnitude of their spectral splitting for directly reveal the quantum numbers of the molecular state as well as the factor value, which is sensitively determined by the interatomic potential Kahmann_Zeeman_2014 ; Tiemann_Zeeman_2015 .
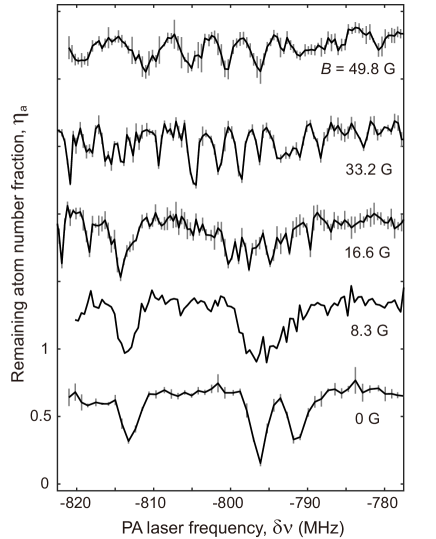
We applied the magnetic field along the axis of the PA laser beam and measured the PA spectra for various (Fig. 3). The scan range of was set to be from to , where for G, three pronounced PA lines are located at MHz, MHz, and MHz, with relatively large linewidths of MHz. The latter two PA lines have been reported in previous experiments Kitagawa_Twocolor_2008 ; Taie_Pomeranchuk_2012 ; Sugawa_dualMott_2011 . With increasing , each spectral peak broadens and splits into multiple weak peaks. The Zeeman splitting response appears relatively rapidly for the line at MHz and slowly for the line at MHz, reflecting the different magnitudes of for these PA lines. Asymmetric shifting toward negative detuning is observed, which we attribute mainly to the polarization of the PA light, which allows only transitions.
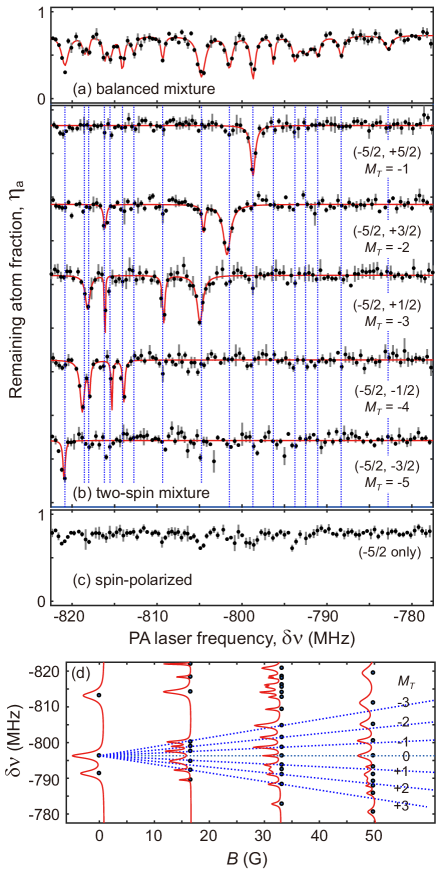
For G, the spectrum shows a group of fully resolved Zeeman peaks with linewidths of MHz. To determine the numbers of the Zeeman peaks, we measured the PA spectra of two-component spin mixture samples. When such a sample is prepared with two spin components with magnetic Zeeman numbers of and , the initial dimer state for -wave collision in + has a specific quantum number of , and with a –polarized PA laser beam, this state can be coupled only to excited molecular states with . Thus, the corresponding number can be assigned to Zeeman peaks that appear in the PA spectrum of such a two-component sample. In our experiment, we employed five binary spin mixtures of and Lee_SOC_2017 and the PA spectra of the samples were measured at G [Fig. 4(b)]. As expected, each spectrum shows a subset of the Zeeman peaks observed in the PA spectrum of a fully balanced spin mixture [Fig. 4(a)]. To suppress unwanted optical pumping by the PA light into different spin states, we set W/cm2 and ms to obtain , where is the Rayleigh scattering rate of the PA light at MHz.
The main finding from the analysis is that the three Zeeman peaks that are almost equally spaced in the detuning range of have and , respectively. We find that Zeeman peaks are also located at the positions linearly extrapolated for and from these three Zeeman peaks and, in particular, that the peak position corresponding to coincides with the zero-field PA line at MHz. From these observations and the fact that there is no Zeeman peak at the corresponding expected spacing from the peak, we infer that the total angular momentum number of the PA line at MHz is . From a linear fit to the seven Zeeman peak positions, a -factor of can be determined, which is approximately ten times smaller than the atomic value of for the state. In Fig. 4(d), we display the PA resonance positions measured from the data in Fig. 3 as a function of , and the Zeeman splitting lines predicted from the measured -factor are found to reasonably fit the experimental data. For a high of approximately G, the PA resonance positions slightly deviate from the predictions toward a negative detuning except for , indicating higher-order Zeeman effects.
Although the information is helpful for deciphering the linear Zeeman splitting of the PA line at MHz, an analysis of the Zeeman effects of the other two PA lines is not straightforward. First, we observe no Zeeman peaks for these two PA lines, although such peaks should exist because . Second, each PA spectrum for and shows four resonances [Fig. 4(b)], which means that our PA spectrum for a high of G must involve Zeeman contributions from other PA lines outside the measurement range. Theoretical support will be critical for a complete understanding of the observed Zeeman effects.
III.4 Two-body loss rate
Finally, we characterized some of the pronounced PA resonances by measuring the two-body loss rate under PA light. contains important information such as the Franck-Condon factor for the optical transition Jones_RMP_2006 ; Bohn_semianalytic_1999 and the so-called optical length that describes the magnitude of the change of the scattering length due to the OFR Ciurylo_OFR_2005 ; Borkowski_Lineshape_2009 ; Nicholson2015 .
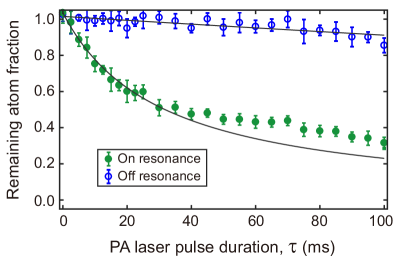
In the presence of PA light, the atom density evolves as , where the first term represents the two-body PA process and the second term accounts for one-body decay processes such as Rayleigh photon scattering loss and background trap loss. For a case of a trapped sample, considering its inhomogeneous density distribution, the rate equation for the total number of atoms is given by , where is the effective volume of the sample for a Gaussian density distribution. To avoid nonlinear effects caused by sample heating on and , we measured the decay rate of from an exponential fit to the initial ms of data and calculated as . Here denotes the average number of atoms over the initial 10 ms and was independently measured at off-resonance detuning which is more than away from the PA resonance (Fig. 5).
We measured for the three PA resonances at MHz, MHz, and MHz, and obtained cm3/s with mW/cm2, cm3/s with W/cm2, and cm3/s with W/cm2, respectively. In the cold collision limit, the optical length is given as Ciurylo_OFR_2005 ; Yan2013 , where is the enhancement factor of the molecular linewidth with respect to the natural linewidth. Assuming that is order of unity, our measurement results suggest that at W/cm2. It is surprising that the estimated value of is more than two orders of magnitude smaller than the values reported for other Yb isotopes Reichenbach_OFR_2009 ; Borkowski_Lineshape_2009 ; Kim_OFR_2016 . It would be worthwhile to investigate the tempearture and dependence of in a further systematic manner Borkowski_Lineshape_2009 .
IV Summary
We have measured the PA spectrum of a degenerate Fermi gas of 173Yb atoms near the dissociation limit of the – intercombination transition and have characterized some of the prominent PA lines by investigating their Zeeman splitting and measuring their two-body loss rates under PA light. The high density of the spectral lines was accounted for by the calculation of the molecular energy levels based on an extended version of Hund’s case (e), but further theoretical investigation will be necessary for spectral identification of the observed molecular states. This will improve our understanding of the collisional properties of Yb atoms in +, which are important for many applications using Yb atoms, such as optical clocks Bloom_clock_2014 ; Nemitz2016 and the simulation of novel quantum magnetism Sugawa_dualMott_2011 ; Gorshkov_SUN_2010 .
Finally, we note that when the Zeeman splitting of a PA line is fully understood in terms of its molecular quantum number, the spin-dependent PA transitions may find immediate use in probing interspin correlations, particularly, in optical lattice experiments Sugawa_dualMott_2011 ; Hofrichter2016 . For example, the correlations between the and spin states may be distinctively detected by using the PA resonance at MHz for G. Thus, it might be worthwhile to search for an isolated PA line whose Zeeman lines are spectroscopically well resolved and have reasonable transition strengths for a moderate magnetic field.
V Acknowledgments
We thank Paul S. Julienne and Jee Woo Park for helpful discussions. This work was supported by the Institute for Basic Science (IBS-R009-D1) and the National Research Foundation of Korea (Grant No. 2014-H1A8A1021987).
References
- (1) K. M. Jones, E. Tiesinga, P. D. Lett, and P. S. Julienne, Rev. Mod. Phys. , 483 (2006).
- (2) M. Kitagawa, K. Enomoto, K. Kasa, Y. Takahashi, R. Ciuryło, P. Naidon, and P. S. Julienne , Phys. Rev. A , 012719 (2008).
- (3) F. K. Fatemi, K. M. Jones, and P. D. Lett, Phys. Rev. Lett. , 4462 (2000).
- (4) M. Theis, G. Thalhammer, K. Winkler, M. Hellwig, G. Ruff, R. Grimm, and J. Hecker Denschlag, Phys. Rev. Lett. , 123001 (2004).
- (5) R. Ciuryło, E. Tiesinga, and P. S. Julienne, Phys. Rev. A , 030701(R) (2005).
- (6) K. Enomoto, K. Kasa, M. Kitagawa, and Y. Takahashi, Phys. Rev. Lett. , 203201 (2008).
- (7) R. Yamazaki, S. Taie, S. Sugawa, and Y. Takahashi, Phys. Rev. Lett. , 050405 (2010).
- (8) M. Yan, B. J. DeSalvo, B. Ramachandhran, H. Pu, and T. C. Killian, Phys. Rev. Let. , 123201 (2013).
- (9) G. B. Partridge, K. E. Strecker, R. I. Kamar, M. W. Jack, and R. G. Hulet, Phys. Rev. Lett. , 020404 (2005).
- (10) S. Sugawa, K. Inaba, S. Taie, R. Yamazaki, M. Yamashita, and Y. Takahashi, Nat. Phys. , 642 (2011).
- (11) Y. Takasu, K. Komori, K. Honda, M. Kumakura, T. Yabuzaki, and Y. Takahashi, Phys. Rev. Lett. , 123202 (2004).
- (12) S. Tojo, M. Kitagawa, K. Enomoto, Y. Kato, Y. Takasu, M. Kumakura, and Y. Takahashi, Phys. Rev. Lett. , 153201 (2006).
- (13) K. Enomoto, M. Kitagawa, K. Kasa, S. Tojo, and Y. Takahashi, Phys. Rev. Lett. , 203201 (2007).
- (14) K. Enomoto, M. Kitagawa, S. Tojo, and Y. Takahashi, Phys. Rev. Lett. , 123001 (2008).
- (15) M. Borkowski, R. Ciuryło, P. S. Julienne, S. Tojo, K. Enomoto, and Y. Takahashi, Phys. Rev. A , 012715 (2009).
- (16) M. Borkowski et al., Phys. Rev. A , 030702(R) (2011).
- (17) R. Roy, R. Shrestha, A. Green, S. Gupta, M. Li, S. Kotochigova, A. Petrov, and C. H. Yuen, Phys. Rev. A , 033413 (2016).
- (18) S. B. Nagel, P. G. Mickelson, A. D. Saenz, Y. N. Martinez, Y. C. Chen, T. C. Killian, P. Pellegrini, and R. Côté, Phys. Rev. Lett. , 083004 (2005).
- (19) T. Zelevinsky, M. M. Boyd, A. D. Ludlow, T. Ido, J. Ye, R. Ciuryło, P. Naidon, and P. S. Julienne, Phys. Rev. Lett , 203201 (2006).
- (20) S. Stellmer, B. Pasquiou, R. Grimm, and F. Schreck, Phys. Rev. Lett. , 115302 (2012).
- (21) G. Reinaudi, C. B. Osborn, M. McDonald, S. Kotochigova, and T. Zelevinsky, Phys. Rev. Lett. , 115303 (2012).
- (22) M. Borkowski, P. Morzyński, R. Ciuryło, P. S. Julienne, M. Yan, B. J. DeSalvo, and T. C. Killian, Phys. Rev. A , 032713 (2014).
- (23) T. L. Nicholson, S. Blatt, B. J. Bloom, J. R. Williams, J. W. Thomsen, J. Ye, and P. S. Julienne, Phy. Rev. A , 022709 (2015).
- (24) M. Kahmann, E. Tiemann, O. Appel, U. Sterr, and F. Riehle, Phys. Rev. A , 023413 (2014).
- (25) E. Tiemann, M. Kahmann, E. Pachomow, F. Riehle, and U. Sterr, Phys. Rev. A , 023419 (2015).
- (26) S. Taie, R. Yamazaki, S. Sugawa, and Y. Takahashi, Nat. Phys. , 825 (2012).
- (27) A. V. Gorshkov, M. Hermele, V. Gurarie, C. Xu, P. S. Julienne, J. Ye, P. Zoller, E. Demler, M. D. Lukin, and A. M. Rey, Nat. Phys. , 289 (2010).
- (28) I. Reichenbach, P. S. Julienne, and I. H. Deutsch, Phys. Rev. A , 020701(R) (2009).
- (29) M. Lee, J. H. Han, J. H. Kang, and Y. Shin, Phys. Rev. A , 043627 (2017).
- (30) R. Ciuryło, E. Tiesinga, S. Kotochigova, and P. S. Julienne, Phys. Rev. A , 062710 (2004).
- (31) K. Pandey, A. K. Singh, P. V. K. Kumar, M. V. Suryanarayana, and V. Natarajan, Phys. Rev. A , 022518 (2009).
- (32) J. P. Pique, F. Hartmann, R. Bacis, S. Churassy, and J. B. Koffend, Phys. Rev. Lett. , 267 (1984).
- (33) E. Tiesinga, K. M. Jones, P. D. Lett, U. Volz, C. J. Williams, and P. S. Julienne, Phys. Rev. A , 052703 (2005).
- (34) E. Tiesinga, C. J. Williams, and P. S. Julienne, Phys. Rev. A , 4257 (1998).
- (35) We checked the validity of our DVR method with LeRoy-Bernstein formula. The lowest potentials of branch with can be approximated to from of , which follows vibrational progression. See also; R. J. LeRoy and R. B. Bernstein, J. Chem. Phys. , 3869 (1970).
- (36) C. D. Hamley, E. M. Bookjans, G. Behin-Aein, P. Ahmadi, and M. S. Chapman, Phys. Rev. A , 023401 (2009).
- (37) John L. Bohn and P. S. Julienne, Phys. Rev. A , 414 (1999).
- (38) M. Kim, J. Lee, J. H. Lee, Y. Shin, and J. Mun, Phys. Rev. A , 042703 (2016).
- (39) B. J. Bloom, T. L. Nicholson, J. R. Williams, S. L. Campbell, M. Bishof, X. Zhang, W. Zhang, S. L. Bromley, and J. Ye, Nature , 71 (2014).
- (40) N. Nemitz, T. Ohkubo, M. Takamoto, I. Ushijima, M. Das, N. Ohmae, and H. Katori, Nat. Photonics , 258 (2016).
- (41) C. Hofrichter, L. Riegger, F. Scazza, M. Höfer, D. R. Fernandes, I. Bloch, and S. Fölling, Phys. Rev. X , 021030 (2016).