Huge magnetoresistance and ultra-sharp metamagnetic transition in polycrystalline
Abstract
Large magnetoresistive materials are of immense interest for a number of spintronic applications by developing high density magnetic memory devices, magnetic sensors and magnetic switches. Colossal magnetoresistance, for which resistivity changes several order of magnitude () in an external magnetic field, occurs mainly in phase separated oxide materials, namely manganites, due to the phase competition between the ferromagnetic metallic and the antiferromagnetic insulating regions. Can one further enhance the magnetoresistance by tuning the volume fraction of the two phases? In this work, we report a huge colossal magnetoresistance along with the ultra-sharp metamagnetic transition in half doped manganite compound by suitably tuning the volume fraction of the competing phases. The obtained magnetoresistance value at 10 K is as large as in a 30 kOe external magnetic field and in 90 kOe external magnetic field and is several orders of magnitude higher than any other observed magnetoresistance value reported so far. Using model Hamiltonian calculations we have shown that the inhomogeneous disorder, deduced from tunneling electron microscopy, suppresses the CE-type phase and seeds the ferromagnetic metal in an external magnetic field.
Introduction
For the last several years search for materials with large magnetoresistance (MR) and the studies on related phenomena are on the forefront of the worldwide research activity Moritomo ; Shimakawa ; Uehara ; Siwach ; Ali ; Tafti ; Baldini due to its widespread application in the field of magnetic sensor, magnetic memory devices, magnetic switches etc asamitsu ; bibes ; sawa ; rubi ; hoffman . The highest value of MR in principle can be achieved if the resistivity value of the material can be transformed from an extreme insulating material (like mica) to a very good metallic one (like Copper) by applying magnetic field.
In perovskite manganite, insulating state is observed in charge ordered antiferromagnetic (CO-AFM) sample which generally appears near the half doping. Critical magnetic field, that is required to melt the charge-ordered antiferromagnetic state, increases with decreasing the bandwidth. CO-AFM state can be weakened by introducing ferromagnetic proximity like: (i) by effectively increasing the bandwidth of the electrons via substituting larger cations at the A-sites Arulraj ; TokuraCMR ; Nigam ; Mavani , (ii) by B-site doping (e.g, Cr, Ru doping on Mn sites) Martin ; Hervieu1 ; pradhan1 , (iii) by making FM-AFM core-shell nanostructures (or nanoparticles) Das ; Das2 ; Dong . Thus by inducing the ferromagnetic phase fraction in an antiferromagnetic manganite or in other word engineering electronic phase separation is an effective tool to enhance the magnetoresistance. Recently, great amount of effort has been devoted to control the electronic phase separation in bulk and low dimensional manganites Zhu ; Chen ; Chai ; Shao ; Zhang ; elovaara1 ; ZhangNL .
It is known that CO-AFM state in a low bandwidth (SCMO) is very stableTokura2 and kOe [at temperature (T) = 4.2 K] critical magnetic field () is required to destabilize the CO state. On the other hand, CO-AFM and FM metallic phases coexist in and is metallic at low temperaturesTomioka . In our case we prepare [SCSMO] by replacing half of the ions by ions. This substitution reduces the charge-ordering temperature () and Neel temperature () of SCSMO by 50 K from its parent compound SCMOTokuraCMR . Although, SCSMO remains a strong insulator [ 1012 Ohm-cm] at low temperature, but the critical field decreases to kOe (for SCSMO) from kOe (for SCMO).
For the prepared polycrystalline SCSMO, surprisingly, we obtain an unprecedented magnetoresistance of at 10 K on application of 90 kOe magnetic field. This MR value in bulk SCSMO sample is undoubtedly a record value compared with the previously observed MR in any charge ordered compounds. For example, the MR value for compound is at 57 K for 80 kOe applied fieldGong. By substrate induced strain a huge MR of has also been observed in thin film at 50 K on application of 70 kOe magnetic fieldPrellier . The charge ordered compound shows MR of at 60 K on application of 150 kOe magnetic field due to strain induced by the substrateBuzin . Moreover, thin film made out of our parent compound SCMO shows MR of on application of 200 kOe external field at 57 KRauwel . At the same time, MR value of our SCSMO sample reaches to at 50 K only in 30 kOe magnetic field.
We also find an ultra-sharp metamagnetic transitionGhivelder ; Tang ; Mahendiran ; Rana below 10 K. We explain the metamagnetic as well as ultra-sharp metamagnetic transition using martensitic scenario. Our Monte Carlo simulations using a two-band double-exchange model show that A-site disorder suppresses the CE-type phase, but the system remains insulating without any external magnetic field. In an external magnetic field the inhomogeneous disorder seeds the ferromagnetic-metallic clusters into the system and as a result resistivity decreases at low temperatures which gives rise to large magnetoresistance.
Materials and Methods
Sample preparation.
The polycrystalline compound was prepared by the well known sol-gel chemistry route. For the sample preparation, high pure (99.99 %) Sm2O3, CaCO3, Sr(NO3)2, MnO2, oxalic acid and citric acid were used as the the constituents. The appropriate amounts of Sm2O3 and CaCO3 were converted to their nitrates forms using concentrated nitric acid (HNO3) and dissolved into millipore water. Since MnO2 does not dissolve directly in , hence the appropriate amount of oxalic acid was used to convert it in oxalate form which dissolve easily into millipore water in the presence of nitric acid. After preparing the individual clear solutions of the constituent elements (Sm2O3, CaCO3, Sr(NO3)2 and MnO2), all solutions were mixed up homogenously by using a magnetic stirrer for 30 minutes. For making the precursor solution, suitable amount of citric acid was added to this homogenous solution. Extra water was slowly evaporated by continuously heating this solution using a water bath and maintaining the temperature of the water bath 80 0C. This slow evaporation was continued up to the gel formation. After formation of the gel, it was decomposed at slightly higher temperature (150 0C) and the black porous powder was formed. To evaporate the extra citric acid, porous powder was directly heated at 500 0C for 4 hrs. To get crystalline single phase bulk compound, first the powder sample was pelletized and heated at 1300 0C for the time period of (36 hrs.)
TEM measurements.
High-resolution transmission electron microscopy (HRTEM) has been performed using a FEI Tecnai, F30 microscope with a point to point resolution of 1.8 Å. The composition of the prepared sample was determined from energy dispersive X-ray spectroscopy (EDS) analysis using an analyzer mounted on the same microscope.
Electrical transport measurement.
Resistance measurements in the absence of external magnetic field was carried out using Keithley source and measure unit 2651A by four probe method in the temperature range 20 K to 300 K. The low temperature measurement of zero field resistivity was extended below 20 K by using Keithley Electrometer 6517A in the capacitor arrangement method and below 10 K the resistance value exceeds our measurement limit-I ( ohm). In-field resistivity measurements were carried out using 2651A with the measurement limit-II ohm.
Magnetic property measurements.
Magnetic properties has been measured using Superconducting Quantum Interference Device Magnetometer (SQUID-VSM) of Quantum Design in the temperature range 2 K - 300 K with maximum magnetic field value of 70 kOe.
XRD measurements.
Room temperature powder x-ray diffraction and the temperature dependent XRD measurements in the temperature range 15 K- 300 K has been performed using RIGAKU-TTRAX-III diffractometer with rotating anode Cu source of wavelength (). Measurements has been performed at 9 kW power.
To see the effect of magnetic field on XRD line width broadening, zero field, 70 kOe infield and followed by zero field measurements were performed using Low temperature and high magnetic field XRD set up at UGC-DAE CSR (Indore).
Heat capacity measurements.
Magnetic field dependence as well as temperature dependence of heat capacity of the sample has been carried out using Physical Property Measurements System of Quantum Design.
Results and Discussion
Synthesis and structural characterization.
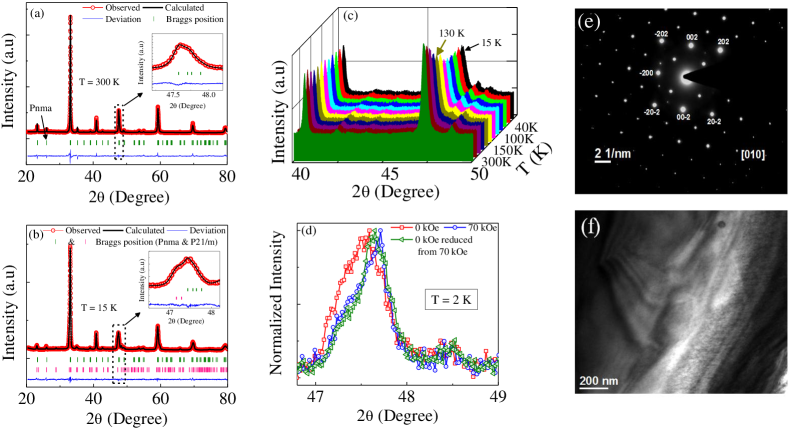
High quality polycrystalline SCSMO was prepared by the well-known sol-gel technique (see methods for details). The crystalline structure and single phase nature of the sample was studied using room temperature x-ray diffraction (XRD) and transmission electron microscopy (TEM). XRD pattern (see Fig. 1(a)) [analysis is discussed in supplementary section I(A)] and TEM diffraction pattern (see Fig. 1(e)) shows the orthorhombic crystallographic symmetry (Pnma) of the sample. Room temperature chemical analysis using energy dispersive spectroscopy (EDS) measurement [see supplementary section I(C)] shows that the elements are distributed homogeneously with stoichiometricity.
We also present XRD analysis at several low temperatures in Fig. 1(b)-(d). With lowering of temperature another crystallographic phase with monoclinic symmetry P21/m along with the room temperature symmetry Pnma i.e. combinations of Pnma and P21/m appears below . The evolution of the appeared new peak corresponding to the P21/m monoclinic space group [see Fig. 1(c)]. It indicates that below 120 K the new peak appears at and its intensity remains almost constant below 100 K. It implies that below 100 K, P21/m phase gets trapped within host Pnma phase and creates lattice strain in the host Pnma phase. Strain is also evident from the TEM analysis [see Fig. 1(f)] at 100 K. It is earlier shown that the antiferromagnetic transition is associated with structural transition from orthorhombic to orthorhombicmonoclinic phase at 135 K in KurbakovPRB ; KurbakovJPCS . So, the monoclinic structure favors the antiferromagnetic phase in . In our case, the SCSMO compound also undergoes the same kind of structural transition at 120 K. We will show in the next section that the system also undergoes an antiferromagnetic transition at 120 K. Thus, the monoclinic P21/m phase [shown in Fig.1 (b) and (c)] is associated with the CE-AFM phase.
The effect of external magnetic field (70 kOe) on the XRD line width broadening at 2 K [see Fig. 1 (d)] indicates the decrease of the line width (full width at half maxima) at from to and remains at the same value even after removing the field. This shows that strain decreases in an external magnetic field and stays as it is even after removing the field.
Magnetic and Magnetotransport Measurements
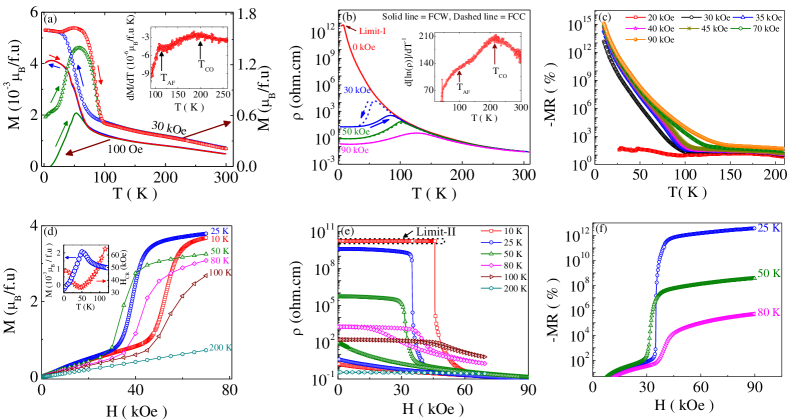
The temperature dependent magnetization and resistivity for different applied magnetic fields are shown in Figs. 2(a) and (b). Interestingly below magnetization increases, but ferromagnetic fraction is very small for 100 Oe magnetic field and this fact is reconfirmed from the thermoremanent magnetization measurements [discussed in supplementary section I(D)]. As a result, the system without any magnetic field remains insulating at low temperature as seen in Fig. 2(b), but the stability of the CO-AFM state decreases (discussed in the next paragraph). This is unlike our previously studied core-shell (ferromagnetic core and antiferromagnetic shell) nanostructures Das2 for which a comparatively small resistivity ( 102 Ohm-cm) was obtained at low temperatures. Below a certain temperature the value of resistance is for SCSMO, which is limiting value of our measuring instruments (see method section for details). The ordering temperatures ( and ) are indicated in the inset of Figs. 2 (a) and (b) and similar is also obtained from the heat capacity measurement [please see supplementary section I(E)].
A 30 kOe magnetic field induces larger ferromagnetic fraction and as a result resistivity decreases considerably (from Ohm-cm to Ohm-cm at T = 2.5 K) at low temperatures [see Figs. 2(a) and (b)]. This shows that not only decreases, but the robustness of CO-AFM state is reduced in SCSMO. A huge hysteresis is observed between field cooling and heating cycle for 30 kOe in the temperature range , in both magnetization and resistivity curves, which is the signature of field induced electronic phase separationdagottoE . With further increase of applied magnetic field this coexistence is suppressed and low temperature resistivity goes to Ohm-cm (for 90 kOe).
To quantify the field induced change in resistivity, we plot the MR () with temperature at different magnetic field in Fig. 2(c). MR is 10 for 20 kOe, but astonishingly increases to for 30 kOe external magnetic field and as large as at 10 K for 90 kOe magnetic field. The magnetoresistance value as high as in polycrystalline stable SCSMO compound is a unique observation.
Isothermal magnetization measured in ZFC protocol at different temperatures [presented in Fig. 2(d)] shows the field induced metamagnetic transitions. Experimentally obtained saturation magnetic moment () at 30 K is close to the estimated magnetic moment for the full saturation of the / and ions (). It clearly indicates that the CO-AFM state melts completely on application of the magnetic field via metamagnetic transition near critical magnetic field . Temperature variation of measured from M(H) isotherms is opposite to that of ZFC magnetization as shown in the inset of Fig. 2(d). The FM components present in the ZFC sample act as the nucleation center and grows at the expense of AFM components in an external magnetic field resulting a metamagnetic transition at . As the ZFC magnetization increases from 2 K to 50 K, enhanced thermal energy reduces the from 47.8 kOe at 2 K to 34.5 kOe at 50 K. For the increases due to reduction of ZFC magnetization. In the absence of AFM components, above , the field induced metamagnetic transition vanishes.
Fig. 2(e) shows the resistivity vs. magnetic-field isotherms measured at different temperatures. Interestingly, the isotherms measured at lower temperature (10 K) show exceptionally sharp metamagnetic jump. With increasing temperature, the loop area reduces between increasing and decreasing field sweeps and at 100 K it almost disappears. Thus, we believe that field induced phase coexistence sustains up to 120 K which is the antiferromagnetic ordering temperature. Another point to note here is that the system remains in the low resistive state even after removing the field for . Due to resistivity measurement limitation the resistivity is limited to ohm-cm in an external magnetic field and as a result we only able to measure the MR for temperature above 25 K. The MR is equal to () at 25 K (80 K) for 45 kOe magnetic field as shown in Fig. 2(f) and will be even larger for lower temperatures.
Ultra-Sharp Metamagnetic Transition
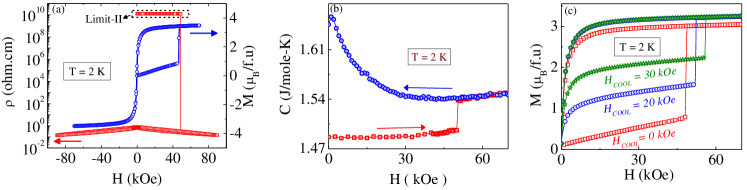
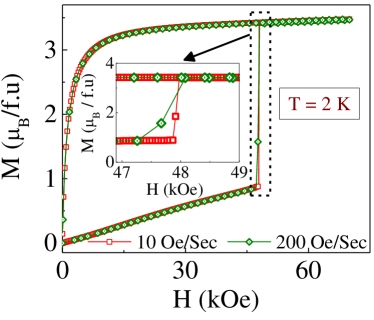
Interestingly, the resistivity (and magnetization) vs. magnetic-field isotherms, [see Fig. 3(a)], at 2 K show exceptionally ultra-sharp steps with a width of 10 Oe (the smallest step kept during the measurement is 3 Oe). To explore the origin of this ultra-sharp metamagnetic transition we turn now to measure the heat capacity (C) with magnetic field. During the field increasing cycle the heat capacity data show a step-like behavior around 48 kOe, as shown in Fig. 3(b), and has one-to-one correspondence with the step-like behavior observed in the magnetization and resistivity isotherms. This is opposite to the case observed in earlier studies where C decreases sharply with H at the transition point and was associated with the rise in temperature of the system due to release of energy that assists the abrupt field-induced transitionGhivelder ; Maji . The sharp increase in the heat capacity at 48 kOe magnetic field rules out the possibility of exothermic temperature driven avalanche metamagnetic transition observed in our system and we believe that the system changes martenisitically.
To ascertain the martensitic nature we also study the isothermal magnetization (at 2 K) for different cooling fields [see Fig. 3(c)]. With increasing cooling field FM fraction increases and as a result interfacial elastic energy increases. Due to this the critical field increases with increasing the cooling field. At the same time, the critical field decreases slightly when we increase the sweep rate from 10 Oe/sec to 200 Oe/sec for ZFC sample [see supplementary section I(F) for details]. This is because the lattice has adequate time to accommodate the induced interfacial strain between AF and FM domains for lower sweep rate and a larger magnetic field is required to break the energy barrier. Both these scenario indicates the martensitic nature of the transitionMaji ; Lion ; Wu ; Shankaraiah ; Hardy . Our resistivity relaxation study [see supplementary section I(G)] also confirms the martensitic nature of the metamagnetic transitions [Fig. 2(d) and (e)] at higher temperatures.
Theoretical Simulation
In this section we discuss the physical origin of the huge magnetoresistance using a two-band double exchange model including super-exchange () and electron-phonon coupling (). Our model Hamiltonian dagotto ; yunoki ; pradhan1 ; anamitra ; pradhan (see Supplementary Section II for details), effectively a lattice of Mn ions, qualitatively reproduces the phase diagram of manganites. For SCMO (and SSMO) like materials, involving two A-type elements Tokura2 , one generally add such that to model the A-site cationic disorder dagotto ; pradhan . Considering the fact that the ions occupy randomly in the A-site in the polycrystalline SCSMO compound and being larger in size compared with both and creates chemical disorder. This is also evident from the HRTEM images at room temperature, shown in Supplementary Section I(B) [Figs. 6(b) and (c)]. So in order to model SCSMO, we neglect the disorder between Sm and Ca elements and incorporate the Sr disorder by adding at each Mn site picked from the distribution , where is the quenched disorder potential. We add a Zeeman coupling term to the Hamiltonian in an external magnetic field, where are Mn t2g spins to analyze the magnetoresistance. We measure , , , and temperature () in units of kinetic hopping parameter . The estimated value of in manganites is 0.2 eV dagotto .
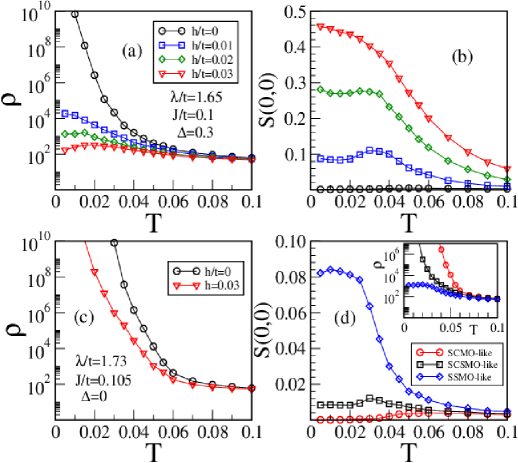
A spin-fermion Monte Carlo (MC) technique based on the travelling cluster approximation tca-ref (TCA) is used on a two dimensional 2424 lattice (see supplementary section II for details). We use = 0.1 and = 1.65 that reproduces the CE-CO-OO-I phase pradhan1 at electron density = = 0.5. The electron density is the number of itinerant electrons per Mn site in our calculations. The system, as shown in Figs. 4(a) and (b), remains insulating at low temperatures for = 0.3 and = 0 and the ferromagnetic structure factor S(0,0) is 0.001 (for an outline of the resistivity and the magnetic structure factor calculations please see Supplementary Section II).
The resistivity at low temperatures decreases with magnetic field [Fig. 4(a)] similar to our experimental results. This is due to the increase of the FM correlations at low temperatures [Fig. 4(b)]. On the other hand, SCMO-like materials [Fig. 4(c)] remains insulating at all temperatures even for = 0.03. Recall that SCMO (SSMO) has smaller (larger) bandwidth than SCSMO. In our model calculations larger (and ) corresponds to smaller bandwidth or vice versa. For clarity we use = 0 (due to the small mismatch between Sm and Ca ionic radii) and set = 1.73, = 0.105 for SCMO-like materials. For SSMO-like materials we set binary disorder dagotto ; pradhan with = 0.3 and use = 1.57, = 0.095. The FM correlations at low temperatures increases and the resistivity decreases from SCMO-like to SCSMO-like to SSMO-like materials [Fig. 4(d)] similar to the experimental results qualitatively Tokura2 ; Tomioka .
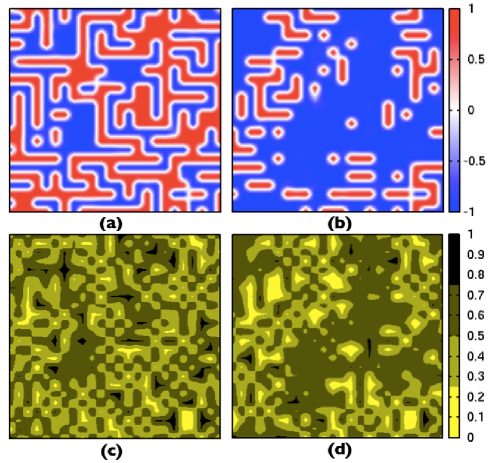
We turn now to understand the magnetoresistance in SCSMO by plotting Monte Carlo snapshots obtained at = 0.01. For = 0.002 the system remains insulating [see Figs. 4 (d)] due to the CE-type correlations without any significant ferromagnetic charge disordered regions [see Figs. 5 (a) and (c)] in the system. For = 0.02, ferromagnetic clusters coexist with zig-zag ferromagnetic chains and the electron density is roughly homogeneous (0.65) within the ferromagnetic clusters [see Figs. 5 (b) and (d)]. Moreover, the ferromagnetic clusters in SCSMO get connected with each other at reasonable large magnetic fields unlike SCMO-like materials for which resistivity decreases at lower temperatures. So, overall the disorder due to Sr ions present in SCSMO weakens the CE-type state of SCMO and seeds the ferromagnetic charge-disordered clusters, but remains insulating at low temperatures. In an external magnetic field ferromagnetic clusters grow and get connected that give rise to a large magnetoresistance in SCSMO samples.
Conclusion
In summary, by controlling electronic phase separation in narrow band width CO-AFM material a record value of magnetoresistance ( in a 30 kOe external magnetic field and in 90 kOe external magnetic field at 10 K ) till date is obtained in SCSMO polycrystalline compound. The observed huge value of magnetoresistance has been explained by model Hamiltonian calculations. We also observed magnetic field induced ultra-sharp meta-magnetic transition at low temperatures. The many order of magnitudes higher MR than any other magnetoresistive materials reported so far will motivate experimenters to design efficient magnetic materials for future applications.
Conflict of Interest
The authors declare no conflict of interest.
Acknowledgements
Sanjib Banik would like acknowledge Department of Atomic Energy (DAE), Govt. of India for finalcial support. K. P. acknowledges the use of TCMP computer cluster at SINP. The authors would like to sincere thanks to P. B. Pal and M. G. Mustafa of SINP for useful discussions. The work at SINP has been supported through CMPID-DAE project.
Author information
I.D. developed the concept of the study. SB and KD prepared the samples. S.B., K.D., and I.D. performed the experimental works and conducted the data analysis. N.P.L did the field dependent XRD measurements, B.S carried out the TEM measurements, and K.P. performed the numerical calculations. S.B., K.D., T.P., K.P., and I.D. wrote the draft of the paper and all authors reviewed the manuscript.
References
- (1) Moritomo, Y., Asamitsu, a., Kuwahara, H. Tokura, Y. Giant magnetoresistance of manganese oxides with a layered perovskite structure. Nature 380, 141-144 (1996).
- (2) Shimakawa, Y., Kubo, Y. Manako, T. Giant magnetoresistance in Ti2Mn2O7 with the pyrochlore structure. Nature 379, 53-55 (1996).
- (3) Uehara, M., Mori, S., Chen, C. H. Cheong, S. W. Percolative phase separation underlies colossal magnetoresistance in mixed-valent manganites. Nature 399, 560-563 (1999).
- (4) Siwach, P. K., Singh, H. Srivastava, O. N. Low field magnetotransport in manganites. J. Phys. Condens. Matter 20, 273201 (2008).
- (5) Ali, M. N. et al. Large, non-saturating magnetoresistance in . Nature 514, 205-208 (2014).
- (6) Tafti, F. F., Gibson, Q. D., Kushwaha, S. K., Haldolaarachchige, N. Cava, R. J. Resistivity plateau and extreme magnetoresistance in LaSb. Nat. Phys. 12, 272-277 (2016).
- (7) Baldini, M. et al. Origin of colossal magnetoresistance in manganite. Proc. Natl. Acad. Sci. 112, 10869-10872 (2015).
- (8) Asamitsu, A., Tomioka, Y., Kuwahara, H. Tokura, Y. Current switching of resistive states in magnetoresistive manganites. Nature 388, 50-52 (1997).
- (9) Bibes, M. Bathelemy, A. Oxide Spintronics, IEEE Trans. Electron Devices 54, 1003-1023 (2007)
- (10) Sawa, A. Resistive switching in transition metal oxides. Mater. Today 11, 28-36 (2008).
- (11) Rubi, D. et al. Two resistive switching regimes in thin film manganite memory devices on silicon. Appl. Phys. Lett. 103, 163506 (2013).
- (12) Hoffman, J. D., Wu, S. M., Kirby, B. J. Bhattacharya, A. Tunable Noncollinear Antiferromagnetic Resistive Memory through Oxide Superlattice Design. Phys. Rev. Appl. 9, 044041 (2018).
- (13) Arulraj, A. et al. Charge ordering in the rare-earth manganates: the origin of the extraordinary sensitivity to the average radius of the A-site cations,. J. Phys. Condens. Matter 10, 8497-8504 (1998).
- (14) Tokura, Y. Tomioka, Y. Colossal magnetoresistive manganites. J. Magn. Magn. Mater. 200, 1-23 (1999).
- (15) Das, A., Babu, P. D., Chatterjee, S. & Nigam, A. K. Ionic size effect in charge-ordered . Phys. Rev. B 70, 224404 (2004).
- (16) Mavani, K. R. Paulose, P. L. Effects of cation disorder and size on metamagnetism in A-site substituted system. Appl. Phys. Lett. 86, 162504 (2005).
- (17) Martin, C. et al. Magnetic phase diagram of Ru-doped manganites: Expansion of ferromagnetism and metallicity. Phys. Rev. B 63, 174402 (2001).
- (18) Mahendiran, R., Raveau, B., Hervieu, M., Michel, C. Maignan, A. Instability of metal-insulator transition against thermal cycling in phase separated Cr-doped manganites. Phys. Rev. B 64, 064424 (2001).
- (19) Pradhan, K., Mukherjee, A., Majumdar, P. Distinct effects of homogeneous weak disorder and dilute strong scatterers on phase competition in manganites. Phys. Rev. Lett. 99, 147206 (2007).
- (20) Das, K., Dasgupta, P., Poddar, A. Das, I. Significant enhancement of magnetoresistance with the reduction of particle size in nanometer scale. Sci. Rep. 6, 20351 (2016)
- (21) Dong, S., Gao, F., Wang, Z. Q., Liu, J. M. Ren, Z. F. Surface phase separation in nanosized charge-ordered manganites. Appl. Phys. Lett. 90, 082508 (2007).
- (22) Das, K., Rawat, R., Satpati, B. Das, I. Giant enhancement of magnetoresistance in core-shell ferromagnetic-charge ordered nanostructures. Appl. Phys. Lett. 103, 202406 (2013).
- (23) Zhu, Y. et al. Chemical ordering suppresses large-scale electronic phase separation in doped manganites. Nat. Commun. 7, 11260 (2016).
- (24) Chen, L. et al. Evolution of the intrinsic electronic phase separation in perovskite. Sci. Rep. 6, 14 (2016).
- (25) Chai, X., Xing, H. & Jin, K. Evolution of photoinduced effects in phase-separated thin films. Sci. Rep. 6, 23280 (2016).
- (26) Shao, J. et al. Emerging single-phase state in small manganite nanodisks. Proc. Natl. Acad. Sci. 113, 9228-9231 (2016).
- (27) Zhang, K. et al. Manipulating electronic phase separation in strongly correlated oxides with an ordered array of antidots. Proc. Natl. Acad. Sci. 112, 9558-9562 (2015).
- (28) Elovaara, T., Majumdar, S., Huhtinen, H. & Paturi, P. Photoinduced Colossal Magnetoresistance under Substantially Reduced Magnetic Field. Adv. Funct. Mater. 25, 5030-5037 (2015).
- (29) Zhang, K. et al. Quantum Percolation and Magnetic Nanodroplet States in Electronically Phase-Separated Manganite Nanowires. Nano Lett. 17, 1461-1466 (2017).
- (30) Tokura, Y. Critical features of colossal magnetoresistive manganites. Reports Prog. Phys. 69, 797-851 (2006).
- (31) Tomioka, Y., Hiraka, H., Endoh, Y. Tokura, Y. Multicritical phase diagram of the electronic states single crystals with controlled carrier density. Phys. Rev. B 74, 104420 (2006). Gong, G. Q. et al. Colossal magnetoresistance in the antiferromagnetic system. J. Appl. Phys. 79, 4538 (1996).
- (32) Prellier, W. et al. High magnetic field transport measurements of charge-ordered strained thin films. Phys. Rev. B 66, 0.24432 (2002).
- (33) Buzin, E. R. et al. Control of the colossal magnetoresistance by strain effect in thin films. 79, 647 (2001).
- (34) Rauwel, E., Prellier, W., Mercey, B., Brion, S. De & Chouteau, G. Stress deformations and structural quenching in charge-ordered thin films. 98, 093903 (2005).
- (35) Ghivelder, L. et al. Abrupt field-induced transition triggered by magnetocaloric effect in phase-separated manganites. Phys. Rev. B 69, 214414 (2004).
- (36) Tang, T., Huang, R. S. Zhang, S. Y. Ultra-sharp metamagnetic transition in manganite . J. Magn. Magn. Mater. 321, 263-266 (2009).
- (37) Mahendiran, R. et al. Ultrasharp magnetization steps in perovskite manganites. Phys. Rev. Lett. 89, 286602 (2002).
- (38) Rana, D. S., Nirmala, R. Malik, S. K. Ultra-sharp metamagnetic transitions in the half-doped manganite compound . Eur. Lett. 70, 376-382 (2005).
- (39) Kurbakov, A. I. et al. Crystal structure and magnetic and transport properties of : A -type antiferromagnetic phase and ferromagnetic polarons. Phys. Rev. B 72, 184432 (2005).
- (40) Kurbakov, A. I., Lazuta, A. V. & Ryzhov, V. A. Phase diagram of perovskite manganites. J. Phys. Conf. Ser. 200, 012099 (2010).
- (41) Dagotto, E. Complexity in Strongly Correlated Electronic Systems. Science. 309, 257-262 (2005).
- (42) Maji, B., Suresh, K. G. Nigam, A. K. Observation of spontaneous magnetization jump and field-induced irreversibility in . Europhys. Lett. 91, 37007 (2010).
- (43) Liao, D., Sun, Y., Yang, R., Li, Q. Cheng, Z. Spontaneous magnetization and resistivity steps in the bilayered manganite . Phys. Rev. B 74, 174434 (2006).
- (44) Wu, T. Mitchell, J. F. Magnetization steps in manganite films:Time delay of the metamagnetic transition. Phys. Rev. B 69, 100405 (2004).
- (45) Shankaraiah, N., Murthy, K. P. N., Lookman, T. Shenoy, S. R. Incubation times and entropy barriers in martensitic kinetics: Monte Carlo quench simulations of strain pseudospins. Europhys. Lett. 92, 36002 (2010).
- (46) Hardy, V. et al. Observation of spontaneous magnetization jumps in manganites. Phys. Rev. B 68, 220402(R) (2003).
- (47) Dagotto, E., Hotta, T., Moreo, A. Colossal magnetoresistant materials: the key role of phase separation. Phys. Rep. 344, 1-153 (2001).
- (48) Yunoki, S., Moreo, A. Dagotto, E. Phase separation induced by orbital degrees of freedom in models for manganites with Jahn-Teller phonons. Phys. Rev. Lett. 81, 5612 (1998).
- (49) Mukherjee, A., Pradhan, K. Majumdar, P. Conductance switching and inhomogeneous field melting in the charge ordered manganites. Europhys. Lett. 86, 27003 (2009).
- (50) Pradhan, K. Yunoki, Y. Nanoclustering phase competition induces the resistivity hump in colossal magnetoresistive manganites. Phys. Rev. B 96, 214416 (2017).
- (51) Kumar, S. Majumdar, P. A travelling cluster approximation for lattice fermions strongly coupled to classical degrees of freedom. Eur. Phys. J. B 50, 571-579 (2006).
- (52) Mahan, G. D., Quantum Many Particle Physics (Plenum Press, New York, 1990).
- (53) Kumar, S. Majumdar, P. Anti-localisation to strong localisation: The interplay of magnetic scattering and structural disorder. Europhys. Lett. 65, 75 (2004).
supplementary information
I. Experimental Work
.1 X-ray diffraction study
The room temperature XRD data has been profile fitted using Pnma space group and shows the single phase nature of the sample with orthorhombic structure. The low temperature data has also been tried to fit with single Pnma space group but does not give satisfactory fitting. Previously it was reported that sample undergoes crystallographic phase coexistence at low temperature with monoclinic P21/m symmetryKurbakov . Since the present sample is in between and , we had tried to fit the low temperature (15 K) XRD data with P21/m but it also does not give any satisfactory fitting. Finally, fitting with Pnma+P21/m gives the best fit. We present the extracted lattice parameters in Table. I.
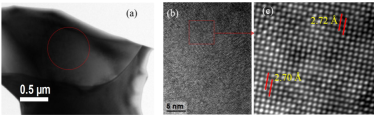
.2 HRTEM study
A typical TEM image of a crystallite of the sample has been presented in Fig. 6(a). In the marked portion electron diffraction pattern has been taken which has been shown in the Fig. 1 (e) of the main text. The HRTEM image of the sample at room temperature is presented in Fig. 6(b) and Fig. 6(c) is the magnified view of the small domain. It shows the change in contrast due to the segregation of different atoms in the atomic scale. The interplanar spacing has been shown in the figure. Here another point needs to mention that the error bar in determining the interplanar spacing in the figure is Satpati .
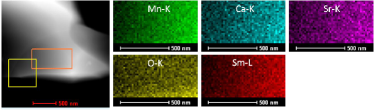
.3 EDS Analysis
The EDS analysis in scanning transmission electron microscopy high angle annular dark field (STEM-HAADF) mode was carried out with a 2 nm probe and shows that the crystal is having highly homogeneous distribution of elements [Fig. 7]. The chemical analysis (see Table. II) confirms the stoichiometric nature of the compound.
| Temperature (K) | Space group | a () | b () | c () | V () | |
|---|---|---|---|---|---|---|
| 300 | Pnma | 5.395 | 7.611 | 5.408 | 222.049 | |
| 15 | Pnma + P21/m | 5.456 | 7.618 | 5.384 | 223.804 | Pnma |
| 15 | Pnma + P21/m | 5.380 | 10.849 | 7.569 | 441.802 | P21/m |
| Element | Atomic % |
|---|---|
| O (K) | 59.39 |
| Ca (K) | 4.94 |
| Mn (K) | 20.43 |
| Sr (K) | 5.71 |
| Sm (L) | 9.50 |
.4 Thermoremanent magnetization measurements
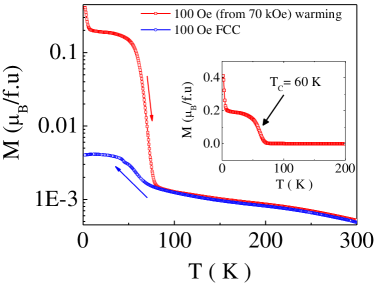
Thermoremanent magnetization measurements were carried out by the following protocol: the sample was cooled down from the room temperature in the presence of 100 Oe external magnetic field and the magnetization data was recorded (denoted by 100 Oe FCC in Fig. 8). The 100 Oe FCC data indicates the presence of very small fraction of ferromagnetic phase. After reaching the specified temperature (T = 2 K), magnetic field increases from 100 Oe to 70 kOe and stayed for some time (approximately 5 mins). After that magnetic field was reduced to 100 Oe and magnetization data was recorded during warming cycle (see Fig. 8). During the warming cycle the system changes to a paramagnetic phase at 60 K.
.5 Heat Capacity Measurements
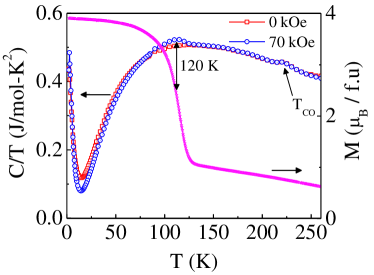
Around 120 K, magnetization data measured at 70 kOe field also shows a sharp increase like paramagnetic to ferromagnetic transition [see Fig.9]. Thus the kink at 120 K in the heat capacity is associated with the paramagnetic to ferromagnetic transition. Though in the virgin sample around 120 K there is an antiferromagnetic transition as observed from the derivative of M(T) data in 100 Oe field. Therefore, it can be concluded that 70 kOe field converts the AFM fraction to FM phase which results in the rise in the peak in C/T versus T data (see Fig. 9). Additionally, the sharper increasing nature of C/T below 15 K is observed which is due to the magnetic ordering of ionsTomy ; Midya .
.6 Sweep rate dependent magnetization
Isothermal magnetization (at 2 K) has been measured in ZFC mode for different field sweep rate (10 Oe/sec and 200 Oe/sec) and the corresponding plot is presented in Fig. 10. For lowest sweep rate (10 Oe/sec) jump occurs at higher field compared to that of the maximum sweep rate. For lower sweep rate lattice has adequate time to accommodate the induced interfacial strain between AF and FM domains but for higher sweep rate strain propagates rapidly and conversion to FM phase take place. This scenario indicates the martensitic nature of the transition.
.7 Resistivity Relaxation study at 25 K
To investigate the dynamics of the resistivity jumps we performed resistivity relaxation measurements at T = 25 K (sample was ZFC from room temperature down to 25 K) by applying three different magnetic fields () smaller than the as shown in Fig. 11. Resistivity of the sample as a function of time shows resistivity jumps at different incubation time. The incubation time, time spent before the jumps, increases from 20 Sec to 1000 Sec with decrease in the applied magnetic field. For the fixed temperature (25 K), with decrease in the applied magnetic field the elastic barrier height (arises due to the lattice strain at low temperature discussed earlier) increases and for that reason system needs more incubation time to overcome the elastic barrier for burst-like growth of the ferromagnetic fractions in the expense of the antiferromagnetic components. This type of relaxation behavior is generally the characteristics of standard martensitic transformationsMaji ; Lion ; Wu ; Shankaraiah ; Hardy .
II. Model Hamiltonian and Method
We consider following two-band double-exchange model dagotto1 for electrons, Hund’s coupled to (Mn core spins) in a square lattice:
| (3) | |||||
Here, () is the annihilation (creation) operator for electrons and , are the two Mn- orbitals and . are hopping amplitudes between nearest-neighbor sites in and directions: , , , . is the Hund’s coupling between electron spin and spin at site . The electrons are also coupled to Jahn-Teller phonons by . is antiferromagnetic super-exchange coupling between the spins. We treat and as classical variables yunoki1 ; class-ref and adopt the double-exchange limit dagotto1 , i.e. . We set K (stiffness of Jahn-Teller modes) and to be 1. This well studied model Hamiltonian qualitatively reproduces the phase diagram of manganites. The chemical potential is adjusted to fix the the electron density at 0.5. We include effect of disorder by adding term to the Hamiltonian, where is the quenched disorder potential.
We applied Monte-Carlo simulation to the classical variables and , and an exact diagonalization scheme is employed to the fermionic sector ( electrons). We used travelling cluster approximation (TCA) tca-ref based Monte-Carlo to handle large system size ( lattice). We annealed the randomized classical spins and lattice distortions in an arbitrary quenched disorder configuration, and anneal down from temperature = 0.1 ( is the hopping parameter). The resistivity, in units of (: lattice constant) is obtained by calculating the dc limit of the conductivity using the Kubo-Greenwood formalism mahan-book ; cond-ref . The magnetic structure factor at wave vector is calculated from = e. Physical quantities, i.e. resistivity are averaged over ten different disorder configurations in addition to the thermal averages taken during the Monte Carlo simulations.
References
- (1) Kurbakov, A. I., Lazuta, A. V. Ryzhov, V. A., Phase diagram of perovskite manganites. J. Phys. Conf. Ser. 200, 012099 (2010).
- (2) Satpati, B., Satyam, P. V., Som, T. Dev, B. N. Nanoscale ion-beam mixing in Au-Si and Ag-Si eutectic systems. Appl. Phys. A Mater. Sci. Process. 79, 447-451 (2004).
- (3) OFlynn, D., Tomy, C. V., Lees, M. R., Daoud-Aladine, A. Balakrishnan, G. Multiferroic properties and magnetic structure of . Phys. Rev. B 83, 174426 (2011).
- (4) Midya, A., Das, S. N., Mandal, P., Pandya, S. Ganesan, V. Anisotropic magnetic properties and giant magnetocaloric effect in antiferromagnetic crystals (R = Dy, Tb, Ho, and Yb). Phys. Rev. B 84, 235127 (2011).
- (5) Maji, B., Suresh, K. G. Nigam, A. K. Observation of spontaneous magnetization jump and field-induced irreversibility in . Europhys. Lett. 91, 37007 (2010).
- (6) Liao, D., Sun, Y., Yang, R., Li, Q. Cheng, Z. Spontaneous magnetization and resistivity steps in the bilayered manganite . Phys. Rev. B 74, 174434 (2006).
- (7) Wu, T. Mitchell, J. F. Magnetization steps in manganite films:Time delay of the metamagnetic transition. Phys. Rev. B 69, 100405 (2004).
- (8) Shankaraiah, N., Murthy, K. P. N., Lookman, T. Shenoy, S. R. Incubation times and entropy barriers in martensitic kinetics: Monte Carlo quench simulations of strain pseudospins. Europhys. Lett. 92, 36002 (2010).
- (9) Hardy, V. et al. Observation of spontaneous magnetization jumps in manganites. Phys. Rev. B 68, 220402 (2003).
- (10) Dagotto, E., Hotta, T. Moreo, A. Colossal magnetoresistant materials: the key role of phase separation. Phys. Rep. 344, 1-153 (2001).
- (11) Yunoki, S., Hu, J., Malvezzi, A. L., Moreo, A., Furusaki, N. Dagotto, E. Phase separation in electronic models for manganites Phys. Rev. Lett. 80, 845 (1998).
- (12) Dagotto, E., Yunoki, S., Malvezzi, A. L., Moreo, A., Hu, J., Capponi, S., Poilblanc, D. Furukawa, N. Ferromagnetic Kondo model for manganites: Phase diagram, charge segregation, and influence of quantum localized spins. Phys. Rev. B 58, 6414 (1998).
- (13) Kumar, S. Majumdar, P. A travelling cluster approximation for lattice fermions strongly coupled to classical degrees of freedom. Eur. Phys. J. B 50, 571 (2006).
- (14) Mahan, G. D., Quantum Many Particle Physics (Plenum Press, New York, 1990).
- (15) Kumar, S. Majumdar, P. Anti-localisation to strong localisation: The interplay of magnetic scattering and structural disorder. Europhys. Lett. 65, 75 (2004).