Finite size scaling theory for percolation phase transition
Abstract
The finite-size scaling theory for continuous phase transition plays an important role in determining critical point and critical exponents from the size-dependent behaviors of quantities in the thermodynamic limit. For percolation phase transition, the finite-size scaling form for the reduced size of largest cluster has been extended to cluster ranked . However, this is invalid for explosive percolation as our results show. Besides, the behaviors of largest increase of largest cluster induced by adding single link or node have also been used to investigate the critical properties of percolation and several new exponents , , and are defined while their relation with and is unknown. Through the analysis of asymptotic properties of size jump behaviors, we obtain correct critical exponents and develop a new approach to finite size scaling theory where sizes of ranked clusters are averaged at same distances from the sample-dependent pseudo-critical point in each realization rather than averaging at same value of control parameter.
Introduction— Percolation, as one of the fundamental models in statistical and condensed matter physics, was widely believed to be a typical continuous phase transition for different space dimensions and various networks architecturesStauffer94 ; Dorogovtsev08 . Therefore, the so-called explosive percolation (EP) which was proposed and reported to be discontinuous by Achlioptas et al.Achlioptas has attracted much attention and been extensively studied ever sinceBastas14 . For EP under product rule (PR)Achlioptas , instead of adding bonds one by one randomly in the original Erdös-Rényi (ER) modelER , at each step two randomly-picked unoccupied bonds are considered and only the one with smaller product of the sizes of the two clusters to be connected will be added while the other one is discarded. This slight modification of growth procedure leads to so significant change of the properties of percolation as to arouse much popular interest. After all, EP was proved both analyticallyRiordan11 ; Costa10 ; Costa14 and numericallyLee11 ; Grassberger11 ; Liu11 ; Fan12 ; Bastas11 ; Zhu14 ; Tian12 to be indeed continuous phase transition with critical exponents different from ordinary percolation.
In the study of phase transition and critical phenomena, Monte Carlo simulation along with finite size scaling (FSS) theory has always been one of the most important tools since most models could not be solved analytically. FSS theory describes a build-up of the bulk properties when a small system is increased in size. For continuous percolation phase transition, the order parameter which is usually defined as the reduced size of the largest cluster follows a finite size scaling formprivman1 ; privman2
| (1) |
where the controlling parameter denotes the number of added edges divided by the system size and is the reduced deviation from the critical point . The critical exponent characterizes the divergence of correlation length . The finite size scaling behaviour is valid in the asymptotic critical region with and . Obviously, can be determined from the size-dependent behaviors of right at the critical point .
In addition, the distribution of order parameter at critical point satisfies a analogous finite size scaling hypothesisBinder81 ; Bruce92
| (2) |
Despite the nature of continuous phase transition, EP shows unusual finite size behaviors. Rather than single humped as in ordinary percolation, is double humped in various EP modelsGrassberger11 ; Tian12 . Although the distance between the two peaks decreases with system size in power-law, data collapse can be roughly achieved for each peak separately with different exponents . Double-humped distribution of order parameter is also found at the pseudo-critical point where the average cluster size reaches its peakRad10 .
Models and Method— We carry out extensive Monte Carlo (MC) simulation of ER model ER , PR model Achlioptas , CDGM model Costa10 and track the cluster information with the effective algorithm of Newmann and Ziff Newmann00 ; Newmann01 . In each realization of networks, we start with isolated nodes and then edges are added according to corresponding rules.
The critical point of ER model is known as and critical exponents . PR model has been extensively studied with finite size scaling theory in Ref. Fan12 and it is reported that
| (3) |
For the CDGM model, according to the detailed analysis by Costa et al. Costa10 ; Costa14 , we have
| (4) |
Then we can get .
As has been demonstrated Jan98 ; Jan99 ; Macleod98 , the finite size scaling form of also stands for the sizes of second, third…larest cluster. To be explicit, for the cluster ranked , we have
| (5) |
Therefore, all the sizes of ranked clusters scale as at the critical point . Besides, the intersection of curves with different system sizes can be used to estimate critical point Liu11 ; Fan12 ; Zhu14 ; Silva00 ; Silva02 ; Alb05 since it is a -independent constant at critical point.
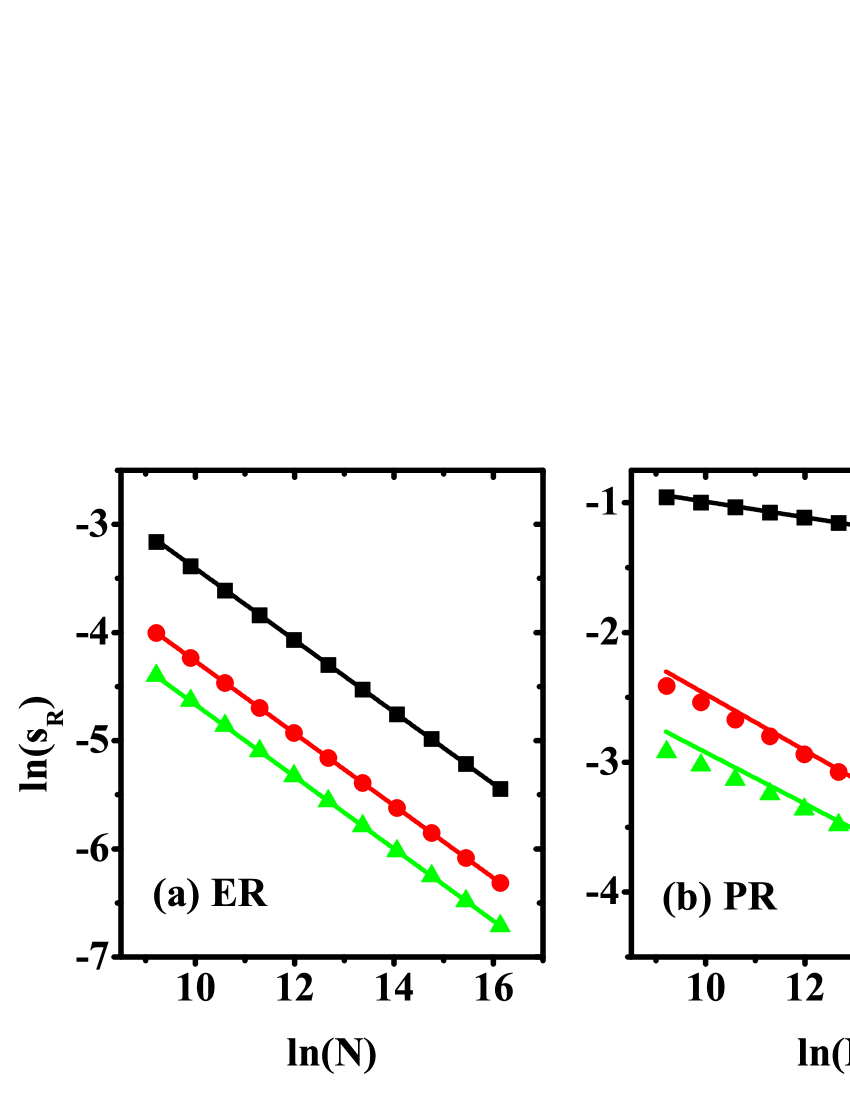
In Fig.1(a), with respect to at the critical point for the ER model is shown. We see excellent and parallel straight lines and the critical exponent ratios estimated from , and are respectively , and which are equal to each other within error bar and agree quite well with the analytic value mentioned above.
However, it’s quite different for explosive percolation transitions as shown in Fig.1(b) and (c) for PR and CDGM model respectively. It’s clear that and decrease much faster than with the increase of and obvious finite size effects appear. Through the linear fitting of data with system size , the critical exponent ratios for the three largest clusters are estimated as , and for PR model and , and for CDGM model respectively. As a consequence, at turns to be -dependent in EP. Furthermore, for CDGM model, none of the obtained agrees with previous analytical result .
Apart from the behaviors of the average value of ranked clusters, percolation phase transitions can also be characterized by the size jump behaviors of order parameter in each realization of networksLee11 ; Nagler11 ; Qian12 ; Fan14a ; Fan14b ; Zhu14 . Here, we define sample-dependent pseudo-critical point as the where order parameter exhibits a sudden biggest jump in -th realization and the corresponding jump gap is denoted as . For a network of each size , realizations of network are made. From the results of all simulations, we can calculate the averages
| (6) | |||||
| (7) |
and root mean squares of fluctuations and
| (8) | |||||
| (9) |
The following finite size scaling hypotheses are made and confirmed by simulation data for continuous percolation Zhu14 ; Fan14a ; Fan14b
| (10) | ||||
| (11) | ||||
| (12) | ||||
| (13) |
We anticipate that not only the largest but also the second, third… largest jump of order parameter and the corresponding sample-dependent pseudo-critical points are related to percolation phase transition and satisfy the finite size scaling hypotheses above. Denote as the average sample-dependent pseudo-critical point where the th largest jump of occurs, then it’s easy to get
| (14) |
It provides a more reliable way to estimated because is quite sensitive to the value of when fitting with Eq.(10).
Results of MC simulation— The asymptotic properties of the above four quantities associated with the size jump behaviors of order parameter are shown in Fig.2. For the sake of comparison, data of and are plotted together while data of and are plotted together.
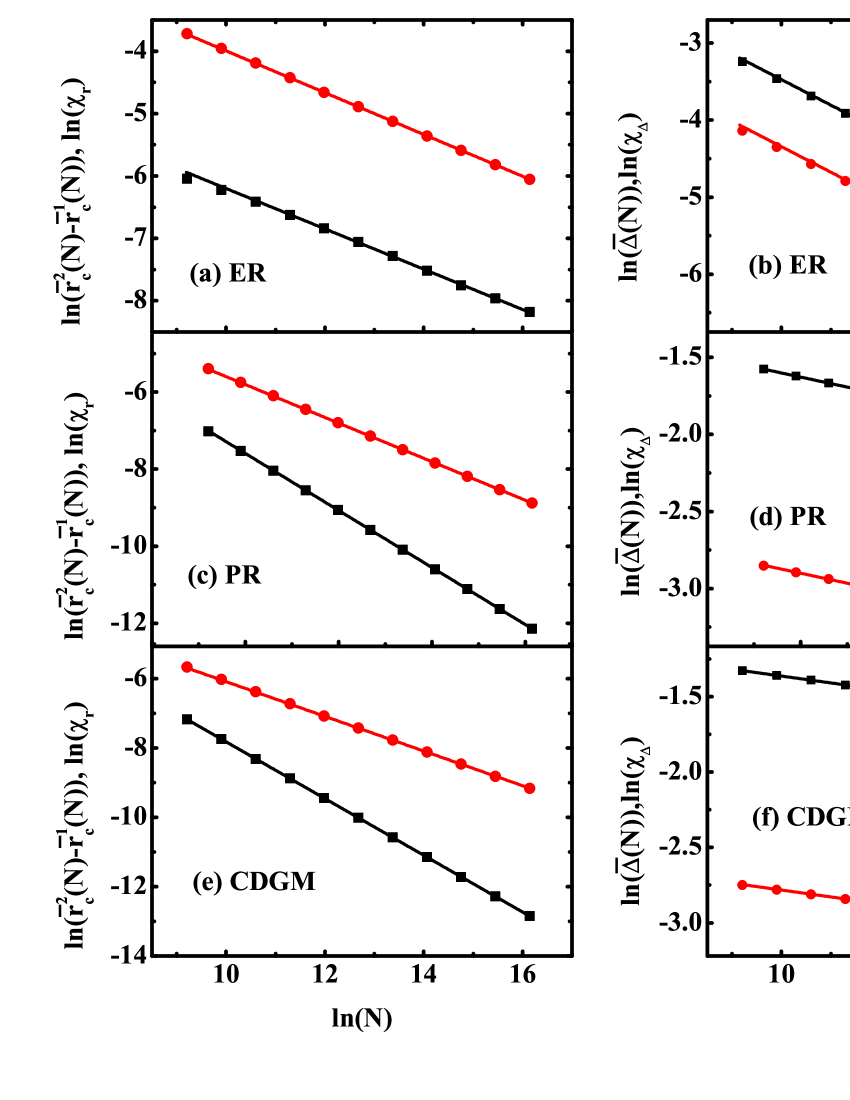
In Fig.2(a) and (b), we can see clearly two parallel lines in each panel for ER model. From the slope of fitting lines, we get and which are in consistent with , along with and which are in consistent with .
For PR model, fitting lines for and in Fig.2(c) are apparently not parallel, indicating critical exponent is different from . From their slopes, we get and . The asymptotic behaviors of and are shown in Fig.2(d). The exponents and are obtained.
As shown in Fig.2(e) and (f), the situation for CDGM model is similar to PR model. Critical exponents are estimated as , , and . In comparison with the results of Costa et al. Costa10 ; Costa14 , is consistent with while and are in accordance with . So far, from the jump behaviors of largest cluster, the inherent critical exponents and for CDGM model are obtained. Likewise, we infer those for PR model are and . All the critical exponents obtained in this section are summarized in Table 1. It’s worth mentioning that, with standard FSS theory, for PR model is estimated as 0.5Fan12 which is equal to . It’s not a coincidence since same phenomenon can be observed for CDGM model.
| Model | ||||
|---|---|---|---|---|
| ER | 0.331(3) | 0.331(6) | 0.333(4) | 0.335(2) |
| PR | 0.0650(2) | 0.0650(1) | 0.740(1) | 0.501(3) |
| CDGM | 0.0455(1) | 0.0458(3) | 0.818(1) | 0.500(4) |
Modified Finite Size Scaling Theory— In standard finite size scaling theory for percolation, an quantity is averaged over the different samples at the same value of control parameter or at the same shift from the critical point of infinite systems. For instance, the reduced sizes of ranked clusters are computed as
| (15) |
where is the deviation from critical point , the superscript stands for the th sample or realization and stands for ensemble average.
In the field of disorder systems Stinchcombe ; Shalaev ; Selke where the disorders are usually induced by site dilution or bond-randomness, there is an additional source of fluctuation from the variation in the transition temperature itself besides thermal fluctuations. So, different measured values are obtained in every sample with different configuration of the quenched disorder. Therefore, instead of the conventional finite size scaling, a sample dependent scaled variable is proposed to be where is a pseudo-critical temperature of sample . In terms of , a quantity after thermal averaging is expected to show a sample dependent finite size scaling form Wiseman95 ; Pazmandi ; Wiseman98a ; Wiseman98b ; Bernarder00
| (16) |
which is equivalent to the common one in Ref.Barber . As mentioned in Ref.Wiseman98b , with the same and from different samples are still slightly different. Thus, whether it’s necessary to do the sample averaging leads to the problem of self-averaging. If the ratio of variance and the square of shift converges to 0 as , indicating that the distribution of tends to be a -function right at , then possesses the property of self-averaging. In this case, the measurement of in one large sample will provide a good estimate of the sample average.
However, percolation is a typical non-self-averaging model since neither nor is self-averaging in any model we studied here according to the scaling of , , and . So we define the reduced sizes of ranked clusters in percolation process as
| (17) |
where is the deviation from pseudo-critical point in each realization and averaging over different realizations are made at the same . Then we anticipate a finite-size scaling form of as
| (18) |
where is the reduced deviation from sample-dependent pseudo-critical point. The critical exponent is inferred to be and inferred to be obtained from the size jump behaviors of largest cluster as summarized in Table 1.
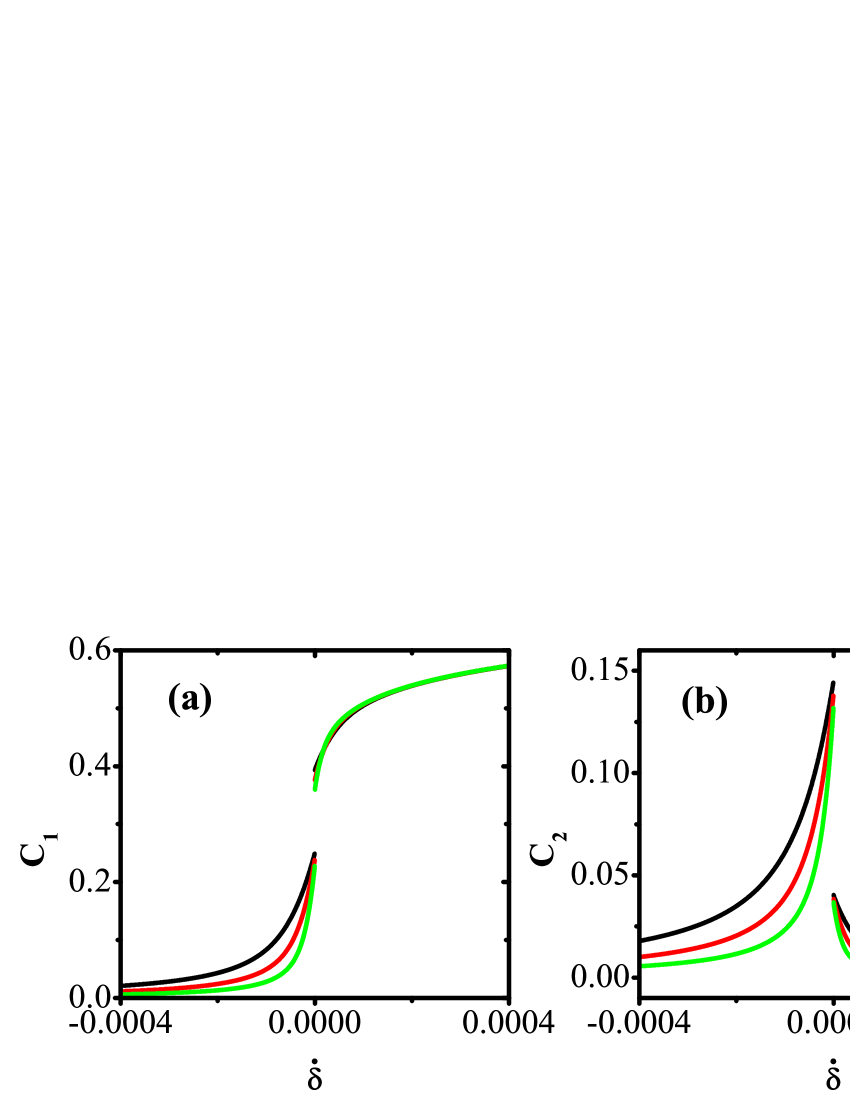
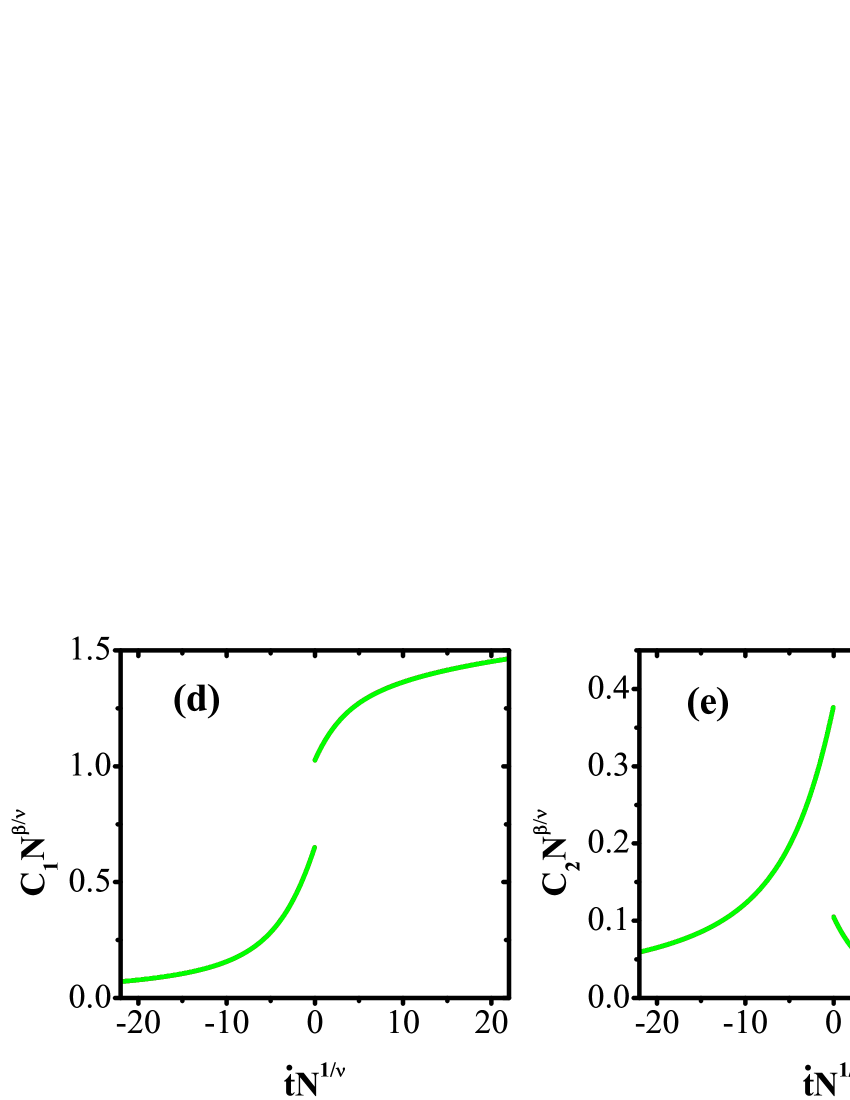
Without loss of generality, we take PR model as an example. In Fig.3(a)(b)(c), the modified ranked clusters , and with respect to are plotted with and the curves of with behave in the similar way as and . Due to the way of averaging, the largest gap of largest cluster is revealed as sudden sharp increase of at . Meanwhile, and show sudden sharp decrease. The sudden changes of at seem to announce the discontinuity of percolation. However, it’s only finite size effect because the size jumps in will converge to 0 as as we demonstrated above. In fact, at the pseudo-critical point in each realization of network, the largest cluster merges with the second largest one to become the new largest cluster and the ranks of other clusters all rise by one. Therefore, the gap of at are actually the right before the jump.
In Fig.3(d)(e)(f), we demonstrate the modified FSS functions with respect to the scaled variable where and for PR model. Obviously, data of with different system sizes collapse together almost perfectly and it remains so in the range much larger than we show here. In contrast, as shown in Ref.Fan12 , in the framework of standard FSS theory, curves of of PR model with different system sizes separate soon as the scaled variable .
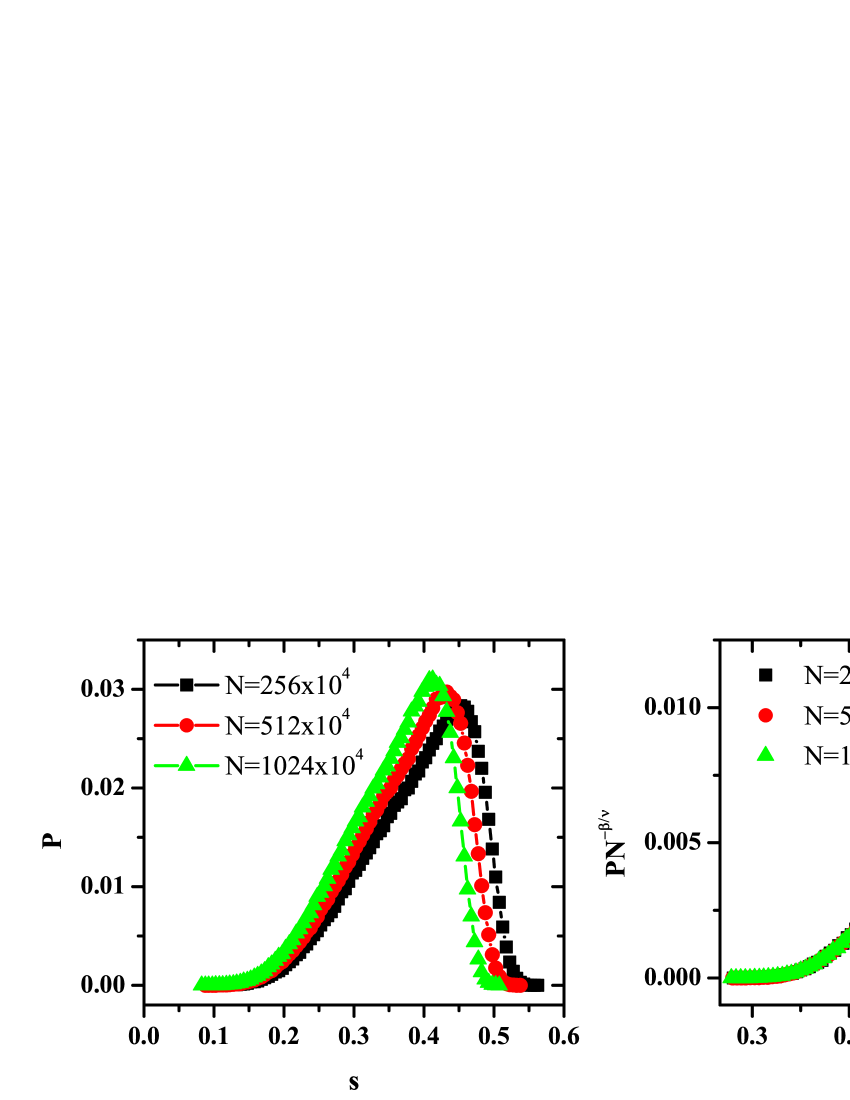
As we mentioned above, the distribution of order parameter at the critical point of infinite system exhibits double peaks. That’s because is larger than the sample-dependent pseudo-critical point in some realizations while not in the others. In this case, the distribution of order parameter should be measured at the sample-dependent pseudo-critical point where rather than at . As presented for PR model in Fig.4, distribution exhibits only one peak and could be perfectly collapsed into a scaling function where .
Summary— In summary, we have studied the finite size scaling behaviors of both classic random percolation and explosive percolation in random networks with Monte Carlo simulation.
In the framework of standard FSS theory, sizes of ranked clusters, , all converge to zero in power-law with exponent at the critical point. However, with different leads to different in explosive percolation. Moreover, the obtained critical exponents and for CDGM model are not in consistent with the analytical results.
During the process of adding edge one by one to complex networks, the size of largest cluster experiences a series of jumps which are closely related to phase transition. We define the reduced edge number at which the largest size jump of largest cluster induced by single edge occurs in each realization as sample-dependent pseudo-critical point. From the asymptotic behaviors of sample-dependent pseudo-critical points and size jumps there, we obtain right critical exponents for explosive percolation. Based on this, we propose a modified finite size scaling form where sizes of ranked clusters are averaged at same distances from the sample-dependent pseudo-critical point in each realization instead of averaging at same value of control parameter.
References
- (1) D. Stauffer and A. Aharony, Introduction to Percolation Theory(Taylor & Francis, London, 1994).
- (2) S. N. Dorogovtsev, A. V. Goltsev, and J. F. F. Mendes, Rev. Mod. Phys. 80, 1275 (2008).
- (3) D. Achlioptas, R. M. D’Sousa and J. Spencer, Science 323, 1453 (2009).
- (4) N. Bastas, P. Giazitzidis, M. Maragakis, and K. Kosmidis,Phys. A 407, 54 (2014), and references therein.
- (5) P. Erdös and A. Rényi, Publ. Math. Inst. Hungar. Acad. Sci.5, 17 (1960).
- (6) O. Riordan and L. Warnke, Science 333, 322 (2011).
- (7) R. A. da Costa, S. N. Dorogovtsev, A. V. Goltsev, and J. F. F. Mendes, Phys. Rev. Lett. 105, 255701 (2010).
- (8) R. A. da Costa, S. N. Dorogovtsev, A. V. Goltsev, and J. F. F. Mendes, Phys. Rev. E 90, 022145 (2014).
- (9) H. K. Lee, B. J. Kim, and H. Park, Phys. Rev. E 84, 020101(R) (2011).
- (10) P. Grassberger, C. Christensen, G. Bizhani, S. W. Son, and M. Paczuski, Phys. Rev. Lett. 106, 225701 (2011).
- (11) M.X. Liu, J.F. Fan, L.S. Li, and X.S. Chen, Eur. Phys. J. B 85, 132 (2012).
- (12) J.F. Fan, M.X. Liu, L.S. Li, and X.S. Chen, Phys. Rev. E 85, 061110 (2012).
- (13) N. Bastas, K. Kosmidis, and P. Augyrakis, Phys. Rev. E 84, 066112 (2011).
- (14) L. Tian and D.N. Shi, Phys. Lett. A 376, 286 (2012).
- (15) Y. Zhu, Z.Q. Yang, X. Zhang, and X.S. Chen, accepted by Commun. Theor. Phys.
- (16) V. Privman and M. E. Fisher, Phys. Rev. B 30, 322 (1984).
- (17) V. Privman, Finite-size Scaling and Numerical Simulation of Statistical Systems, World Scientific, Singapore, (1900).
- (18) K. Binder, Z. Phys. B 43, 119 (1981).
- (19) A. D. Bruce and N. B. Wilding, Phys. Rev. Lett. 68, 193 (1992).
- (20) F. Radicchi and S. Fortunato, Phys. Rev. E 81, 036110 (2010).
- (21) M. E. J. Newmann and R. M. Ziff, Phys. Rev. Lett. 85, 4104 (2000).
- (22) M. E. J. Newmann and R. M. Ziff, Phys. Rev. E 64, 016706 (2001).
- (23) N. Jan, D. Stauffer, and A. Aharony, J. Stat. Phys. 92, 325 (1998).
- (24) N. Jan, Physica A 266, 72 (1999).
- (25) S. Macleod and N. Jan, Int. J. Mod. Phys. C 9, 289 (1998).
- (26) C. R. da Silva, M. L. Lyra, and G. M. Viswanathan, Int. J. Mod. Phys. C 11, 1411 (2000).
- (27) C. R. da Silva, M. L. Lyra, and G. M. Viswanathan, Phys. Rev. E 66, 056107 (2002).
- (28) S. S. Albuquerque, F. A. B. F. de Moura, M. L. Lyra and A. J. F. de Souza, Phys. Rev. E 72, 016116 (2005).
- (29) J. Nagler, A. Levina and M. Timme, Nat. Phys. 7, 265 (2011).
- (30) J.H. Qian, D.D. Han and Y.G. Ma, Eur. Phys. Lett. 100, 48006 (2012).
- (31) J.F. Fan and X.S. Chen, Eur. Phys. Lett. 107, 28005 (2014).
- (32) J.F. Fan, M.X. Liu, Y. Zhu, and X.S. Chen, to be submitted.
- (33) R. B. Stinchcombe, in Phase Transitions and Critical Phenomena, edited by C. Domb and J. L. Lebowitz (Academic, New York, 1983), Vol. 7.
- (34) B. N. Shalaev, Phys. Rep. 237, 129 (1994).
- (35) W. Selke, L. N. Schur and A. L. Talapov, in Annual Reviews of Computational Physics, edited by D. Stauffer (World Scientific, Singapore, 1994), p. 17.
- (36) M. N. Barber, in Phase Transitions and Critical Phenomena, edited by C. Domb and J. L. Lebowitz (Academic, New York, 1983), Vol. 8.
- (37) S. Wiseman and E. Domany, Phys. Rev. E 52, 3469 (1995).
- (38) F. Pazmandi, R. T. Scalettar adn G. T. Zimanyi, Phys. Rev. Lett. 79, 5130 (1997).
- (39) S. Wiseman and E. Domany, Phys. Rev. E 58, 2938 (1998).
- (40) S. Wiseman and E. Domany, Phys. Rev. Lett. 81, 22 (1998).
- (41) K. Bernarder, F. Pazmandi and G. G. Batrouni, Phys. Rev. Lett. 84, 4477 (2000).