Absolute dimensions of the F-type eclipsing binary V2154 Cygni
Abstract
We report spectroscopic observations of the 2.63 day, detached, F-type main-sequence eclipsing binary V2154 Cyg. We use our observations together with existing photometric measurements to derive accurate absolute masses and radii for the stars good to better than 1.5%. We obtain masses of and , radii of and , and effective temperatures of K and K for the primary and secondary stars, respectively. Both components appear to have their rotations synchronized with the motion in the circular orbit. A comparison of the properties of the primary with current stellar evolution models gives good agreement for a metallicity of , which is consistent with photometric estimates, and an age of about 2.2 Gyr. On the other hand, the K2 secondary is larger than predicted for its mass by about 4%. Similar discrepancies are known to exist for other cool stars, and are generally ascribed to stellar activity. The system is in fact an X-ray source, and we argue that the main site of the activity is the secondary star. Indirect estimates give a strength of about 1 kG for the surface magnetic field on that star. A previously known close visual companion to V2154 Cyg is shown to be physically bound, making the system a hierarchical triple.
Subject headings:
binaries: eclipsing — stars: evolution — stars: fundamental parameters — stars: individual (V2154 Cyg) — techniques: photometric1. Introduction
V2154 Cyg (also known as HD 203839, HIP 105584, BD+47 3386, and TYC 3594-1060-1; ) is a 2.63 day eclipsing binary discovered by the Hipparcos team (Perryman, 1997), and found independently in 1996 by Martin (2003) in the course of a search for variable stars in the open cluster M39. Light curves in the Strömgren system were published by Rodríguez et al. (2001), but the physical properties of the components were not derived by them because spectroscopy was lacking. The only spectroscopic work we are aware of are brief reports by Kurpinska-Winiarska & Oblak (2000) listing preliminary values for the velocity amplitudes, and by Oblak et al. (2004) giving preliminary masses and radii, though details of those analyses are unavailable. The very unequal depths of the eclipses (0.3 mag for the primary and 0.05 mag for the secondary) suggest stars of rather different masses, making it an interesting object for followup because of the increased leverage for the comparison with stellar evolution models. This motivated us to carry out our own high-resolution spectroscopic observations of this star, which we report here. V2154 Cyg is known from Tycho-2 observations to have a close, 047 visual companion about two magnitudes fainter than the binary ( mag, mag; Fabricius & Makarov, 2000). We show below that it is physically associated, making V2154 Cyg a hierarchical triple system.
While the primary of the eclipsing pair is an early F star, the secondary is a much smaller K star in the range where previous observations have shown discrepancies with models (see, e.g., Torres, 2013). The measured radii of such stars are sometimes larger than predicted, and their temperatures cooler than expected, both presumably due to the effects of magnetic activity and/or spots (e.g., Chabrier et al., 2007; Morales et al., 2010). V2154 Cyg therefore presents an opportunity to determine accurate physical properties of the stars in a system with a mass ratio significantly different from unity, and to investigate any discrepancies with theory in connection with measures of stellar activity.
The layout of our paper is as follows. Our new spectroscopic observations are reported in Section 2, followed by a brief description in Section 3 of the Rodríguez et al. (2001) photometric measurements we incorporate into our analysis. The light curve fits are presented in Section 4, along with consistency checks to support the accuracy of the results. With the spectroscopic and photometric parameters we then derive the physical properties of the system, given in Section 5, and compare them with current models of stellar structure and stellar evolution (Section 6). We discuss the results in the context of available activity measurements in Section 7, and conclude with some final thoughts in Section 8.
2. Spectroscopic observations and analysis
V2154 Cyg was placed on our spectroscopic program in October of 2001, and observed through June of 2007 with two nearly identical echelle instruments (Digital Speedometer; Latham, 1992) on the 1.5 m telescope at the Oak Ridge Observatory in the town of Harvard (MA), and on the 1.5 m Tillinghast reflector at the Fred L. Whipple Observatory on Mount Hopkins (AZ). Both instruments (now decommissioned) used intensified photon-counting Reticon detectors providing spectral coverage in a single echelle order 45 Å wide centered on the Mg I b triplet at 5187 Å. The resolving power delivered by these spectrographs was , and the signal-to-noise ratios achieved for the 80 usable observations of V2154 Cyg range from about 20 to 67 per resolution element of 8.5 km s-1. Wavelength solutions were carried out by means of exposures of a thorium-argon lamp taken before and after each science exposure, and reductions were performed with a custom pipeline. Observations of the evening and morning twilight sky were used to place the observations from the two instruments on the same velocity system and to monitor instrumental drifts (Latham, 1992).
Visual inspection of one-dimensional cross-correlation functions for each of our spectra indicated the presence of a star much fainter than the primary that we initially assumed was the secondary in V2154 Cyg. However, subsequent analysis with the two-dimensional cross-correlation algorithm TODCOR (Zucker & Mazeh, 1994) showed those faint lines to be stationary, while a third set of even weaker lines was noticed that moved in phase with the orbital period. This is therefore the secondary in the eclipsing pair, and the stationary lines correspond to the visual companion mentioned in the Introduction, as we show later, which falls within the 1″ slit of the spectrograph. Consequently, for the final velocity measurements we used an extension of TODCOR to three dimensions (referred to here as TRICOR; Zucker et al., 1995) that uses three different templates, one for each star. In the following we refer to the binary components as stars 1 and 2, and to the tertiary as star 3. The templates were selected from a large library of synthetic spectra based on model atmospheres by R. L. Kurucz (see Nordström et al., 1994; Latham et al., 2002), computed for a range of temperatures (), surface gravities (), rotational broadenings (, when seen in projection), and metallicities ([m/H]).
We selected the optimum parameters for the templates as follows, adopting solar metallicity throughout. For the primary star we ran a grid of one-dimensional cross-correlations against synthetic spectra over a wide range of temperatures and values (see Torres et al., 2002), for a fixed of 4.0 that is sufficiently close to our final estimate presented later. The best match, as measured by the cross-correlation coefficient averaged over all exposures, was obtained for interpolated values of K and km s-1. The secondary and tertiary stars are faint enough (by factors of 25 and 9, respectively; see below) that they do not affect these results significantly. For the secondary the optimal from grids of TRICOR correlations was km s-1. However, due to its faintness we were unable to establish its temperature from the spectra themselves, so we relied on results from the light curve analysis described later in Section 4. The central surface brightness ratio provides an accurate measure of the temperature ratio between stars 1 and 2. Using the primary temperature from above, the value for the band, and the visual flux calibration by Popper (1980), we obtained K. The surface gravity was adopted as , appropriate for a main-sequence star of this temperature. For the tertiary we again adopted , and grids of correlations with TRICOR for a range of temperatures indicated a preference for a value of 5500 K, to which we assign a conservative uncertainty of 200 K. Similar correlation grids varying indicated no measurable line broadening for the tertiary, so we adopted kms, with an estimated upper limit of 2 km s-1.
Radial velocities were then measured with TRICOR using values for the template parameters (, ) in our library nearest to those given above: 6750 K and 25 km s-1 for the primary, 5000 K and 12 km s-1 for the secondary, and 5500 K and 0 km s-1 for the tertiary. The light ratios we determined from our spectra are and , corresponding to the mean wavelength of our observations (5187 Å).
| HJD | Orbital | ||||||
|---|---|---|---|---|---|---|---|
| (2,400,000) | (km s-1) | (km s-1) | (km s-1) | (km s-1) | (km s-1) | (km s-1) | phase |
| 51874.5314 | 36.96 | 1.11 | 20.74 | 9.28 | 17.32 | 1.85 | 0.4586 |
| 52109.6581 | 41.58 | 0.67 | 128.03 | 5.55 | 19.35 | 1.11 | 0.8387 |
| 52123.6422 | 79.58 | 0.65 | 85.40 | 5.42 | 19.62 | 1.08 | 0.1546 |
| 52130.5621 | 52.47 | 0.75 | 135.05 | 6.22 | 18.83 | 1.24 | 0.7851 |
| 52151.5379 | 53.69 | 0.69 | 143.48 | 5.73 | 19.73 | 1.14 | 0.7588 |
Note. — Orbital phases are computed from the reference time of primary eclipse given in Section 4. This table is available in its entirety in machine-readable form.
Because our spectra are only 45 Å wide, systematic errors in the velocities can result from lines shifting in and out of this window as a function of orbital phase (see Latham et al., 1996). To estimate this effect we followed a procedure similar to that of Torres et al. (1997) and created artificial triple-lined spectra based on our adopted templates, which we then processed with TRICOR in the same way as the real spectra. A comparison of the input and output velocities showed a phase-dependent pattern with maximum shifts of about 0.2 km s-1 for the primary, 6 km s-1 for the secondary, and 1.2 km s-1 for the tertiary. We applied these shifts as corrections to the individual raw velocities, and the final measurements including all corrections are listed in Table 1, along with their uncertainties. The velocities of the third star appear constant within their uncertainties, and have a mean of km s-1 (weighted average). A similar correction for systematic errors was applied to the light ratios, and is already included in the values reported above.
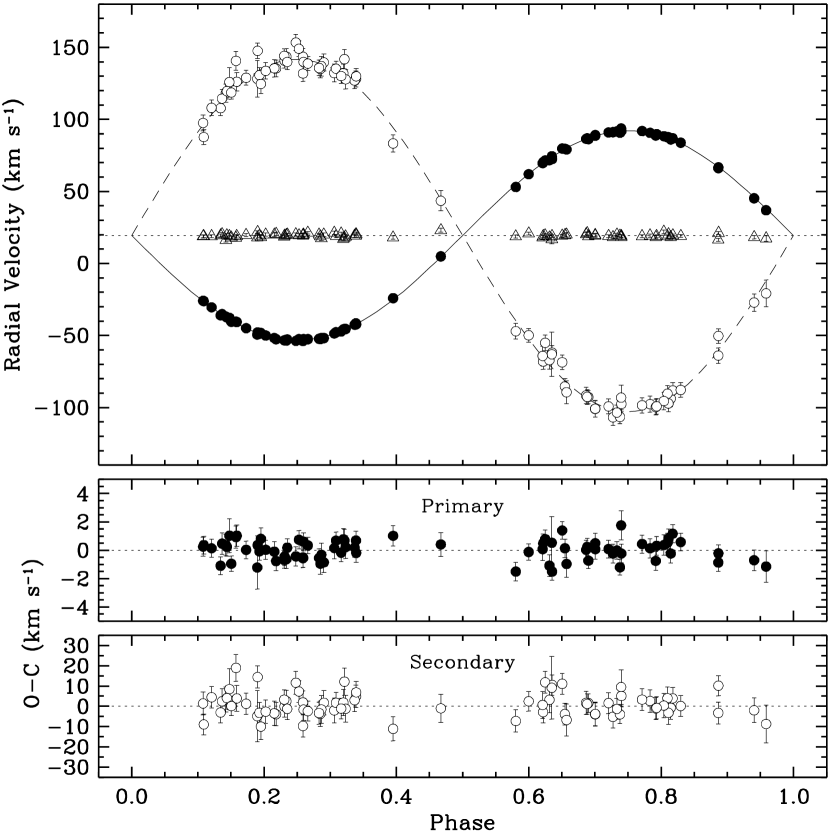
A weighted least-squares orbital fit to the primary and secondary velocities gives the elements and derived quantities presented in Table 2, where a circular orbit has been assumed. Tests allowing for eccentricity gave results consistent with zero, in agreement with similar experiments below based on the light curves. Initial solutions in which we included a possible systematic offset between the primary and secondary velocities, as may arise, e.g., from template mismatch, also gave a value consistent with zero. The observations and orbital fit are shown in Figure 1. The tertiary velocities, represented with triangles, are seen to be very close to the center-of-mass velocity, supporting the physical association.
| Parameter | Value |
|---|---|
| Orbital elements | |
| (days)aaTime of maximum primary velocity. | 2.6306359 0.0000039 |
| (HJD2,400,000)aaTime of maximum primary velocity. | 52973.58847 0.00091 |
| (km s-1) | +19.408 0.076 |
| (km s-1) | 72.699 0.092 |
| (km s-1) | 122.298 0.723 |
| 0.0 (fixed) | |
| Derived quantities | |
| ()bbBased on physical constants recommended by 2015 IAU Resolution B3 (Prša et al., 2016). | 1.268 0.017 |
| ()bbBased on physical constants recommended by 2015 IAU Resolution B3 (Prša et al., 2016). | 0.7535 0.0059 |
| 0.5944 0.0036 | |
| (106 km) | 2.6298 0.0033 |
| (106 km) | 4.424 0.026 |
| ()bbBased on physical constants recommended by 2015 IAU Resolution B3 (Prša et al., 2016). | 10.140 0.038 |
| Other quantities pertaining to the fit | |
| 80 | |
| Time span (days) | 2381.4 |
| Time span (cycles) | 905.3 |
| (km s-1) | 0.69 |
| (km s-1) | 5.74 |
| (km s-1) | 1.21 |
3. Photometric observations
The light curves used for our analysis are those published by Rodríguez et al. (2001)111We note, incidentally, that the heliocentric Julian dates in the online electronic files should be corrected by subtracting exactly 790 days., and were obtained between July and November of 1998 with the 0.9 m telescope at the Sierra Nevada Observatory (Spain). The 852 observations were made on 28 nights using filters, with HD 204626 (A0 III) as the comparison star and HD 204977 (B9 V) as the check star. The standard deviations of the difference in magnitude between the comparison and check stars, which may be taken as an indication of the precision of the observations, were 0.0085, 0.0035, 0.0032, and 0.0043 mag for , , , and , respectively.
4. Light curve analysis
For the analysis of the light curves of this well-detached system we have adopted the Nelson-Davis-Etzel model (Popper & Etzel, 1981; Etzel, 1981), as implemented in the JKTEBOP code222http://www.astro.keele.ac.uk/jkt/codes/jktebop.html (Southworth, 2013). The free parameters of the fit are the period and reference epoch of primary minimum , the central surface brightness ratio , the sum of the relative radii normalized to the semimajor axis, the radius ratio , the inclination angle , and a magnitude zero point . Because of the presence of the third star in the aperture we also included the third light parameter (fractional brightness of star 3 divided by the total light, at phase 0.25 from primary eclipse). The mass ratio was held fixed at the spectroscopic value (). Linear limb-darkening coefficients (, ) were interpolated from the tables by Claret (2000) using the JKTLD code333http://www.astro.keele.ac.uk/jkt/codes/jktld.html (Southworth, 2008), and gravity-darkening coefficients (, ) were taken from the tabulations by Claret & Bloemen (2011) for the properties of the primary and secondary given earlier. Experiments with quadratic limb-darkening gave no improvement, so the linear law was used throughout. Initial fits that included the eccentricity as an additional free parameter indicated a value that was not significantly different from zero, consistent with the spectroscopic evidence, so the orbit was assumed to be circular.
| Parameter | ||||
|---|---|---|---|---|
| (days) | 2.630607 (+14/19) | 2.6306290 (+61/75) | 2.6306305 (+56/59) | 2.6306316 (+74/81) |
| (HJD2,400,000) | 51048.61797 (+28/22) | 51048.61815 (+12/14) | 51048.61814 (+11/14) | 51048.61808 (+15/12) |
| 0.2169 (+26/17) | 0.2172 (+12/14) | 0.2167 (+13/15) | 0.2163 (+13/14) | |
| 0.492 (+17/14) | 0.486 (+18/9) | 0.492 (+15/14) | 0.473 (+24/4) | |
| (deg) | 88.76 (+32/79) | 88.39 (+61/33) | 88.57 (+43/48) | 87.79 (+82/6) |
| 0.120 (+11/9) | 0.1267 (+84/58) | 0.193 (+11/9) | 0.246 (+16/11) | |
| 0.087 (+35/59) | 0.054 (+51/29) | 0.093 (+34/47) | 0.028 (+87/1) | |
| (mag) | 0.33069 (+45/45) | 0.69957 (+40/32) | 0.44492 (+37/31) | 0.20558 (+44/29) |
| Derived quantities | ||||
| 0.1454 (+24/22) | 0.1462 (+13/23) | 0.1453 (+20/23) | 0.1469 (+11/31) | |
| 0.0715 (+16/12) | 0.0710 (+15/8) | 0.0714 (+12/13) | 0.0695 (+21/2) | |
| 0.0264 (+21/23) | 0.0280 (+22/10) | 0.0435 (+22/24) | 0.0513 (+60/5) | |
| (mmag) | 8.56 | 3.58 | 3.28 | 3.79 |
| Adopted limb-darkening and gravity-darkening coefficients (Claret, 2000; Claret & Bloemen, 2011) | ||||
| 0.722 | 0.748 | 0.696 | 0.615 | |
| 0.929 | 0.892 | 0.854 | 0.768 | |
| 0.393 | 0.354 | 0.305 | 0.260 | |
| 1.157 | 0.892 | 0.672 | 0.581 | |
Note. — Uncertainties from the residual permutation procedure are given in parentheses in units of the last significant place (upper and lower error bars).
Separate solutions for each of the bands are presented in Table 3. As the errors provided by JKTEBOP are strictly internal and do not capture systematic components that may result, e.g., from red noise, the uncertainties given in the table were computed with the residual permutation (“prayer bead”) method, as follows. We shifted the residuals from the original fits by an arbitrary number of time indices (with wraparound), and added them back into the computed curves to create artificial data sets that preserve any time-correlated noise that might be present in the original data. We generated 500 such data sets for each of the passbands and fitted them with JKTEBOP. In each solution we simultaneously perturbed all of the quantities that were initially held fixed. We did this by adding Gaussian noise to the mass ratio corresponding to its measured error (), and Gaussian noise with to the limb-darkening and gravity-darkening coefficients. The standard deviations of the resulting distributions for each parameter were adopted as the uncertainties for the light curve elements.
| Parameter | Value |
|---|---|
| 0.21696 0.00087 | |
| 0.4895 0.0083 | |
| (deg) | 88.55 0.28 |
| 0.1457 0.0010 | |
| 0.07129 0.00060 | |
| (days) | 2.6306303 0.0000038 |
| (HJD2,400,000) | 51048.618122 0.000075 |
for V2154 Cyg.
| 0.119 (+12/10) | 0.075 (+22/13) | 0.0259 (+19/16) | |
| 0.1272 (+86/82) | 0.069 (+22/22) | 0.02851 (+75/67) | |
| 0.193 (+11/11) | 0.086 (+22/21) | 0.04311 (+81/75) | |
| 0.250 (+12/14) | 0.101 (+21/17) | 0.0560 (+13/10) |
Note. — Uncertainties from the residual permutation procedure are given in parentheses in units of the last significant place (upper and lower error bars).
The results from the four passbands are fairly consistent within their uncertainties, with a few exceptions: (1) The ephemeris (, ) seems rather different for the band, which is the fit with the largest scatter. The fact that the measurements are simultaneous indicates this is almost certainly due to systematic errors affecting that are not uncommon. (2) The geometric parameters (most notably and , and to a lesser extent ) seem systematically different for the band. Several features of that fit make us suspicious of these quantities, and of as well. In particular, is significantly lower than in the other bands, which runs counter to expectations given that the third star is cooler (redder) than the primary, and so its flux contribution ought to be larger in , not smaller. Third light is always strongly (and positively) correlated with the inclination angle and with in this case, and indeed we see that both and are also low. Grids of JKTEBOP solutions over a range of fixed values of show that for all values the radius sum in the band is always considerably smaller than in the other three bands, which agree well among each other. Finally, we note that the -band error bars for , , and are all highly asymmetric (always much larger in the direction toward the average of the results), which is not the case in the other bands. These features are symptomatic of strong degeneracies in that make the results highly prone to biases. We have therefore chosen not to rely on the geometric parameters from the band.
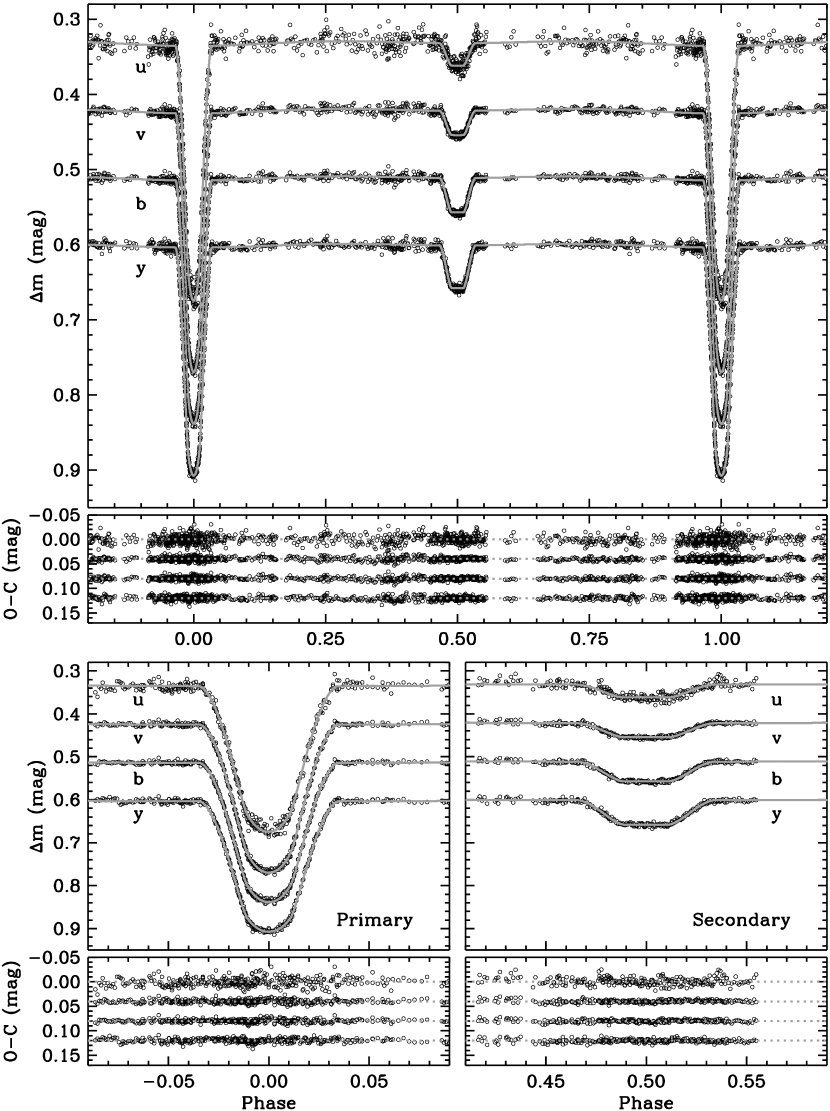
Weighted averages of the photometric period and epoch (excluding the band) and of the geometric parameters (excluding the band) are given in Table 4. The photometric period agrees well with the spectroscopic one, within the errors. The final solutions for the wavelength-dependent quantities were carried out by holding the ephemeris and geometry fixed to these values, and the results are collected in Table 5. We illustrate these final fits in Figure 2, where the secondary eclipse is seen to be total.
4.1. Consistency checks
The spectroscopic light ratios reported in Section 2 ( and ), which are independent of the light curve analysis above, offer an opportunity to test the accuracy of the light curve solutions. For the necessary flux transformation between the 5187 Å spectral window and the slightly redder Strömgren band (5470 Å) we used synthetic spectra from the PHOENIX library by Husser et al. (2013), along with our adopted effective temperatures and surface gravities from Section 2, integrating the model fluxes over both passbands. An additional quantity that is needed to properly scale the spectral energy distributions is the radius ratio.
As a sanity check we first used these spectra coupled with our measured radius ratio of to calculate the -band light ratio between the primary and secondary, and obtained , in good agreement with our light curve value. The flux ratio we then infer at 5187 Å based on the same parameters is 0.039, which is consistent with the spectroscopic measurement of (see Figure 3).
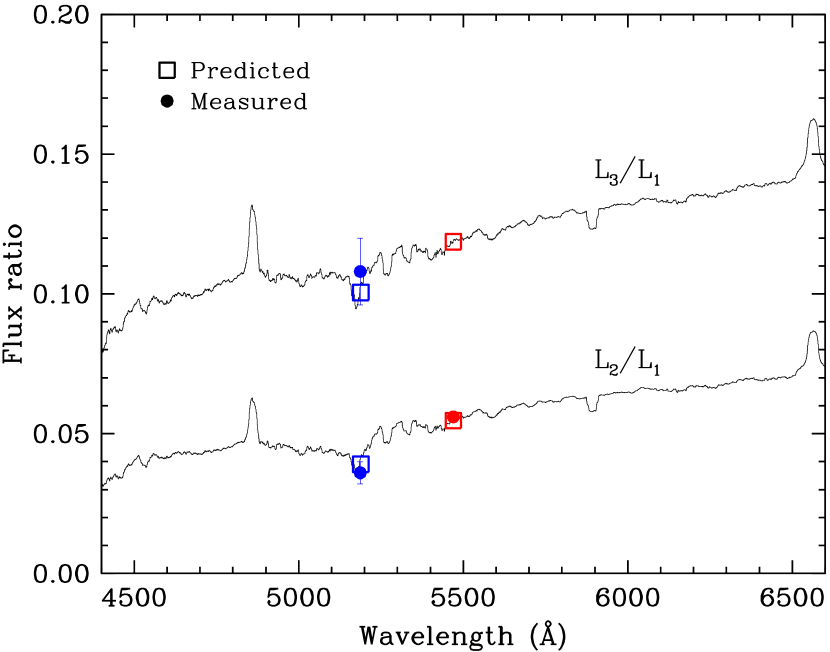
The scaling of the energy distributions of the tertiary and primary components requires knowledge of the radius ratio between those two stars, which our observations do not provide. We estimated it as follows. With our -band light curve results from Table 5 ( and ) we calculated . We then used the PHOENIX synthetic spectra and varied the radius ratio until we reproduced this value of , which occurred for . With the scaling set in this way, the predicted flux ratio at 5187 Å between the tertiary and primary is 0.100, which again agrees with the spectroscopically measured ratio of , as illustrated in Figure 3.
These consistency checks between the spectroscopy and the photometry are an indication that the light curve fits are largely free from biases, and support the accuracy of the geometric elements used in the next section to derive the physical properties of the stars.
5. Absolute dimensions
The absolute masses and radii of V2154 Cyg are listed in Table 6. The relative uncertainties are smaller than 1.5% for both components. The combined out-of-eclipse magnitudes of the system from Rodríguez et al. (2001) and our fitted light ratios and third-light values enable us to deconvolve the light of the components. For the primary star we obtained the Strömgren indices , , and , along with . With these and the calibrations of Crawford (1975) we infer negligible reddening for the system (consistent with its small distance; see below), and an estimated photometric metallicity of . Photometric estimates of the temperatures may be obtained from the index of the primary and the corresponding value for the secondary of . The color/temperature calibration of Casagrande et al. (2010) leads to values of K and K that are in good agreement with the spectroscopic values adopted in Section 2. The deconvolved color of the third star () is too uncertain to be useful, though the inferred temperature of K again matches the value from Section 2. The spectral types corresponding to the adopted temperatures are F2, K2, and G8 for the primary, secondary, and tertiary, respectively.
Additional quantities listed in Table 6 include the luminosities, absolute magnitudes, and the distance ( pc), which makes use of the bolometric corrections by (Flower, 1996). The corresponding parallax, mas, is not far from the trigonometric values listed in the Hipparcos catalog ( mas) and in the first data release of Gaia ( mas; Gaia Collaboration et al., 2016). Our measured projected rotational velocities are also quite close to the expected synchronous values ().
As noted earlier, the third star was angularly resolved by the Tycho-2 experiment at a separation of 047 and a measured position angle of 59°, at the mean epoch 1991.25. Subsequent astrometric measurements by a number of authors indicate a gradual decrease in the angular separation to 025 in 2010 (Horch et al., 2010), with no significant change in the position angle. This is inconsistent with being the result of a chance alignment with a background star, as the binary’s fairly large proper motion of 113 mas yr-1 measured by Gaia would have carried the companion 2″ away in that interval. The direction of motion would suggest a high inclined orbit, or possibly even an edge-on orientation. At our measured 90 pc distance the 047 separation implies a semimajor axis of roughly 42 au and an orbital period of 160 yr.
| Parameter | Primary | Secondary |
|---|---|---|
| Mass () | ||
| Radius () | ||
| (cgs) | ||
| Temperature (K) | ||
| (mag)aaBolometric corrections from Flower (1996), with a contribution of 0.10 mag added in quadrature to the uncertainty from the temperatures. | ||
| (mag)bbUses for consistency with the adopted table of bolometric corrections (see Torres, 2010). | ||
| (mag) | ||
| (mag) | ||
| Distance (pc)ccRelies on the luminosities, the apparent magnitude of V2154 Cyg out of eclipse (; Rodríguez et al., 2001), and bolometric corrections. | ||
| Parallax (mas)ccRelies on the luminosities, the apparent magnitude of V2154 Cyg out of eclipse (; Rodríguez et al., 2001), and bolometric corrections. | ||
| (km s-1) | ||
| (km s-1)ddMeasured value. | ||
6. Comparison with stellar evolution models
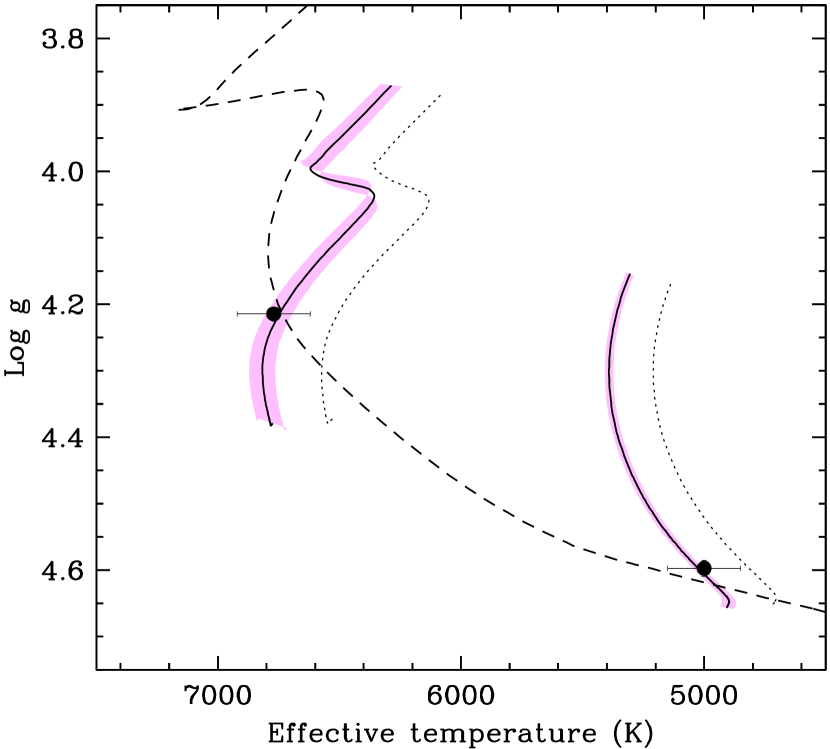
The accurate properties for V2154 Cyg are compared with predictions from current stellar evolution theory in Figure 4. The evolutionary tracks for the measured masses of the components were taken from the grid of MESA Isochrones and Stellar Tracks (MIST; Choi et al., 2016), which is based on the Modules for Experiments in Stellar Astrophysics package (MESA; Paxton et al., 2011, 2013, 2015). The metallicity in the models was adjusted to to provide the best fit to the temperatures of the stars. This composition is not far from the photometric estimate reported earlier. The shaded areas in the figure indicate the uncertainty in the location of the tracks that comes from the errors in the measured masses. Solar-metallicity tracks are shown with dotted lines for reference. The age that best matches the radius of the primary is 2.2 Gyr (see below). An isochrone for this age is shown with a dashed line. The primary star is seen to be almost halfway through its main-sequence phase.
At this relatively old age it is not surprising that we found the components’ rotation to be synchronized with the motion in a circular orbit, as the theoretically expected timescales for synchronization and orbit circularization are 1 Myr and 200 Myr, respectively (e.g., Hilditch, 2001).
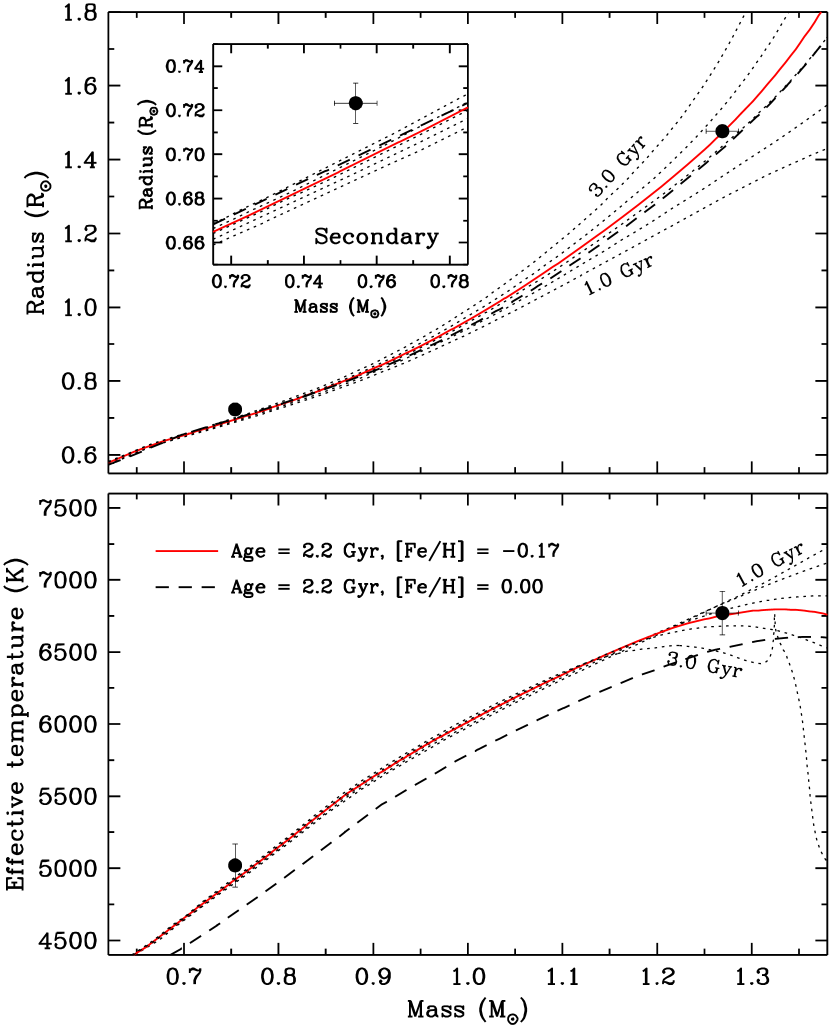
The radii and temperatures are shown separately as a function of mass in Figure 5, in which the solid line represents the 2.2 Gyr isochrone for that reproduces the measured radius of the primary star at its measured mass. A solar metallicity isochrone for the same age is shown with the dashed line. The secondary star is seen to be larger than predicted for its mass by almost 4%, corresponding to a nearly 3 discrepancy. Similar deviations from theory are known to be present in other stars with convective envelopes, and are usually attributed to the effects of stellar activity (see, e.g. Popper, 1997; Torres, 2013). The bottom panel of the figure shows that the temperatures of the two components are consistent with the theoretical values for their mass within the errors. This is somewhat unexpected for the secondary, as stellar activity typically causes both “radius inflation” and “temperature suppression”, though the latter effect is smaller and not as easy to detect.
Aside from the brightness measurements and our spectroscopic estimates of and from Section 2, we have no direct information on the other fundamental physical properties of the tertiary. Based on our spectroscopically measured flux ratio of at 5187 Å and the above best-fit MIST isochrone, we infer , , and K. The temperature is consistent with that estimated directly from our spectra, and the radius ratio is not far from the value we found in a different way at the end of Section 4.
7. Discussion
The 4% discrepancy between the measured and predicted radius for the K2 secondary in V2154 Cyg is in line with similar anomalies displayed by other late-type stars having significant levels of activity. While we do not detect any temperature suppression that often accompanies radius inflation, the fractional effect in seen in other cases is typically half that of radius inflation, or only about 100 K in this case, which is smaller than our formal uncertainty.
V2154 Cyg is an X-ray source listed in the ROSAT All-Sky Survey (Voges et al., 1999), and is also reported to have shown at least one X-ray flare during those observations (Fuhrmeister & Schmitt, 2003). This is a clear indication of magnetic activity in the system, though in principle the source could be any of the three stars, or even all three. From the ROSAT count rate of counts s-1 and the measured hardness ratio () we infer an X-ray flux of erg cm-2 s-1, adopting the energy conversion factor recommended by Fleming et al. (1995). Using our distance estimate of 90 pc we then derive an X-ray luminosity of erg s-1.
While fairly common in late-type objects (particularly if rotating rapidly), X-ray emission in stars much earlier than mid-F is generally not easy to explain because they lack sufficiently deep surface convective zones that are typically associated with magnetic activity generated by the dynamo effect. For this reason, X-rays in these stars are most often attributed to an unseen late-type companion (e.g., Schröder & Schmitt, 2007, and references therein), which can easily be hidden in the glare of the primary. Other mechanisms intrinsic to earlier-type stars are possible, such as shocks and instabilities in the radiatively driven winds, although these are not thought to be able to explain variability such as the X-ray flaring mentioned above (see, e.g. Schmitt, 2004; Balona, 2012). We cannot completely rule out a priori that the primary in V2154 Cyg is the main source of the X-rays, but its much thinner convective envelope makes this seem far less likely than an origin in a later-type star such as the secondary or tertiary. Indeed, the MIST models indicate that the mass of the convective envelope of the secondary is about 7.2% of its total mass, and that of the tertiary is 4.5% (the value for the Sun is 1.6%), whereas the fractional mass of the primary’s envelope is only .
The tertiary component in V2154 Cyg is a possible source for the X-rays, if it were a rapidly rotating star. However, our spectroscopy suggests it is not a fast rotator: we measure km s-1 (Section 2), although the projection factor is unknown so it is concievable the equatorial rotation is much faster. To estimate the true rotation period we used the age of the system (2.2 Gyr) along with the gyrochronology relations of Epstein & Pinsonneault (2014) and the estimated color of the star from the MIST isochrones, and inferred days. If attributed entirely to the tertiary, the measured X-ray luminosity of V2154 Cyg would be far in excess (by about an order of magnitude) of what is expected for a star of this mass and rotation period, according to studies of the relationship between stellar activity and rotation (e.g., Pizzolato et al., 2003). This argues the X-rays are unlikely to originate mainly in the tertiary, although it is possible it has some small contribution.
We are thus left with the secondary as the most probable site of the bulk of the X-ray emission in V2154 Cyg. With the bolometric luminosity given in Table 6 we compute , a value that is close to the saturation level seen in very active stars. The study of Pizzolato et al. (2003) indicates that this is in fact a typical value for a star of this mass with a rotation period of 2.63 days, supporting our conclusion that the secondary is the active star in the system. If that is the case, this provides a natural explanation for its inflated radius.
Recent stellar evolution models that incorporate the effects of magnetic fields have had some success in explaining radius inflation in stars like the secondary (see, e.g., Feiden & Chaboyer, 2012, 2013). To achieve this, those models introduce a tunable parameter that is the average strength of the surface magnetic field, , where is the photospheric magnetic field strength and the filling factor. Measurements of magnetic field strengths are very difficult to make in binary systems, let alone in triple-lined systems such as V2154 Cyg, but they are essential in order to validate the fits that these models provide.
A rough estimate of for the secondary may be obtained by taking advantage of a power-law relationship shown by Saar (2001) to exist between and the Rossby number, , where is the convective turnover time. For consistency with the work of Saar (2001), we take from the theoretical calculations by Gilliland (1986), which give days for a star with a temperature of 5020 K. The resulting Rossby number, , together with the relation by Saar (2001) then yields kG.444The same calculation applied to the tertiary star gives G, which is small compared to the secondary and supports the notion that it is not a very active star. The parameters for the primary star are outside of the range of validity of the Saar (2001) relation, but point to a magnetic field strength of only a few Gauss, again suggesting a very low activity level if the sustaining mechanism is the same as in late-type stars. An independent way of estimating the magnetic field strength makes use of the X-ray luminosity and the empirical relationship between that quantity and the total unsigned surface magnetic flux, . Pevtsov et al. (2003) have shown in a study of magnetic field observations of the Sun and active stars that the relation holds over many orders of magnitude. With an updated version of that relation by Feiden & Chaboyer (2013), and the measured radius of the secondary, we obtain kG, which is similar to our previous result. A magnetic field strength of this order is quite consistent with values measured in many other cool, active single stars (see, e.g., Cranmer & Saar, 2011; Reiners, 2012).
Our estimate of kG can serve as an input to stellar evolution calculations that model the effects of magnetic fields, and test their ability to match the measured size of the secondary.
V2154 Cyg is attended by a distant third star that is physically bound: we have shown that it has a similar radial velocity as the eclipsing pair, a brightness perfectly consistent with that expected for a star of its temperature at the same distance as the binary, and a motion on the plane of the sky that is incompatible with a background object but consistent with orbital motion in a highly inclined orbit around the binary (possibly even coplanar with it). The system is thus a hierarchical triple, which is not surprising given that (Tokovinin et al., 2006) have shown that up to 96% of all solar-type binaries with periods shorter than 3 days have third components.
8. Conclusions
Our spectroscopic observations together with existing photometry have enabled us to derive accurate absolute masses and radii for the eclipsing components good to better than 1.5%, despite the faintness of the secondary (only 3.6% of the brightness of the primary). V2154 Cyg thus joins the ranks of binary systems with the best determined properties (see Torres et al., 2010). The highly unequal masses provide increased leverage for the comparison with stellar evolution models, and we find that the K2 secondary is about 4% larger than predicted for its mass, though its temperature appears normal. Thus, the star appears overluminous. The detection of the system as an X-ray source is evidence of activity, and we have argued that the source is the secondary component. This would provide at least a qualitative explanation for the radius anomaly, which is also seen in many other active stars with convective envelopes. We would expect the secondary to have significant spot coverage, but the star is much too faint compared to the primary for this to produce a visible effect on the light curves.
V2154 Cyg is a good test case for recent stellar evolution models that attempt to explain radius inflation in a more quantitative way by including the effects of magnetic fields. To this end, we have provided an estimate of the strength of the surface magnetic field on the secondary (1 kG).
Finally, we note that the study of this system would benefit from a detailed chemical analysis of the primary star based on high-resolution spectroscopy with broader wavelength coverage than the 45 Å afforded by the material at our disposal. This would remove the metallicity as a free parameter in the comparison with stellar evolution models, strengthening the results.
Note added in proof: A high-resolution () echelle spectrum of V2154 Cyg with a signal-to-noise ratio of 220 in the Mg I b region was obtained recently at the Tillinghast reflector during the second quadrature (HJD 2,458,029.6, phase 0.73). It shows no sign of activity (e.g., Ca II H and K or H emission) in the brighter primary, supporting our contention that this star is not particularly active.
References
- Balona (2012) Balona, L. A. 2012, MNRAS, 423, 3420
- Casagrande et al. (2010) Casagrande, L., Ramírez, I., Meléndez, J., Bessell, M., & Asplund, M. 2010, A&A, 512, A54
- Chabrier et al. (2007) Chabrier, G., Gallardo, J., & Baraffe, I. 2007, A&A, 472, L17
- Choi et al. (2016) Choi, J., Dotter, A., Conroy, C., et al. 2016, ApJ, 823, 102
- Claret (2000) Claret, A. 2000, A&A, 363, 1081
- Claret & Bloemen (2011) Claret, A., & Bloemen, S. 2011, A&A, 529, A75
- Cranmer & Saar (2011) Cranmer, S. R., & Saar, S. H. 2011, ApJ, 741, 54
- Crawford (1975) Crawford, D. L. 1975, AJ, 80, 955
- Epstein & Pinsonneault (2014) Epstein, C. R., & Pinsonneault, M. H. 2014, ApJ, 780, 159
- Etzel (1980) Etzel, P. B. 1980, EBOP User’s Guide, 3rd. Ed., Dept. of Astron. Univ. California, Los Angeles
- Etzel (1981) Etzel, P. B. 1981, Photometric and Spectroscopic Binary Systems, Proc. NATO Adv. Study Inst., ed. E. B. Carling & Z. Kopal (Dordrecht: Reidel), p. 111
- Fabricius et al. (2002) Fabricius, C., Høg, E., Makarov, V. V., et al. 2002, A&A, 384, 180
- Fabricius & Makarov (2000) Fabricius, C., & Makarov, V. V. 2000, A&A, 356, 141
- Feiden & Chaboyer (2012) Feiden, G. A., & Chaboyer, B. 2012, ApJ, 761, 30
- Feiden & Chaboyer (2013) Feiden, G. A., & Chaboyer, B. 2013, ApJ, 779, 183
- Fleming et al. (1995) Fleming, T. A., Molendi, S., Maccacaro, T., & Wolter, A. 1995, ApJS, 99, 701
- Flower (1996) Flower, P. J. 1996, ApJ, 469, 355
- Fuhrmeister & Schmitt (2003) Fuhrmeister, B., & Schmitt, J. H. M. M. 2003, A&A, 403, 247
- Gaia Collaboration et al. (2016) Gaia Collaboration, Brown, A. G. A., Vallenari, A., et al. 2016, A&A, 595, A2
- Gilliland (1986) Gilliland, R. L. 1986, ApJ, 300, 339
- Hilditch (2001) Hilditch, R. W. 2001, An Introduction to Close Binary Stars (Cambridge, UK: CUP), p. 153
- Horch et al. (2010) Horch, E. P., Falta, D., Anderson, L. M., et al. 2010, AJ, 139, 205
- Husser et al. (2013) Husser, T.-O., Wende-von Berg, S., Dreizler, S., et al. 2013, A&A, 553, A6
- Kurpinska-Winiarska & Oblak (2000) Kurpinska-Winiarska, M., & Oblak, E. 2000, The Formation of Binary Stars, IAU Symposium No. 200, ed. B. Reipurth and H. Zinnecker (Potsdam, Germany: AIP), 141
- Latham (1992) Latham, D. W. 1992, Complementary Approaches to Double and Multiple Star Research, IAU Coll. 135, ASP Conf. Ser. 32, ed. H. A. McAlister & W. I. Hartkopf (San Francisco, CA: ASP), 110
- Latham et al. (1996) Latham, D. W., Nordström, B., Andersen, J., Torres, G., Stefanik, R. P., Thaller, M., & Bester, M. 1996, A&A, 314, 864
- Latham et al. (2002) Latham, D. W., Stefanik, R. P., Torres, G., Davis, R. J., Mazeh, T., Carney, B. W., Laird, J. B., & Morse, J. A. 2002, AJ, 124, 1144
- Martin (2003) Martin, S. 2003, Interplay of Periodic, Cyclic and Stochastic Variability in Selected Areas of the H-R Diagram, ASP Conf. Ser., Vol. 292, ed. C. Sterkan (San Francisco, CA: ASP), 59
- Morales et al. (2010) Morales, J. C., Gallardo, J., Ribas, I., et al. 2010, ApJ, 718, 502
- Nordström et al. (1994) Nordström, B., Latham, D. W., Morse, J. A. et al. 1994, A&A, 287, 338
- Oblak et al. (2004) Oblak, E., Lastennet, E., Fernandes, J., Kurpinska-Winiarska, M., & Valls-Gabaud, D. 2004, Spectroscopically and Spatially Resolving the Components of the Close Binary Stars, ASP Conf. Ser., 318, ed. R. W. Hilditch, H. Hensberge and K. Pavlovski (San Francisco, CA: ASP), 175
- Paxton et al. (2011) Paxton, B., Bildsten, L., Dotter, A., et al. 2011, ApJS, 192, 3
- Paxton et al. (2013) Paxton, B., Cantiello, M., Arras, P., et al. 2013, ApJS, 208, 4
- Paxton et al. (2015) Paxton, B., Marchant, P., Schwab, J., et al. 2015, ApJS, 220, 15
- Perryman (1997) Perryman, M. A. C., & ESA 1997, The Hipparcos and Tycho Catalogs (ESA SP-1200; Noordwijk: ESA)
- Pevtsov et al. (2003) Pevtsov, A. A., Fisher, G. H., Acton, L. W., et al. 2003, ApJ, 598, 1387
- Pizzolato et al. (2003) Pizzolato, N., Maggio, A., Micela, G., Sciortino, S., & Ventura, P. 2003, A&A, 397, 147
- Popper (1980) Popper, D. M. 1980, ARA&A, 18, 115
- Popper (1997) Popper, D. M. 1997, AJ, 114, 1195
- Popper & Etzel (1981) Popper, D. M., & Etzel, P. B. 1981, AJ, 86, 102
- Prša et al. (2016) Prša, A., Harmanec, P., Torres, G., et al. 2016, AJ, 152, 41
- Reiners (2012) Reiners, A. 2012, Living Reviews in Solar Physics, 9, 1
- Rodríguez et al. (2001) Rodríguez, E., García, J. M., Martín, S., & Claret, A. 2001, A&A, 372, 588
- Saar (2001) Saar, S. H. 2001, 11th Cambridge Workshop on Cool Stars, Stellar Systems and the Sun, ASP Conf. Ser. 223, ed. R. J. García López, R. Rebolo, & M. R. Zapatero Osorio (San Francisco, CA: ASP), 292
- Schmitt (2004) Schmitt, J. H. M. M. 2004, Stars as Suns: Activity, Evolution and Planets, IAU Symp. 219, ed. A. K. Dupree and A. O. Benz (San Francisco, CA: ASP), 187
- Schröder & Schmitt (2007) Schröder, C., & Schmitt, J. H. M. M. 2007, A&A, 475, 677
- Southworth (2008) Southworth, J. 2008, MNRAS, 386, 1644
- Southworth (2013) Southworth, J. 2013, A&A, 557, A119
- Tokovinin et al. (2006) Tokovinin, A., Thomas, S., Sterzik, M., & Udry, S. 2006, A&A, 450, 681
- Torres (2010) Torres, G. 2010, AJ, 140, 1158
- Torres (2013) Torres, G. 2013, Astronomische Nachrichten, 334, 4
- Torres et al. (2010) Torres, G., Andersen, J., & Giménez, A. 2010, A&A Rev., 18, 67
- Torres et al. (1997) Torres, G., Stefanik, R. P., Andersen, J., et al. 1997, AJ, 114, 2764
- Torres et al. (2002) Torres, G., Neuhäuser, R., & Guenther, E. W. 2002, AJ, 123, 1701
- Voges et al. (1999) Voges, W., Aschenbach, B., Boller, T., et al. 1999, A&A, 349, 389
- Zucker & Mazeh (1994) Zucker, S., & Mazeh, T. 1994, ApJ, 420, 806
- Zucker et al. (1995) Zucker, S., Torres, G., & Mazeh, T. 1995, ApJ, 452, 863