GIGAS: a set of microwave sensor arrays to detect molecular bremsstrahlung radiation from extensive air shower
Abstract
We present the GIGAS (Gigahertz Identification of Giant Air Shower) microwave radio sensor arrays of the EASIER project (Extensive Air Shower Identification with Electron Radiometers), deployed at the site of the Pierre Auger cosmic ray observatory. The aim of these novel arrays is to probe the intensity of the molecular bremsstrahlung radiation expected from the development of the extensive air showers produced by the interaction of ultra high energy cosmic rays in the atmosphere. In the designed setup, the sensors are embedded within the surface detector array of the Pierre Auger observatory allowing us to use the particle signals at ground level to trigger the radio system. A series of seven, then 61 sensors have been deployed in the C-band, followed by a new series of 14 higher sensitivity ones in the C-band and the L-band. The design, the operation, the calibration and the sensitivity to extensive air showers of these arrays are described in this paper.
keywords:
high energy cosmic rays , microwave , radio , molecular bremsstrahlung1 Introduction
The very low flux of Ultra High Energy Cosmic Rays (UHECRs), less than
one particle per year per square kilometers above 1019 eV,
requires a very large detection surface at ground level to measure the
primary particle properties via the Extensive Air Showers (EAS) they
produce in the atmosphere. Such an indirect measurement is a very
difficult technical challenge and the search for efficient but low
cost techniques is an ongoing process.
As of today, the largest cosmic ray observatories, the Pierre Auger
Observatory [1] and Telescope Array [2],
combine two techniques to measure EAS: an array of particle detectors
at ground supplemented by a network of fluorescence telescopes
overlooking the atmosphere above the ground array. The particle
detectors, scintillators or water Cherenkov detectors, sample the
lateral profile of the cascades that reach the ground, while the
telescopes measure the longitudinal profile of the cascades by
detecting the fluorescence light emitted isotropically by the nitrogen
atoms previously excited by the passage of the electromagnetic
component of the EAS. While extremely powerful, the combination of
these two techniques suffers from the limited duty cycle, less than
15%, of the fluorescence technique, which can only be active during
clear moonless nights. With such a limited duty cycle, the mass
composition information, best determined by the depth of the maximum
of the longitudinal profiles, is essentially unavailable for UHECRs
with energies above eV. As such, the question
of the origin and nature of UHECR in this energy range, where a strong
flux suppression has been measured in the energy spectrum, remains
unsolved. Indeed, the interpretation of this cut-off is still being
debated [3].
One of the main motivation for using the radio emission of EAS to
measure UHECR properties relies on its capabilities to provide similar
information as the fluorescence technique but without the duty cycle
limitation. Initially proposed and implemented in the
1960’s [4], the radio detection of EAS is now a
well-established technique and has been mostly exploited in the VHF
band [5, 6, 7] and [8] for a
recent review. In this frequency range, the observed radiation is
mainly produced by the acceleration of the electrons of the shower in
the geomagnetic field, and, to a smaller extent, by the moving charge
excess (also know as Askaryan radiation) [9]. However,
both of these radiations are beamed forward in the Cherenkov cone,
which is around in air, and centered around the
shower axis. The resulting imprint of the radio signal at ground
level is generally observable only up to a few hundred meters,
limiting this technique to densely-instrumented arrays. Although such
densely-instrumented arrays can be deployed over surfaces that provide
good sensitivity to study cosmic rays with primary energies of about
or less, the cost is then a limiting factor to
envisage the deployment of antennas over the surfaces needed to probe
the flux at the highest energies. In addition, the collimated
emission of the radiation limits the ability to measure the
longitudinal development of the showers as one only detects the ground
projection of this profile around the shower axis.
In 2008, an accelerator experiment, SLAC T471, detected a signal in
the microwave frequency range (1.5-6 GHz) upon the passage of an
electromagnetic shower in an anechoic chamber [10]. This
signal was interpreted as Molecular Bremsstrahlung Radiation (MBR),
and its intensity, extrapolated to UHECR energies, was then expected
to be detectable with rather simple radio-detector systems. The MBR
is produced by the acceleration of the ionization electrons in the
electric field of the atmosphere molecules. The radiation is in
principle isotropic and its intensity directly related to the energy
deposited by the EAS particles in the atmosphere. MBR profiles would
therefore be very similar to fluorescence ones, with the advantage
that MBR detection in the microwave band, where the atmosphere is
essentially transparent, can be done with a 100% duty cycle. Such a
promising signal, together with the fact that sensors in that band are
very cheap due to their commercial use for satellite TV reception, led
to the development of additional accelerator experiments to better
characterize the signal [11], [12]. In addition, several
in situ experiments aiming at the direct observation of the MBR
emission from EAS like MIDAS [13], CROME [14],
AMBER [15] and EASIER were also set up.
The combined measurements of the EAS longitudinal profile in the
atmosphere and of the particle contents at ground allow the
reconstruction of the shower key parameters and thus a better
understanding of the mass of UHECRs. For a large enough MBR signal,
the EASIER setup, which is presented in this paper, was designed to
allow an access to several composition indicators such as the shower
depth of maximum and the muonic-to-electromagnetic ratio on an event
by event basis. This information would help to understand whether the
suppression observed in the energy spectrum is the result of the
extinction of the sources (i.e. the acceleration mechanisms has
reached its maximum potential) or the result of a propagation effect,
due to the interaction of UHECRs with the cosmic microwave background
of radiation (the Greisen, Zatsepin and Kuzmin (GZK)
cut-off [16, 17]).
In this paper, we present the developments of the EASIER project, a concept of radio detectors integrated to the Surface Detector (SD) of the Pierre Auger Observatory. An EASIER detector is a radio antenna combined with an envelope detector integrated to an SD station. EASIER thus take advantage of the power supply and data acquisition but takes most of its benefits from the station trigger. Radio Frequency Interference (RFI) and especially the anthropogenic noises are by this mean filtered out. Thus, this setup has the capability to probe the radio signal from UHECRs at large distances from the shower axis. In section 2, the general concept of EASIER is first presented prior the description of the three different versions of microwave sensor arrays installed in the GHz frequencies: GIGAS61, GIGADuck-C and GIGADuck-L. The full calibration of these detectors is then detailed in section 3. Finally the method to simulate the MBR is described and combined to the calibration information to produce estimations of the systems sensitivity in section 4.
2 The EASIER detection setup, GIGAS61 and GIGADuck detectors
EASIER is a novel radio-detector concept composed of a radio sensor and of an envelope detection electronics embedded in the SD of the Pierre Auger Observatory. This concept was implemented in three bandwidths: the VHF band (30-80 MHz), the L band (1-1.5 GHz) and the C-band (3.4-4.2 GHz). We focus in this article on the L- and C-band only. The EASIER experiment is one of the three experiments deployed at the Pierre Auger Observatory to search for the MBR emitted by the ionization electrons left in the atmosphere after the passage of the shower. In contrast to the two other ones, namely AMBER [15] and MIDAS [13], which instrument an array of feed horn antennas illuminated by a parabolic dish, EASIER relies on the observation of the shower from the ground level with a wide angle antenna pointing directly to the sky. In 2011, a first set of 7 antennas was deployed, followed by 54 additional in 2012 making the GIGAS61 array. The analysis of GIGAS61 data has revealed the observation of radio signals emitted by EAS in the C-band[15]. However, such detection occurred only for air showers at distances less than around 200 m from the GIGAS61 antenna and could be also explained by other emission processes than the MBR. Furthermore, new estimations of the expected MBR intensity [18, 19] led to the development of two new versions of EASIER, called GIGADuck-C (installed in March 2015) and GIGADuck-L (installed in December 2016), with an enhanced sensitivity to search for signal from larger distances hence fainter.
2.1 The electromagnetic background at the Pierre Auger Observatory
Radio measurement are often hindered by man-made noise. Prior to the
installation, the electromagnetic background was measured on the site
of the Pierre Auger Observatory located in the Pampa Amarilla in the
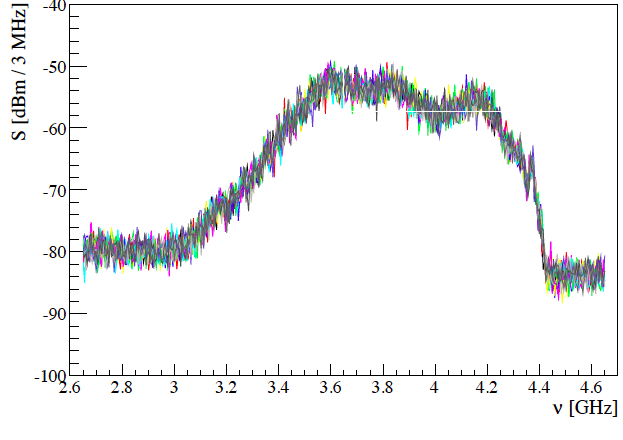
province of Mendoza in Argentina. Figure 1 shows
the power spectrum between 2.6 and 4.6 GHz measured with a
C-band LNBf (Low Noise Block feed). The gain of the amplifier used is
roughly 60 dB between 3.4 and 4.2 GHz. With a recorded
power in the sensitive bandwidth of -55 dBm / 3MHz the
noise floor is thus about -180 dBm/Hz. No strong peak is
observed above this level in the tens of recorded spectra making this
band adequate for our experiment.
In the L-band (see
Figure 1 (right)), peaks can be noticed, in
particular around 900 MHz where a strong intermittent peak
could be observed. It originates from the Auger SD communication
system and the mobile phone band and can be reduced with an
appropriate filtering. Other peaks are also present inside the
frequency band of interest between 1 and 1.4 GHz but their
amplitude remains acceptable.

2.2 The experimental setup
The EASIER detector is embedded in a sub-array of the surface detector
(SD) of the Pierre Auger Observatory. The SD is composed of 1660 water
Cherenkov detectors (WCD) arranged in a triangular grid of 1500 m
spacing. Each WCD is equipped with three Photo Multiplier Tubes (PMT),
a local acquisition and a communication system,
see [1] for a detailed description. An EASIER
detector unit is designed to be integrated into a WCD. It is composed
radio sensor installed on top of the SD station and an electronics box
located below the hatch box on top of the SD electronics(see
Fig. 3). The three setups described in this paper
share common elements presented rightafter, their specificities are
addressed in the following paragraphs.
The sensor is an antenna with
a main lobe of 30 to 45∘ depending on the considered setup.
Since the expected radiation is unpolarized, there is no requirement
on the polarization type of the antenna. The sensor is followed by an
amplification and a filtering stage. The radio frequency signal is
then transformed into a power envelope by a logarithmic amplifier
(Analog Device AD8318) which delivers a voltage proportional to the
logarithm of the RF input power. This model was chosen for its large
frequency bandwidth and its fast time response of a few tens
of ns. The output voltage is in turn adapted to the front end of
the WCD electronics which is originally built to accept PMT’s negative
voltage between 0 and -2V (see Fig. 2). The
adaptation is performed through an amplification that sets the dynamic
range to 20 dB and an offset used to adjust the baseline
level. The EASIER analogic signal replaces one of the six channels of
the WCD front end electronics. The final part of the acquisition
includes an antialiasing filter cutting frequencies above
20 MHz and the FADC (Flash Analog to Digital Convertor)
digitizer. The recorded waveform is 19.2 s long acquired
with a 40 MS/s rate and has an amplitude sampled over 1024 ADC
units (refereed as ADCu in the following) [1]. The
data stream is then sent to the central acquisition and the
reconstruction of the EAS event is performed independently of the
radio signals. As a consequence, no separate trigger for the radio
signal is needed and the EASIER data are simply part of the regular SD
data stream. As an additional benefit, the radio detector is powered
by the station battery and is also integrated into the SD station
monitoring system.


GIGAS61
The GIGAS61 antenna is a commercial horn antenna
(Fig. 3) made of a cylindrical feed and a quarter
wave length monopole at its bottom. The metallic ring around the feed
reduces the backlobe and widens the main lobe. A hemispherical radome
is glued to the ring to protect the antenna from rain. The antenna
has a gain of around 9 dB. It points to the Zenith and has a
half-power beamwidth (HPBW) of . It is tuned at a central
frequency of 3.8 GHz and a bandwidth of approximately 500 MHz.
It is associated with a low noise block (LNB) which amplifies the
signal by approximately 60 dB and lowers down the central
frequency to 1.35 GHz. The antenna and the LNB will be
referred to LNBf hereafter. A bias tee is inserted after the LNBf to
both distribute the power supply to the LNB and transmit the RF signal
on a 75 line. The line impedance is adapted to
50 by a resistor bridge. The low-frequency part of
the spectrum is filtered out by a 900 MHz high-pass filter.
The adaptation electronics of GIGAS61 is made partly with commercially
available device. The power detector used, the Minicircuit ZX47-50 is
the encapsulated version of the Analog Device AD8318. The rest of the
adaptation is carried out with a custom made board.
A first array of
seven detectors was installed at the Pierre Auger Observatory in April
2011. The smooth operation and the results of this first test bed led
to an extension by 54 more detectors covering a total instrumented
surface of 93 . The first seven LNBf are of the
model GI301 made by Global Intersat and the 54 units of the extension
are from WSInternational, model DMX241. The GIGAS61 array is located
in the South-West part of the Pierre Auger Observatory. Its footprint
is shown in Fig. 4-left. Even if the MBR signal is
expected unpolarized, we fixed the polarization of each antenna. Out
of the 61 antennas, 33 have a North-South polarization, and 28 an
East-West one.
Several radio signals in the C-band were detected in
coincidence with Auger EAS events with GIGAS61[15]. These
detections validated the concept of the coincident radio detection and
were the first detections of EAS in the C-band. However, such EAS
emissions in the microwave band may have a different origin than MBR.
In particular, the signals were detected at distances to the air
shower axis of a few hundred meters only. This feature is in favor of
the hypothesis of a beamed emission over an isotropic one as origin of
these signals.
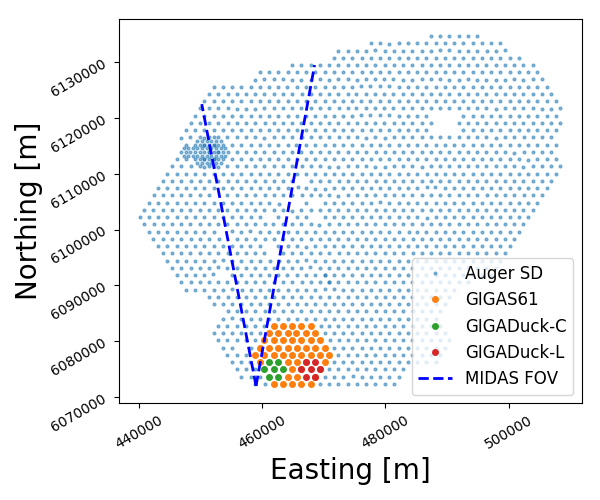

GIGADuck
The need to improve our sensitivity at large distance and to collect
more data led to the design and installation of two optimized arrays,
in the C-band and the L-band, with a higher antenna gain and a
modified antenna orientation. The array is now composed of a central
detector pointing to the Zenith with six peripheral detectors tilted
by 20∘ in zenith and with azimuth adjusted to point
towards the central detector (Fig. 4-middle and
right). This configuration increases the overlap of the detectors
field of view and enhance the probability to obtain a coincident
detection. Indeed, this configuration was chosen because the
observation of a coincidence between two radio detectors would support
the hypothesis of an isotropic emission.
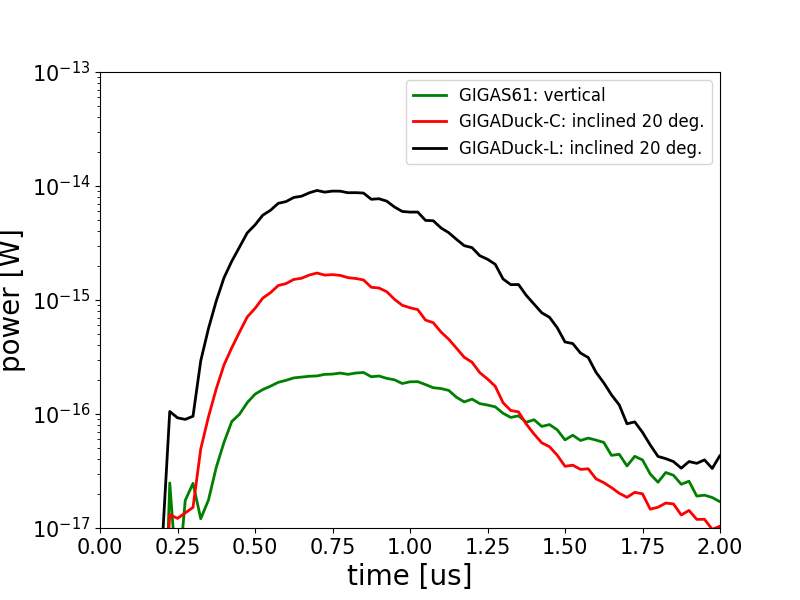
As an example of the
improved performance of GIGADuck, the simulation of the radio signal
power produced by MBR emitted by a vertical shower and detected by an
antenna belonging either to GIGAS61 or to GIGADuck at a
distance of 750 m is shown in Fig. 5. In
the case of this particular configuration of distance and angle, the
signal collected by the tilted GIGADuck-C antenna is around ten
times larger, due mainly to the higher gain and the direction of the
main lobe. In the L-band, the signal is increased by another factor
10, due to the quadratic dependence of the effective area of the
antenna with the wavelength (see Eq. (2)). Further
comparisons are shown in the section 4, they
include calibrated value of detector noise and realistic distribution
of the shower energies and arrival direction.
GIGADuck-C
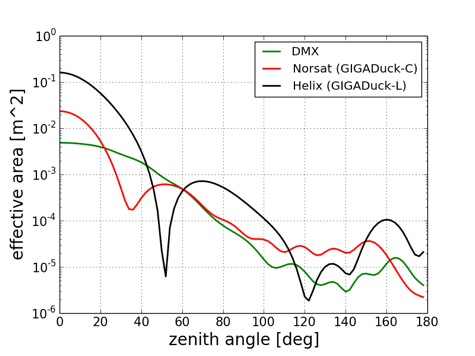
In the C-band, the antenna is a pyramidal horn of 15 dB gain from the A-Info company. It increases the maximum antenna effective area by a factor of six with respect to the antennas of GIGAS61. It is protected by a thin radome in plexiglass. The LNB is a Norsat 8115F. It was chosen for its low noise figure and has a flatter response in frequency with respect to GIGAS61 horns, and thus a larger bandwidth.
GIGADuck-L
In the L-band, the sensor is a helicoidal antenna with a conical copper grid at its base. It is tuned to be sensitive to a central frequency of 1.4 GHz and a gain of 15 dB. The sensor is directly followed by an electric surge protection and a band-pass filter (from 1.1 to 1.4 GHz) to decrease the amplitude of the signal at 900 MHz caused by the GSM band and the SD communication system. The choice of placing a filter before the amplifier is not optimal in terms of noise figure but is necessary to prevent the amplifier saturation. The amplification board is composed of two separated amplifiers from the Avago company, the MGA633P8 and the MGA13116. They are combined to obtain a gain of around 50 dB. In both GIGADuck versions the adaptation electronics was made on custom made board with discrete components.
3 Detector calibration
EASIER detectors are required to measure faint and impulsive signals. The widely used figure of merit of the sensitivity for such detectors reads as
| (1) |
where represents the flux resulting from a signal that would equate the noise fluctuations, stands for the system noise equivalent temperature (the sum of the thermal noise collected by the antenna and the electronics noise added mainly by the first amplifier), is the Boltzmann constant, is the effective area of the antenna (i.e. the portion of the incoming radio flux transformed into electrical power), and the square root term is the amount of samples over which the noise is averaged. In simple cases, is the product of the bandwidth with a time constant of a low pass filter, but in cases of transient signals, the expected duration of the signals has to be used for . We detail first the calibration of the sensor including the measurement or simulation of the parameters in Eq. (1). In a second time we determine the calibration parameters of the adaptation stage of the signal chain.
3.1 Sensor calibration
3.1.1 Antenna effective area
The effective area for a particular wavelength is derived from the knowledge of the antenna gain pattern , i.e. the gain of the antenna as a function of the direction:
| (2) |
The gain pattern can be either measured or simulated. It has been measured for the antenna DMX241 from WS International and for an ATM horn coupled to a Norsat LNB in an anechoic chamber at the IMEP (Institut de Microelectronique Electromagnetisme et Photonique) at Grenoble. In addition to these measurements, the High Frequency Simulation Software (HFSS) from ANSYS [20] was used to simulate the patterns of the different antenna types, taking into account the setup of the sensors, such as the presence of a radome. The simulated effective area of the antenna used in the three setups are represented in Fig. 6.
3.1.2 System noise temperature
The system noise factor is defined as the degradation of the signal-to-noise ratio (SNR) along the signal chain stages and can be expressed with a system noise temperature, . The main contributions to the noise temperature are:
-
1.
the antenna temperature : the thermal noise emitted by broad microwave sources such as the sky or the ground collected by the antenna;
-
2.
the electronics noise : the noise added by the electronics stage, usually dominated by the first stage of amplification.
A radome used to protect an antenna is a source of signal losses,
affecting the SNR and adding up a contribution in the noise
temperature.
To estimate the temperature of the three detector
versions, we have applied three different methods. A well known
method to measure a temperature contribution from a device like an
amplification system is the factor method. It consists in the
measurement of the device output when it is subject to two different
known sources of noise. In the case of GIGAS61 and
GIGADuck-C detectors, the amplification system is part of the
feed and cannot be isolated and tested separately. Hence, to apply the
factor method and produce a stable noise in the detector, the
source has to be a microwave emitting source that covers most of the
antenna main lobe. Having two references allows one to cancel out the
gain of the system and to extract the noise. Another method is to
make use of a natural microwave source like the Sun as a calibration
source when it goes through the field of view of the antenna. Lastly,
one can also directly measure the background radio power and deduce
the noise temperature provided a precise knowledge of the system gain.
The factor method was used in a dedicated measurement to obtain
GIGAS61 detector temperatures. The second method is used for
the GIGADuck arrays by measuring the Sun flux in the monitoring
data. As it will be described later, the Sun signal was also used to
correct for the pointing direction of GIGADuck-C
antennas. Finally the direct method is used to measure the L-band
setup system noise temperature.
GIGAS61 –
For GIGAS61 detectors, we apply the factor method to measure the electronics noise temperature. The measurement took place at the detector site. The setup comprises the main components of the nominal detectors, namely the LNBf, the radome and the power detector Minicircuit ZX47-50. The antenna was oriented consecutively up and down and the voltage of the power detector was recorded with a portable oscilloscope. The voltage difference between the two measurements is related to a difference of power according to the calibration curve of the power detector (see Eq ((8)) in section 3.2.1). The electronics noise temperature is computed with:
| (3) |
where , () is the antenna temperature when the antenna points toward the ground (the sky) and () are the corresponding powers. The antenna temperature is the brightness temperature of the surrounding sources weighted by the antenna gain:
| (4) |
with the brightness temperature in the direction . We applied the formula (4) with a brightness temperature profile (found in [21]) which ranges from 4 K in the sky direction to 270 K towards the ground. Antenna temperatures of and are obtained. It yields to electronics temperatures of and . Finally we add the antenna temperature to obtain the system noise temperature.
GIGADuck-C –
Compared to GIGAS61 detectors, GIGADuck antennas have a larger
effective area which make them sensitive to the Sun flux. Since
GIGADuck data are part of the SD data stream including the monitoring
system, the radio baseline is recorded every 400 s with other
information such as the outside temperature. We use these data to
search for the Sun signal and estimate the system temperature from it.
The position of the Sun in the sky is well known and the absolute flux
density in the frequency band is based on observations at the Nobeyama
Radio Observatory (NRO) at 3.75 GHz 111The Nobeyama
Radio Polarimeters are operated by Nobeyama Radio Observatory, a
branch of National Astronomical Observatory of Japan. Examples of
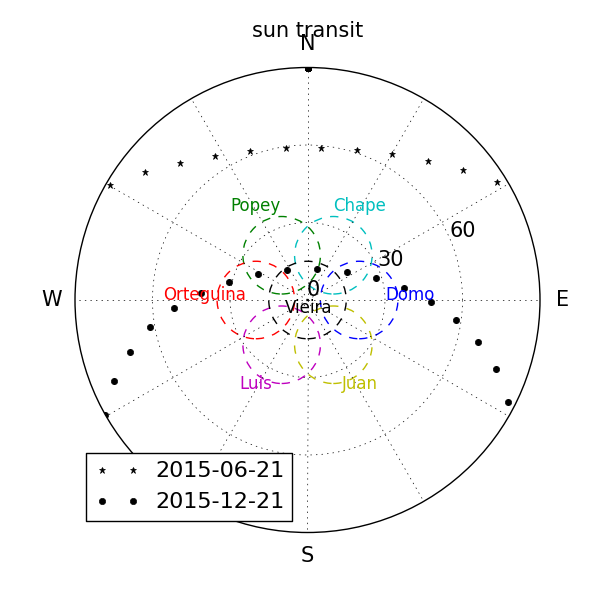
the Sun path through the GIGADuck C-band array are shown in
Figure 7. Most of the antennas (except the antenna on
the stations called Juan and Luis) have the Sun passing through their
field of view during the austral summer. However, when the Sun is low
in the sky (during austral winter time), none of the antennas is
sensitive to it. Since all GIGADuck antennas point in a different
direction, one expects the Sun to produce a signal with relatively
different intensity and shifted time of maximum according to their
orientation. Indeed, we use both information to constrain together
the system noise temperature and the pointing direction of the
GIGADuck antenna.
The increase of power induced upon the passage of the
Sun over the system noise power in the antenna field of
view reads
| (5) |
where is the total solar flux measured by the Nobeyama Radio Observatory [22] at 3.75 GHz, is the antenna effective area for the given position of the Sun in the sky, and the factor is the polarization factor.
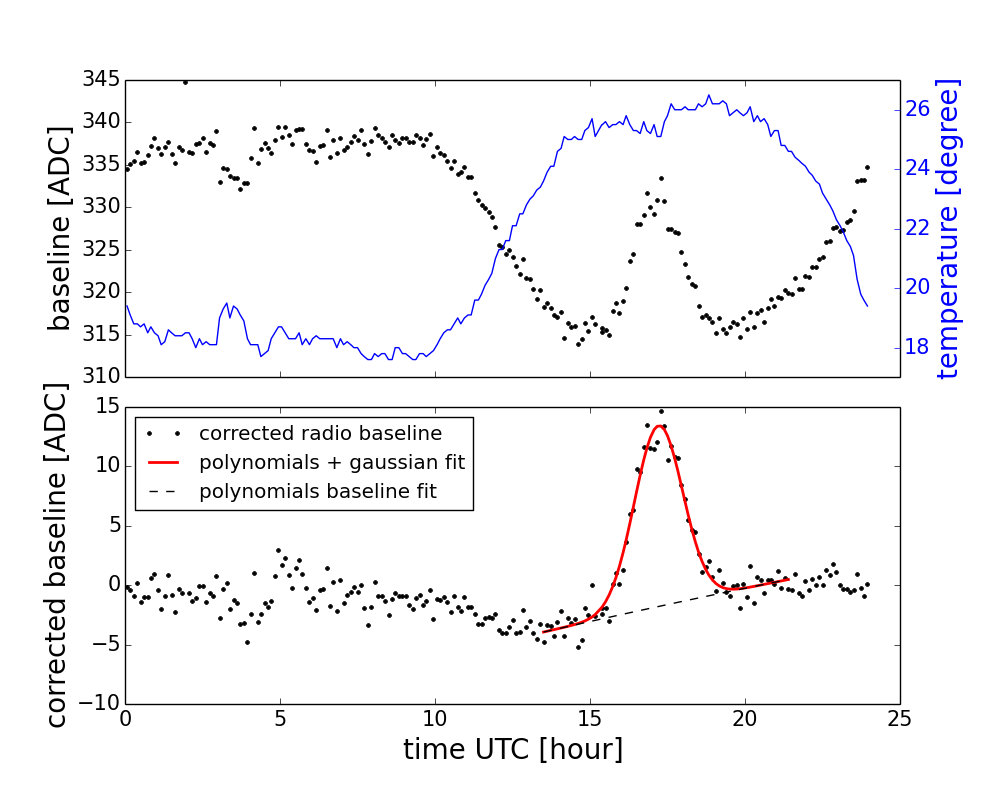
The radio baseline is strongly correlated to the outside temperature,
but can also be affected by the humidity in a non trivial way. We
first operate a selection on the dataset to isolate a set of stable
days, i.e. the days when the baseline is not affected by other
parameters but the outside temperature.
Firstly, a time window of 8
hours around the time when the Sun is expected to produce the highest
signal is removed temporarily. Then we reject the singular days when
the baseline RMS is lower than 2 ADCu (compared to 20 ADCu
typically). These low variations indicate that the signal chain was
faulty at that time. Days with large amplitude, often due to
thunderstorm condition, are removed by requiring baseline differences
over the day lower than 200 ADCu. From this data set, the dependence
of the radio baseline with the outside temperature is fitted with a
linear function. To improve the selection of stable days, the day
with the largest residual is removed and the fitting procedure is
repeated until no residual larger than 10 ADCu is found. Then, the
time window which encompasses the Sun contribution is restored in the
selected days and the complete baselines are corrected for the
temperature dependence. The final step consists in fitting the bump
induced by the Sun flux with a Gaussian function and a third order
polynomial. An example of the radio baseline is shown in
Figure 7-right before the temperature correction (top)
and after (bottom).
The selection and fit procedure are tested by
introducing fake signals to mimic the Sun contribution in the real
baselines of the antennas oriented towards the South (Luis and Juan)
thus insensitive to the Sun. Signals with a Gaussian shape are
introduced with various amplitude and time and are reconstructed
according to the method described above. The uncertainty due to the
limited knowledge of the baseline amounts to 4 ADCu on
the amplitude of the peak and to 12 minutes on the time
of maximum. The spread of the result of the fit is found to be
5 ADCu and 6 minutes.
The goal is to find
the best parameters to describe the system noise temperature and the
pointing direction given the observed amplitude and time of maximum.
We simulate the signal induced by the Sun microwave flux for a system
temperature from 30 to 120 K with 1 K step and for
angles [0∘; 20∘] and [0∘; 180∘] around the nominal angle for
the set of days selected in the aforementioned procedure. For each
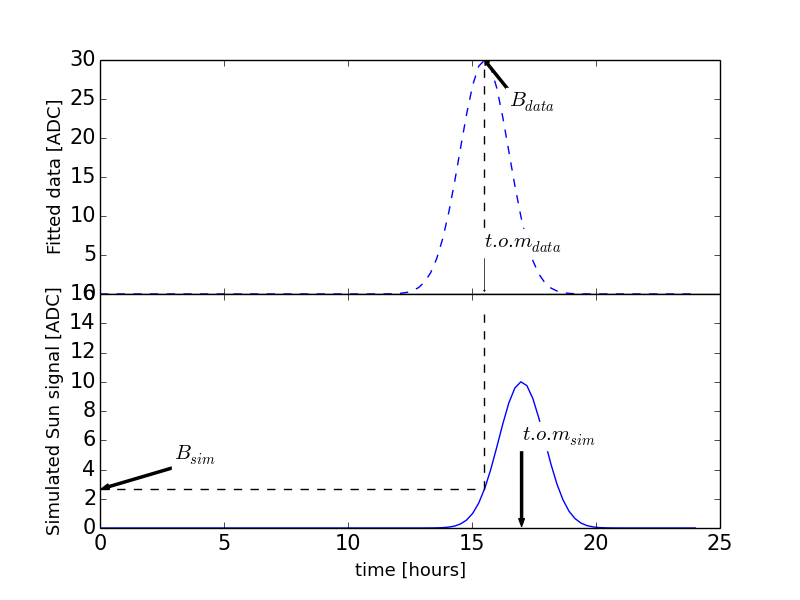
set of input parameters (, , ), the baselines in ADCu are computed. The best parameters are
found by minimizing the following :
| (6) |
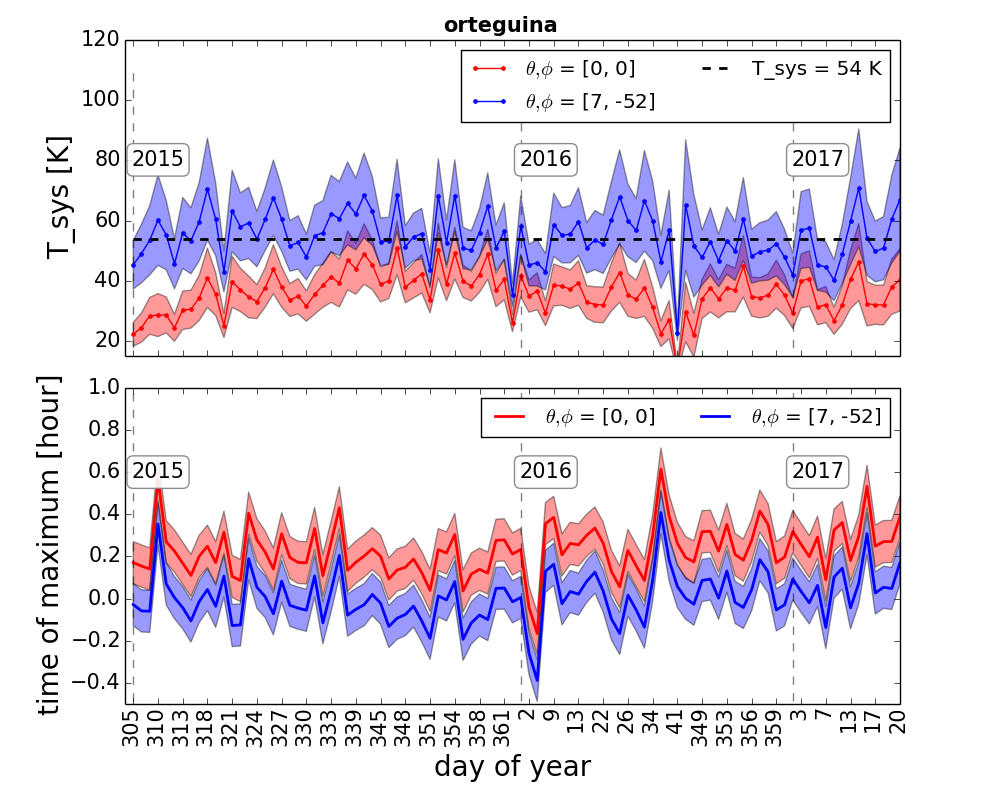
where each day is labeled with the index , stands for the time of the maximum in data and simulation, is the maximum of the fitted signal in ADCu in the data and the signal in the simulation taken at the time of the maximum measured in the data (see the scheme in Figure 8-left). The result are given in the table 1. Angular deviations from the nominal position are found to be at most 14 ∘ (in angular distance) and temperatures range from 54 K to 61 K. An example of the temperature measured for each day in the data set and the time of maximum compared to the simulated one is shown in Figure 8-right.
| station name | Popey | Orteguina | Domo |
|---|---|---|---|
| original orientation | 20 / 120 | 20 / 180 | 20 / 0 |
| new orientation | 25 / 116 | 23, 170 | 33, 12 |
| System Temperature | 61 | 54 | 58 |
GIGADuck-L –
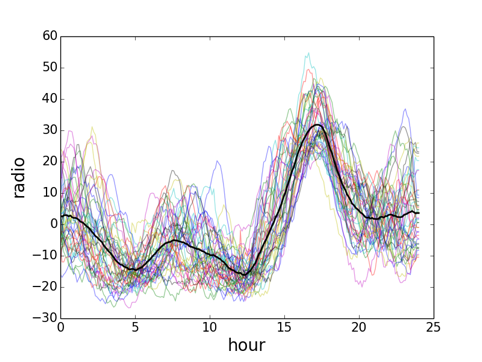
The L-band sensors are also sensitive to the Solar flux. Thirty daily baselines are overlaid in Fig. 9 and exhibits the Sun passage (around 18 h) but also other modulation (for instance around 0 h or 7 h). These modulations, whose origin may be the positioning satellite signal, prevent us from quantifying the Sun contributions in the same way as above. Hence, the noise temperature is deduced from the direct measurement of the baseline, simply by dividing the measured power by the total gain of the system. This method requires a precise calibration of the absolute gain of the detector which was performed prior to the installation. The amplifier is pre-terminated and its gain and noise temperature could be measured respectively with a Vector Network Analyser and a Noise figure meter. In the C-band this measurement is made difficult by the use of LNBf and the impossibility to disconnect the amplification stage from the feed waveguide. The system noise temperature is measured for all seven L-band detectors, it ranges from 94 K to 145 K.
3.1.3 Sensor bandwidth
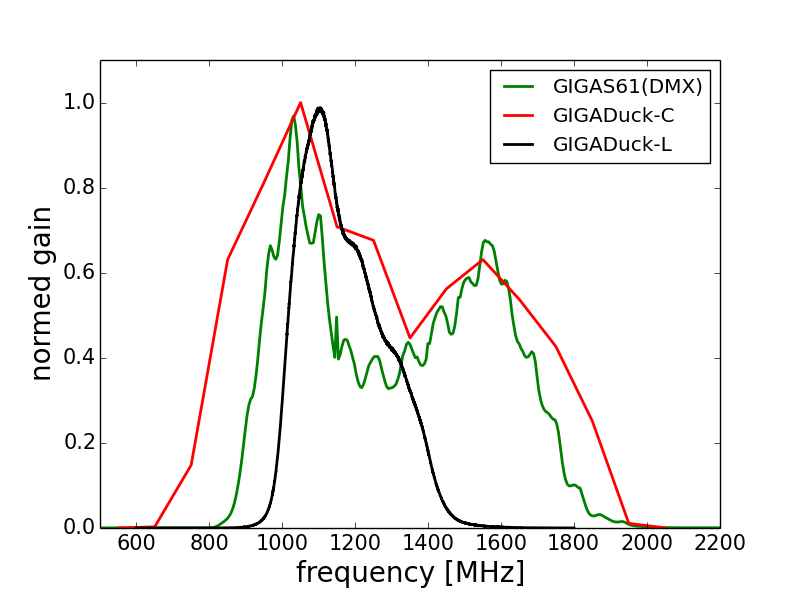
The absolute gain of the RF part which includes the amplifier, the bias tee, the cables etc., does not enter directly in the detector sensitivity, but the frequency bandwidth does (see Eq. (1)). The normalized gains of the LNB used for GIGAS61 (DMX241) and GIGADuck-C and the GIGADuck-L are represented in Fig. 9 and the effective bandwidth is computed according to:
| (7) |
The obtained effective bandwidths for GIGAS61 detectors are 437 30 MHz and 445 56 MHz for the GI301 and the DMX241 respectively. As for the GIGADuck-C, a bandwidth of 750 MHz is measured for the Norsat LNB, and finally an average of 250 MHz is found for the GIGADuck-L LNAs.
3.2 Electronics calibration
We describe here the functioning of the adaptation electronics. The first part of this section is dedicated to the study of steady signal of the adaptation needed to describe the baseline level, while the second part describes the time response, necessary to simulate the full signal chain.
3.2.1 Response to steady signals
The adaptation electronics is composed of the power detector and the adaptation board. The power detector output voltage was calibrated in laboratory using a noise waveform. The noise was produced using the output of an actual LNBf placed in front of a microwave absorber to obtain the same spectrum as in the data. The input power was varied with attenuators. The power-voltage characteristic reads:
| (8) |
is the voltage offset of the power detector. The power detector voltage is then amplified by a factor 4.2 to obtain a final power dynamics of 20 dB over the 2 V swing of the SD acquisition. An offset was designed to be adjustable on the adaptation board to make up for the differences of the detector gains. The overall conversion from the input power to the ADCu is:
| (9) |
where accounts for the total offset.
3.2.2 Response to impulsive signal
Power detector –
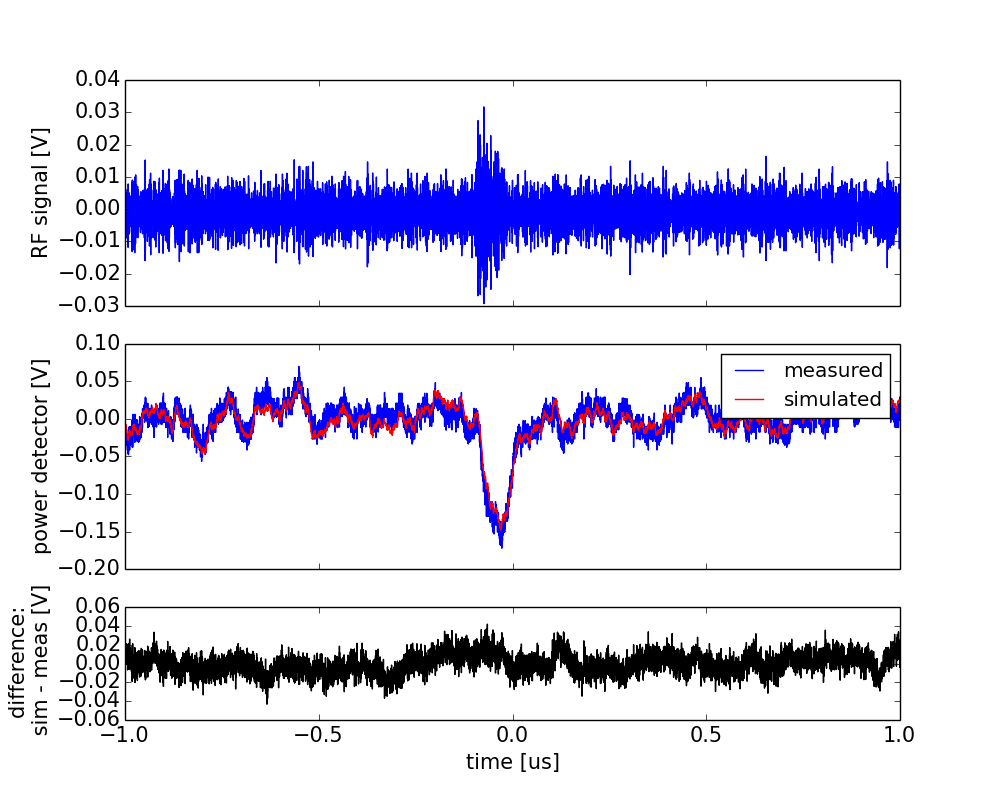
To understand the power detector response to impulsive signals, we set a detection chain in the laboratory composed of a LNBf followed by a power detector. An impulsive and high frequency (HF) signal is produced by the spark of an electronic lighter. The signal is recorded simultaneously after the LNBf and after the power detector by a fast oscilloscope. An example of these signals is shown in Fig. 10. We can therefore build a method to reproduce the power detector output from a HF signal. We find that the power detector output is well reproduced when one performs the convolution of the HF signal in dBm (logarithmic unit) and an exponential function with a decay constant :
| (10) |
The factor is fixed to the conversion factor in Eq. (8), is a floating offset and was found to provide the best fit to the data. 222The first seven detectors of GIGAS61 have a longer time response due to an output capacitor present by default in the power detector ZX47-50 and removed in the following version of EASIER.
Adaptation board –
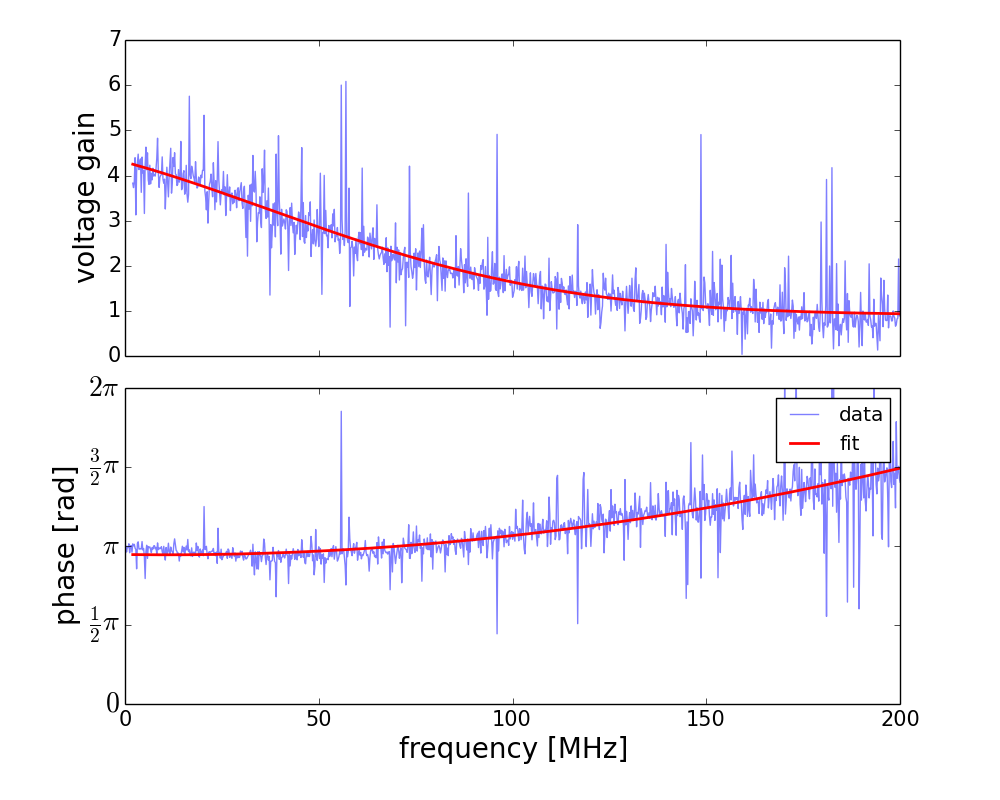
To measure the response of the adaptation board, we add it to the calibration setup described in the previous paragraph. We recorded simultaneously the input of the board and its output. We find the board response by measuring the transfer function in the frequency domain:
| (11) |
The gain and the phase of the board are represented in
Fig. 11. The time response is obtained by Fourier
transformation.
The last part of the chain, the Auger SD front end, is
simulated with a low-pass filter with and by sampling in time and amplitude.
4 Expected performances
This section is dedicated to presenting the performances of GIGAS61 and GIGADuck detectors in terms of EAS detection. In the section 4.1 we detail the method we implemented to estimate the flux from an EAS. In the section 4.2 we apply this method to estimate the expected number of events in one year of operation of GIGAS61 and GIGADuck detectors.
4.1 Simulation of the MBR signal from EAS
The longitudinal profile of EAS is parameterised with a Gaisser-Hillas
function [23] characterising the number of charged particles at a
certain depth. The mean values and RMS of the parameters used in the
Gaisser-Hillas function are first tabulated for energies between
1017.5 and 1021 eV. A randomisation is then
performed when generating an event using a Gaussian function for all
the parameters except for the depth of first interaction which follows
an exponential distribution. Starting from the first interaction
point, high in the atmosphere, the number of primary electrons is
calculated in grammage steps of = 2.5 g cm-2.
At each step, the mean energy deposit per particle is calculated
following a parameterisation at 1 MeV given in [24].
The lateral distribution function of the electrons in the plane
orthogonal to the shower axis is taken as an NKG function [25, 26].
The estimation of the flux of MBR photons emitted by the
ionisation electrons and received at ground is based on the derivation
presented in [19]. It accounts for the MBR differential
cross section obtained in [27] and the time evolution of the
shower plasma as the ionisation electrons get attached or see their
energy shifted as they undergo ionisation or excitation reaction. The
flux folded with the antenna effective area and integrated over the
frequency bandwidth yields the power envelope of the signal as a
function of the time at the receiver (an example of the power envelope
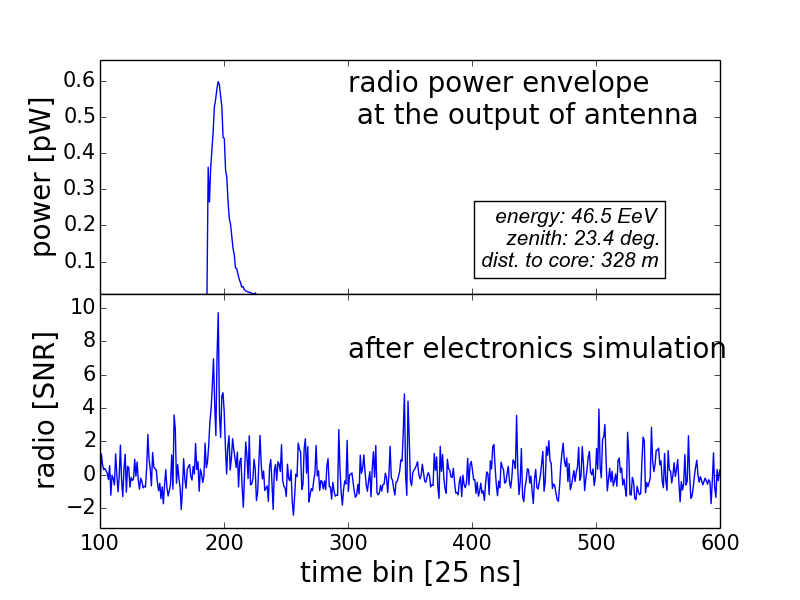
is shown in Figure 12-left). Following the model
in [19] we find a spectral intensity of for a shower of
eV observed at 10 km. This estimation
allows for the comparison with other MBR studies. For instance, the
same reference shower in the same conditions would produce a spectral
intensity of
according to the results of SLAC T471 [10], the original beam
test. We introduce a scale factor based on the comparison of the
reference shower, with for the model that we used and
for the SLAC T471 assumption. The parameter is used in the next
section to assess the performance of the detectors.
To account for
the detector response, the voltage deduced from the power envelope is
multiplied with a noise waveform produced according to the spectra
measured and presented in section 3.1. The
resulting waveform is the simulation of the RF voltage induced at the
output of the antenna by the EAS. A noise waveform is produced with
the same spectrum, but the average power is normalized with the system
noise temperature. We add the two waveforms to emulates the total RF
voltage. The adaptation electronics is then simulated as described in
section 3.2.2 to obtain a waveform in ADCu.
4.2 Expected event rate
For a scale factor , the number of expected events for a time period and for an area labeled inside which the shower core position is reads as:
| (12) |
where , the detection efficiency, is estimated with the simulations described below. The energy of the shower is generated randomly following the energy spectrum in the range above the so-called ankle energy which can be parameterised between E0 = 41018 eV and 31020 eV according to [28]:
| (13) |
where is a flux normalisation factor and the spectral index
above the ankle is 2.63. The term is the
energy at which the flux has dropped to half of its peak value before
suppression, and is its associated steepness. They are
fixed to 19.63 and 0.15 respectively.
Shower cores are randomly
generated over a surface covering an Auger hexagon, while the arrival
directions and are randomly generated to guarantee
uniformity in terms of and (with
limited to 60∘). For the three detectors, GIGAS61,
GIGADuck-C and GIGADuck-L, we simulate 5000 proton showers. For each
shower we compute the MBR power at the seven antennas of the hexagon.
Scale factors from 1 to 1000 are applied and the electronics is
then simulated ten times for each . The radio waveform is
transformed in SNR unit according to: (see Fig. 12-left). We
apply simple selection criteria on these processed data. We select
events with a waveform that passes a threshold of SNR = 5 in a time
window of 1 s around the expected time of maximum. The
expected number of events for one equipped hexagon within a year of
data taking is shown in Figure 12-right, where the
abscissa axis is the scale factor. The initial implementation,
GIGAS61, is already sensitive to the level of intensity as
measured by SLAC T471 () but would observe only one or two
events. For the same scale factor, this number increases by a factor
of 3 with GIGADuck-C. The best performances are obtained with
GIGADuck-L with possible detection down to scale factor of around .
Several improvements in the analysis would help to identify MBR
and are worth noting here. The basic event selection can be improved
using digital filtering. Such analysis will particularly enhance the
long duration signal (a few s) as expected for MBR signal.
Furthermore, in contrast to the geosynchrotron emission or the
Askaryan effect, also present at GHz frequencies, the MBR emission is
isotropic, this gives the possibility to identify it by requesting
that the GHz radiation is detected at large distances. A plausible
selection criteria would thus be performed on the number of stations
that detected a radio signal in coincidence with the same shower. By
requesting at least two stations spaced on the regular SD array
(1500 m spacing), one would discard emissions arising from
geosynchrotron or Askaryan effects (the expected signals of which
expand over a few hundred meters only). Indeed, the antenna
orientation of GIGADuck antennas was chosen optimized the coincidence
probability.
However, even with these methods, if the MBR intensity
is at the level of the reference model [19], its detection
with the presented instruments is hardly possible with only 0.1 event
expected per hexagon per year at best. To improve further the signal
to noise ratio, other experimental techniques, like cryo-cooled
detectors, should be considered. Note that the estimation of the MBR
flux is delicate and if numerous processes are already included
in [19] the conclusions on theoretical predictions are
uncertain justifying the experimental prospection being carried out
with GIGAS61 and the GIGADuck detectors.

5 Conclusion
GIGAS61 and its successors GIGADuck-C and GIGADuck-L are designed for
the detection of MBR produced by EAS in the microwave frequencies and
integrated in a Pierre Auger Observatory surface detector. This design
was proven to be efficient since GHz signals associated to air showers
were observed with the first implemented array GIGAS61. However the
origin of such signal could not be attributed unambiguously to the MBR
and detectors with an enhanced sensitivity (GIGADuck-C and GIGADuck-L)
were installed.
We have demonstrated the good operation of the
installed detectors and we performed a calibration of the parameters
useful to describe their sensitivities, namely the effective area, the
noise temperature and the bandwidth. The simulation of the
electronics, and especially the response to short pulses was also
studied and shown to be well understood.
The performance of these
detectors was examined under various assumptions for the MBR
intensity, and with a simulation of the detector chain. We verified
the improvement of performance obtained with the GIGADuck detectors.
For the most sensitive array (GIGADuck-L), the number of
expected events is of the order of 15 per year for one equipped Auger
hexagon when the original estimation from SLAC T471 is assumed. While
the expectation from the most recent model of MBR emission is still be
out of reach, GIGAS61 and GIGADuck detectors is able to probe the flux of MBR over two frequency bands.
The detectors
have been operating and accumulating data since 2011 for the first one
and since end of 2016 for the last installed one. The analysis of the
data to search for MBR signals or derive upperlimits on the intensity
are being now carried out and will be presented in a future paper.
Acknowledgement
We gratefully acknowledge the very fruitful exchanges we had with all
of our colleagues in the Auger collaboration and the use of all Auger
facilities from hardware to software including access to a subset of
shower data. We are also deeply indebted to the commitment of the
observatory staff whose strong support in constructing and deploying
the LSD prototype was extremely appreciated
We acknowledge the
support of the French Agence Nationale de la Recherche (ANR) under
reference ANR-12- BS05-0005-01.
References
- [1] A. Aab, et al., The Pierre Auger Cosmic Ray Observatory, Nucl. Instrum. Meth. A798 (2015) 172–213. arXiv:1502.01323, doi:10.1016/j.nima.2015.06.058.
- [2] The Telescope Array, Nuclear Physics B - Proceedings Supplements 125-126 (2008) 221–226.
- [3] M. Fukushima, Measurement of Ultra-High Energy Cosmic Rays: An Experimental Summary and Prospects, EPJ Web Conf. 53 (2013) 02002. arXiv:1302.5893, doi:10.1051/epjconf/20135302002.
- [4] J. V. Jelley, J. H. Fruin, N. A. Porter, F. G. Weekes, R. A. Porter, Nature 205 (1965) 327.
- [5] D. Ardouin, et al., Radioelectric Field Features of Extensive Air Showers Observed with CODALEMA, Astropart. Phys. 26 (2006) 341–350. arXiv:astro-ph/0608550, doi:10.1016/j.astropartphys.2006.07.002.
- [6] W. D. Apel, et al., Experimental evidence for the sensitivity of the air-shower radio signal to the longitudinal shower development, prd 85 (7) (2012) 071101. arXiv:1203.3971, doi:10.1103/PhysRevD.85.071101.
- [7] A. Aab, et al., Energy Estimation of Cosmic Rays with the Engineering Radio Array of the Pierre Auger Observatory, Phys. Rev. D93 (12) (2016) 122005. arXiv:1508.04267, doi:10.1103/PhysRevD.93.122005.
- [8] T. Huege, Radio detection of cosmic ray air showers in the digital era, Phys. Rept. 620 (2016) 1–52. arXiv:1601.07426, doi:10.1016/j.physrep.2016.02.001.
- [9] A. Aab, et al., Probing the radio emission from air showers with polarization measurements, Phys.Rev. D89 (5) (2014) 052002. arXiv:1402.3677, doi:10.1103/PhysRevD.89.052002.
- [10] P. Gorham, N. Lehtinen, G. Varner, J. Beatty, A. Connolly, et al., Observations of Microwave Continuum Emission from Air Shower Plasmas, Phys.Rev. D78 (2008) 032007. arXiv:0705.2589, doi:10.1103/PhysRevD.78.032007.
- [11] J. Alvarez-Muñiz, et al., The Air Microwave Yield (AMY) experiment - A laboratory measurement of the microwave emission from extensive air showers, PoS EPS-HEP2013 (2013) 026. arXiv:1310.4662.
- [12] M. Monasor, et al., The Microwave Air Yield Beam Experiment (MAYBE): Measurement of GHz radiation for Ultra-High Energy Cosmic Rays detection, in: Proceedings,32nd International Cosmic Ray Conference (ICRC 2011): Beijing, China, August 11-18, 2011, Vol. 3, 2011, pp. 196–199, [3,196(2011)]. arXiv:1108.6321, doi:10.7529/ICRC2011/V03/0917.
- [13] J. Alvarez-Muñiz, et al., The MIDAS telescope for microwave detection of ultra-high energy cosmic rays, Nuclear Instruments and Methods in Physics Research A 719 (2013) 70–80. arXiv:1208.2734, doi:10.1016/j.nima.2013.03.030.
- [14] R. Smida, et al., First Experimental Characterization of Microwave Emission from Cosmic Ray Air Showers, Phys. Rev. Lett. 113 (22) (2014) 221101. arXiv:1410.8291, doi:10.1103/PhysRevLett.113.221101.
- [15] R. Gaior, Detection of cosmic rays using microwave radiation at the Pierre Auger Observatory, in: Proceedings, 33rd International Cosmic Ray Conference (ICRC2013): Rio de Janeiro, Brazil, July 2-9, 2013, p. 0883.
- [16] K. Greisen, Phys. Rev. Lett. 16 (1966) 748.
- [17] G. Zapsetin, V. Kuzmin, Sov. Phys. JETP Lett. 4 (1966) 78.
- [18] I. Al Samarai, O. Deligny, D. Lebrun, A. Letessier-Selvon, F. Salamida, An Estimate of the Spectral Intensity Expected from the Molecular Bremsstrahlung Ra- diation in Extensive Air Showers, Astropart. Phys. 67 (26).
- [19] I. Al Samarai, C. Bérat, O. Deligny, A. Letessier-Selvon, F. Montanet, M. Settimo, P. Stassi, Molecular Bremsstrahlung Radiation at GHz Frequencies in Air, Phys. Rev. D93 (5) (2016) 052004. arXiv:1601.00551, doi:10.1103/PhysRevD.93.052004.
- [20] HFSS, Ansys ® Academic Research, Release 15.0.
- [21] T. Y. Otoshi, “Noise Temperature Theory and Applications for Deep Space Communica tions Antenna Systems“, Artech House, 2008.
-
[22]
[link].
URL http://solar.nro.nao.ac.jp/norp/index.html - [23] T. Gaisser, A. Hillas, The Microwave Air Yield Beam Experiment (MAYBE): Measurement of GHz radiation for Ultra-High Energy Cosmic Rays detection, in: Proceedings,15th International Cosmic Ray Conference (ICRC1977): Plovdiv,Bulgaria, 1977, Vol. 8, 1977, p. 353.
- [24] F. Nerling, J. Bluemer, R. Engel, M. Risse, Universality of electron distributions in high-energy air showers: Description of Cherenkov light production, Astropart. Phys. 24 (2006) 421. arXiv:0506729.
- [25] K. Greisen, Ann. Rev. Nucl. Sci. 10 (1960) 63.
- [26] K. Kamata, J. Nishimura, Prog. Theoret. Phys. Suppl. 6 (1958) 93.
- [27] V. Kas’yanov, A. Starostin, On the Theory of Bremsstrahlung of Slow Electrons on Atoms, Soviet Journal of Experimental and Theoretical Physics 21 (1965) 193.
- [28] A. Schulz, et al., The measurement of the energy spectrum of cosmic rays above eV with the Pierre Auger Observatory, in: Proceedings,33rd International Cosmic Ray Conference (ICRC 2013): Rio, Brasil, 2013. arXiv:1307.5059.