2017/5/31 \Accepted2017/10/02
Methods: numerical — Stars: formation — ISM: clouds
The effect of photoionising feedback on star formation in isolated and colliding clouds
Abstract
We investigate star formation occurring in idealised giant molecular clouds, comparing structures that evolve in isolation versus those undergoing a collision. Two different collision speeds are investigated and the impact of photoionising radiation from the stars is determined. We find that a colliding system leads to more massive star formation both with and without the addition of feedback, raising overall star formation efficiencies (SFE) by a factor of 10 and steepening the high-mass end of the stellar mass function. This rise in SFE is due to increased turbulent compression during the cloud collision. While feedback can both promote and hinder star formation in the isolated system, it increases the SFE by approximately 1.5 times in the colliding case when the thermal speed of the resulting HII regions matches the shock propagation speed in the collision.
1 Introduction
While star formation is known to occur in the giant molecular clouds (GMCs) that form the coldest part of the interstellar medium (ISM), it remains far from clear what factors control the conversion from cloud gas into stars. Simple considerations tell us that the GMCs cannot be undergoing free-fall gravitational collapse to convert their gas into bouts of star formation. Within the solar circle, the mass of the Milky Way in GMCs is of order M⊙. With a free-fall time of Myr for gas at the typical average GMC density of 100 cm-3, this would yield a star formation rate of M⊙yr-1; two orders of magnitude greater than the observed rate of – M⊙yr-1 (Chomiuk & Povich, 2011). The GMCs are therefore either unbound structures and not dominated by their gravity, or they receive additional support from sources such as turbulence, magnetic fields, and/or stellar feedback.
Whether GMCs are gravitationally bound is difficult to determine. Both observations and global simulations that form clouds within a modelled galactic disc, suggest that GMCs are borderline bound, measuring a virial parameter , where , and correspond to the cloud velocity dispersion, mass and radius (Roman-Duval et al., 2010; Dobbs et al., 2011; Tasker et al., 2015; Jin et al., 2017). Unfortunately, the errors in measuring observationally are large, due to projection effects that force observers to integrate cloud spatial properties along the line-of-sight. Typical errors when measuring cloud properties are within a factor of two, but the uncertainty for the derived value comprehensively straddles the range from unbound to bound (Beaumont et al., 2013; Pan et al., 2015, 2016). Additional uncertainties to further arise due to the assumption that the clouds are spherical, of uniform density, and isolated structures (Federrath & Klessen, 2012). Despite these problems, the average cloud size of M⊙ and pc suggests that GMCs ought to be bound unless they have a velocity dispersion greater than that offered by thermal support. There must therefore be a source of turbulence affecting the evolution of GMCs and determining the rate of conversion from gas into stars.
The drivers for this turbulence may be internal or external (see Federrath et al. (2017) for a review of turbulence drivers). Internal drivers chiefly consist of thermal and kinetic feedback from the production of stars. This can both disrupt neighbouring collapsing regions of gas and also trigger collapse at the edge of expanding shells of hot gas. In Shima et al. (2017) we explored the impact of photoionising radiation in an idealised GMC and one whose structure was formed in a global galactic disc simulation. The increased heating of gas around photoionising stars increased the mass of the largest stars by suppressing fragmentation and freeing a greater amount of gas to be accreted. The combined pressure from the feedback could eventually disrupt the cloud and throttle star formation, but if the gas was extremely dense the feedback was unable to dominate over gravity. This dependence on the local environment was also found by Krumholz et al. (2010), who argues that a high surface density effectively traps radiation which suppresses fragmentation to allow more massive stars to form. Harper-Clark & Murray (2009) and Dale et al. (2014) also note the result of feedback is heavily dependent on cloud structure.
In contrast to such internal forces, the injection of turbulence to support GMCs may be drawn from the surrounding galactic environment. In global simulations without star formation, Jin et al. (2017) found a wide range of solenoidal and compressive turbulence modes were created within clouds due to their mutual interaction within the galactic disc. In similar simulations that compared runs with and without star formation and thermal feedback, Tasker et al. (2015) found that cloud properties were not strongly dependent on internal processes, supporting the idea that cloud evolution can also be driven by external conditions. This was further investigated by Fujimoto et al. (2014), who found global structures such as spiral arms and a galactic bar could change the range in cloud properties by increasing the rate of cloud interactions. Such global-scale interference is supported by observations that see variations in GMCs and specific star formation rates within different galactic structures (Koda et al., 2009; Meidt et al., 2013; Momose et al., 2010)
Whether internal or external drivers dominate GMC evolution may be reflected in the resulting star formation. If external processes are the key component to dictating a cloud’s star formation history, then the stellar population may principally may be created in cloud collision events. Tan (2000) and Fujimoto et al. (2014b) found that if cloud collisions triggered star formation, they could explain the empirical relation between gas surface density and the surface star formation rate (Kennicutt-Schmidt relation, Kennicutt (1998)). Observations have also supported the notion that cloud interactions are common events. Super star clusters with masses M⊙ packed into a cluster of radius pc have been observed to be associated with clouds colliding at velocities around km s-1 (Furukawa et al., 2009; Ohama et al., 2010; Fukui et al., 2016), as well as sites of high-mass star formation (Torii et al., 2015). Massive stars and clusters are difficult to form through isolated gravitational collapse, since the formation of massive stars should heat the local environment and prevent further accretion (acting as a cap on maximum star size) and disperse the surrounding gas. During a collision, gas is compressed at the interface between the two clouds, creating a high density shell of gas. The rise in density can potentially reduce the local Jeans mass to lead to a lower characteristic stellar mass (Hennebelle & Chabrier, 2009), but the collision can also promote the production of massive stars from an increase in the velocity dispersion or a faster formation timescale that allows longer accretion from the surrounding dense gas. If such collisions can be interpreted as compressive driving of turbulence, then we expect an enhanced star formation rate by factors ranging from a few to up to 10 (Federrath & Klessen, 2012; Federrath et al., 2016).
In simulations of colliding clouds between 7 - 15 pc in size, Takahira et al. (2014) found that collisions produced massive star-forming cores and a play-off took place between the shock speed –which heightened core production– and the duration of the shock moving within the cloud, which allowed cores to grow within the dense environment. Parsec-scale clouds in simulations by Balfour et al. (2015) and Balfour et al. (2017) agreed that the slower collisions were more efficient at forming massive stars in these smaller systems, while Wu et al. (2017) confirmed a star formation rate and efficiency higher by a factor of ten in colliding GMCs with added support from magnetic fields. Ultimately, these results agree that if cloud evolution is driven by collisional interactions and result in a tendency towards more massive stars, then the resulting stellar initial mass function (IMF) should be more top-heavy than if the cloud evolved in isolation.
In this paper, we explore the star formation from isolated and colliding GMCs and the evolution after energy injection by stellar feedback. Unlike previous simulations in Takahira et al. (2014) and also those considered by Wu et al. (2017), we include a sink particle method into a grid based code that allows stars to gather gravitationally bound and collapsing gas from their surrounding environment. These criteria ensure that if the turbulence is high, a higher mass will be needed for the particle creation. Therefore, an increase of turbulence within the shock will lead to more massive stars. We also include output feedback energy from photoionisation, but we do not include magnetic fields. In Section 2 we describe our method, Section 3 shows our results for the isolated and colliding cases and the outcomes are summarized in Section 4.
2 NUMERICAL METHODS
Our simulations use the adaptive mesh refinement (AMR) hydrodynamics code, Enzo, with a three-dimensional implementation of the Zeus hydro-code to evolve the gas (Bryan et al., 2014; Stone & Norman, 1992). The simulation box size is pc along each side, covered by a root grid with cells, with two additional static meshes that are located at the position of the clouds throughout the simulation. An additional three levels of adaptive refinement are used, based on the requirement that the Jeans length must not fall below five cells. This limit is slightly larger than the four cells per Jeans length suggested by Truelove et al. (1997) as the minimum needed to prevent spurious numerical fragmentation. We note that in order to resolve turbulence on the Jeans scale, an even higher resolution of 30 cells per Jeans length may be required (Federrath et al., 2011). At the maximum refinement level, the cell size is 0.029 pc. Gas at this level that continues to collapse risks violating the Jeans length resolution criteria. At this point, we introduce a sink particle algorithm as described in Federrath et al. (2010) to convert gas into pressure-less particles that can continue to accrete gas and radiate (see below).
Non-equilibrium cooling down to 10 K (the typical temperature of the dense gas in GMCs) is computed within Enzo by following nine atomic and molecular species, and and supplemented with metal and molecular cooling using a data table from the CLOUDY photoionisation package (Ferland et al., 1998; Smith et al., 2008). CLOUDY assumes a solar hydrogen mass fraction and metallicity, but does presume that the gas will be optically thin; a weakness when considering gas within GMCs. The mean molecular weight is calculated from the species abundances, giving a value 1.2. In addition to stellar feedback, the gas is heated by photoelectric heating which is proportional to the gas density as implemented in Tasker (2011). The gas is self-gravitating in all simulations, computed using a multi-grid solver to solve the Poisson equation.
2.1 Star Formation and Feedback
Stars are born in the simulation following a modified version of Enzo’s star cluster formation scheme described in Wise et al. (2012), using the sink particle criteria proposed by Federrath et al. (2010) to treat gravitationally bound and collapsing gas objects. A sink particle is formed when the following criteria are met: (a) cell density is greater than a threshold value, , (b) the cell is on the finest level of refinement, (c) the gas within the control volume (i.e., the Jeans volume) is not within the accretion sphere of another sink particle, (d) the gas in the control volume is converging towards the center of the control volume (e) the local gravitational potential minimum is within the accretion sphere, (f) gas within the accretion sphere is Jeans unstable for collapse and (g) gas within the accretion radius is gravitationally bound.
The binding energy is calculated as the sum of the gravitational, kinetic and thermal energy. Our simulation does not include support from magnetic fields, so our initial sink mass is a lower limit. The radius of the accretion sphere and the threshold density are calculated from the Jeans length criteria as and , where is the minimum Jeans length we can resolve with five cells at maximum refinement, is the minimum cell size and is the sound speed. For gas at 10 K, our simulation uses an accretion radius of pc and a threshold density of g cm-3, which is above the observed value ( cm g cm-3) for star formation to occur (Lada C. J., Lombaridi M. & Alves J. F., 2010; Ginsburg et al., 2012; Kainulainen et al., 2014).
When a sink is formed, gas over the threshold density is removed from the cell to create the initial particle’s mass. The sink is given the average velocity of the neighbouring cells, avoiding the potential for a runaway particle. Once created, the sink can accrete gas over the threshold density that is within the accretion sphere and bound to that sink. The sink gathers mass for a local dynamical time (the free-fall time inside the accretion sphere) or until the sink mass hits 50 M⊙; a cluster mass that is liable to contain at least one massive star based on a Salpeter IMF between 1–100 M⊙. If another particle enters the accretion sphere during the accretion phase, the sink particles will merge if they are gravitationally bound. The resulting sink should therefore be thought of as a star cluster, not an individual star.
If the sink particle mass exceeds 20 M⊙ after the accretion has finished, the particle will emit ionising radiation. This is calculated using the adaptive ray tracing scheme implemented in Enzo that is described in Abel & Wandelt (2002); Wise & Abel (2011) and based on the HEALPix framework (Górski et al., 2005). Each particle has an ionising luminosity of , which assumes solar metallicity and a Salpeter IMF between – M⊙ (Schaerer, 2003). Notably within this range, the IMF gradient does not depend strongly on our model choice and the Chabrier IMF produces a similar distribution (Chabrier, 2005). The rays are assumed to be monochromatic with a mean ionising photon energy of eV. The gas is assumed to be predominantly hydrogen to give a heating rate of . Since we ignore the radiative feedback from sink particles below 20 M⊙ for computational reasons, our feedback can be considered a lower limit.
2.2 Initial Conditions
We consider three sets of initial conditions. The first simulation is an isolated cloud, while the second and third sets are clouds with differing collision velocities. The mass of the isolated cloud is equal to the combined mass of the two colliding clouds.
The clouds are surrounded by low density ( g cm-3) background gas at K. The clouds themselves have a Bonnor-Ebert density profile which takes the form of a hydrostatic, isothermal and self-gravitating sphere of gas that is confined by its external pressure (Bonnor, 1956). The origin of this profile is analytic, however observations have provided evidence of such profiles occurring in the Universe, such as the Bok Globule, B68 (Alves et al., 2001). The Bonner-Ebert sphere is unstable if its dimensionless radius, ( is the central cloud density), exceeds a critical value of . Our spheres sit at the slightly higher value of and therefore begin to collapse after the start of the simulation.
The cooling of the gas is initially compensated by an initial injection of turbulence that imposes a velocity field within the cloud. This is described in detail in Takahira et al. (2014); Shima et al. (2017). In brief, a velocity power spectrum of is added to the gas, corresponding to the expected spectrum given by Larson for GMCs (Larson, 1981; Mac Low et al., 1998) and appropriate for the supersonic turbulence seen in molecular clouds (Federrath, 2013). This creates a filamentary density structure (Arzoumanian et al., 2011; Federrath, 2016), rather than a centralised collapse. The initial amplitude of the turbulence is dictated by the Mach number, , where is the velocity dispersion inside the cloud and is the sound speed at the equilibrium temperature. Initially the Mach number is 1.0, but the cloud cools within a few Myrs, which is shorter than the crossing time ( Myr). After this, the turbulence is supersonic with a typical Mach number of 10.
Idealized (Bonnor-Ebert) cloud initial parameters: radius, mass, temperature, average density, free-fall time and velocity dispersion. isolated small large 24.5 11 22 pc 5.5 1.1 4.4 M⊙ 580 260 520 K 6.1 13.6 6.8 g cm-3 8.5 5.7 8.0 Myr 3.8 2.7 3.5 km s-1
For the simulations of colliding clouds, we evolve the clouds in a stationary position for 0.5 Myr to allow the development of the turbulent density structure. The smaller cloud is then given a bulk velocity of 10 km s-1 or 20 km s-1 in the direction of the larger cloud to form a head-on collision. These velocities were based on simulations performed by Takahira et al. (2014), who found that slower velocities did not result in a strong shock front while a faster collision completed the interaction before the dense gas had time to collapse. This sweet spot of around km s-1 also appears to be supported by the observed collision velocities of clouds around super star clusters.
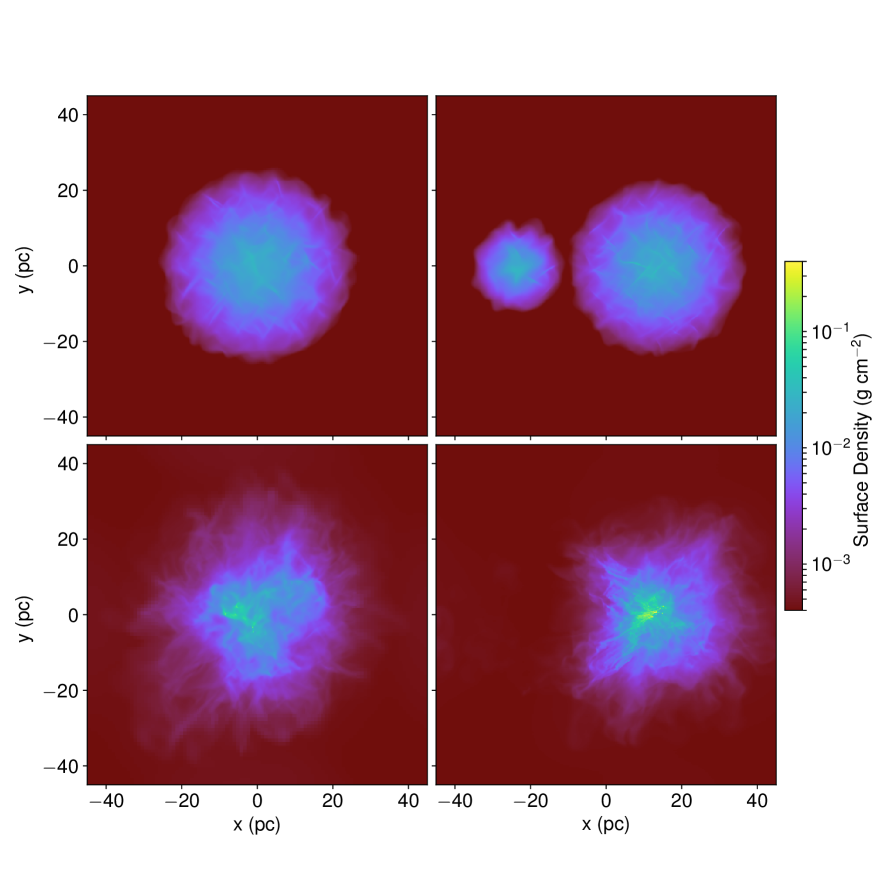
Figure 1 shows the surface density along the z-axis at 0.5 Myr when the turbulent structure has been established (top panels) and at 4 Myr (bottom panels) which is our main analysis time. The left-hand panels show the isolated cloud, while the right-hand panels show the colliding clouds with velocity 10 km s-1. Our analysis time for comparing the isolated and colliding clouds was chosen to be half the free-fall time of the isolated (and largest colliding) cloud. A summary of the cloud properties is shown in Table 2.2.
3 Results
To assess the impact of both the collision and feedback, this section will first look at the comparison of the isolated and colliding clouds where sink particles do not emit ionising radiation. The final part of this section will consider the addition of this feedback.
3.1 Gas Structure
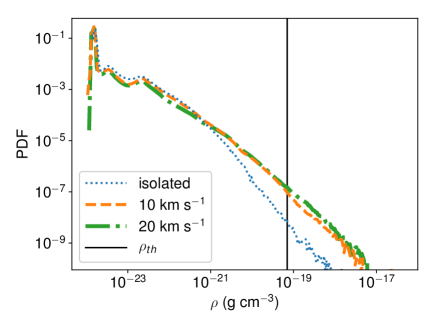
The range of densities within the cloud gas can be seen in the one-dimensional density probability distribution functions (PDF) in Figure 2, for our analysis time of 4 Myr. The blue dotted line shows the isolated cloud, while the orange dashed and green dot-dashed lines are for the clouds that collided with 10 km s-1 and 20 km s-1, respectively. The black vertical line shows the density threshold for the sink particle creation. Gas to the right of this line is therefore eligible to be converted into stars, assuming it is gravitationally bound to a sink (as described in section 2).
At the sink threshold, the colliding cloud systems both have over a factor of ten more dense gas than in the isolated case. This extends into a power-law tail that is expected when gravity starts to dominate over turbulence (Klessen, 2000; Kritsuk et al., 2011; Federrath & Klessen, 2013; Schneider et al., 2013; Kainulainen et al., 2014). The excess dense gas is from the interface of the collision which creates a bow-shaped shock as the smaller cloud penetrates the body of the larger GMC (see Takahira et al. (2014) for images of the evolution of the collision). The result is a substantially broader PDF profile, demonstrating that compressive turbulence is being driven by the collision of the clouds (Federrath et al., 2008, 2010). This is expected to lead to an enhanced star formation rate (Federrath & Klessen, 2012). Notably, gas with densities higher than the sink formation threshold is not being instantly converted into sink particles because of the sink creation criteria of bond and collapsing gas introduced by Federrath et al. (2010) (see method section). This suggests that while dense, the turbulence is kinetically supporting the gas against collapse and preventing it being immediately available for sink creation. Larger cores with masses able to dominate the turbulence should therefore be favoured and will accrete from the surrounding gas to form the massive clusters seen in observations of cloud collisional systems (Fukui et al., 2016). This will be shown explicitly below. Between the two collision velocities, the gas distributions are similar, with the faster impact producing slightly more dense gas beyond the sink threshold.
3.2 Star Formation
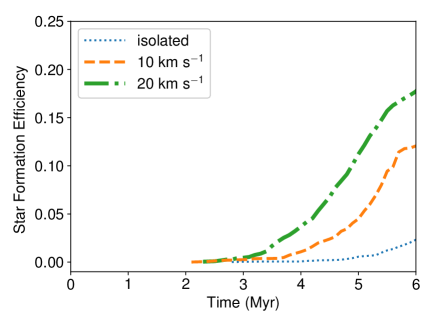
How actively the cloud converts its gas into stars can be measured by looking at the cloud’s star formation efficiency (SFE), defined as , where is the total mass in stars at time , and is the total cloud mass (for the colliding case, for both clouds) at the start of the simulation. The evolution of the SFE is plotted in Figure 3 for the isolated (blue-dot) and two colliding systems (orange-dash and green-dot-dash) without photoionising feedback.
Initially, the gas is not dense enough to form sink particles. Thermal support decreases as the gas cools, then stars start to form earlier than the global collapse timescale (8 Myr) due to local compression by turbulence. The first star forms in the isolated cloud at 2.7 Myr, but very few stars are formed until after 5 Myr where the cloud’s gravity finally overwhelms the decaying turbulence and begins to collapse. This leads to the global collapse of the isolated cloud. Without a fresh form of support from stellar feedback, the number of stars in the isolated cloud increases rapidly, reaching an efficiency of about 2% by 6 Myr.
The colliding clouds begin star formation earlier, starting at 2.0 Myr and 2.2 Myr for the 10 km s-1 and 20 km s-1 collision velocities respectively. The clouds begin their collision at 1 Myr for the 10 km s-1 and 0.8 Myr for the 20 km s-1 cases, so star formation begins about 1 Myr after the shocked interface begins to form. Sink particles form rapidly in the dense shock front, producing a significantly higher star formation rate (the gradient of the SFE curve) than for the isolated case. The collision at 20 km s-1 produces a denser shock front than the slower collision, increasing the stellar production rate still further. At 4 Myr, the 10 km s-1 collision case is forming stars 18 times faster than for the isolated cloud, while the 20 km s-1 collision case is 53 times as rapid. This demonstrates how sensitive the star formation rate is to gas compression (Federrath & Klessen, 2012; Federrath et al., 2016). By 6 Myr, the colliding clouds have a SFE of between 10 - 20%; a factor of 10 higher than the isolated cloud.
Observations of GMCs suggest that the SFE should be of order a few percent (for example, see Table 3 in Federrath & Klessen (2013), which lists the SFE for various clouds in the Milky Way.) This would initially appear to agree better with the isolated cloud than the collision cases. However, true GMCs are typically more extended structures than our idealised Bonnor-Ebert spheres. Real clouds are part of the Galaxy’s dynamic ISM and thus subject to turbulent perturbations and tidal interactions that create extended, elongated structures. A cloud collision is therefore likely to involve only part of the cloud. Examples of this can be seen in Fukui et al. (2017), who shows the observational maps of cloud collisions within the LMC or in the numerical simulations of Jin et al. (2017). Collisions are therefore likely to affect a smaller fraction of the cloud’s volume than in this idealised case, driving down the total SFE when averaged with more quiescent regions.
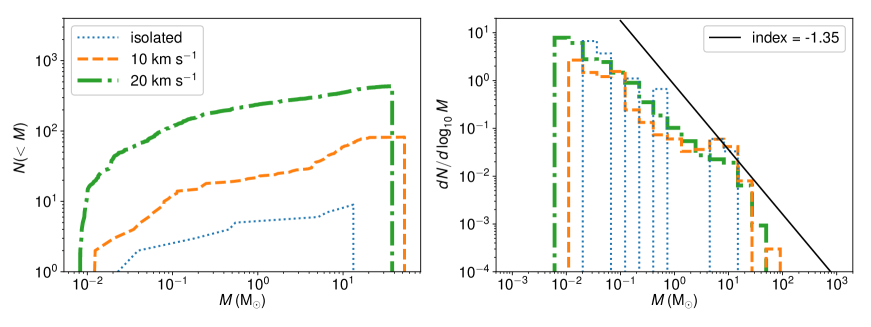
The resulting star formation can be seen in the cumulative mass in star particles shown in the left-hand panel of Figure 4 for the simulations without feedback by 4 Myr. The collisional simulations form more low mass stars and massive star clusters than the isolated case, confirming that turbulence in the collisional shock front also acts as kinetic support to favour the production of massive stars. The largest cluster formed in the isolated cloud is 13 M⊙, while the collision at 10 km s-1 yields a maximum cluster mass of 53 M⊙ and a slightly lower 38 M⊙ for the 20 km s-1. While the maximum mass is reduced in the faster collision compared to the slower interaction, the total stellar production is greater, with the 20 km s-1 creating around five times more sink particles than in the 10 km s-1 collision. The smaller size of the maximum mass star cluster is likely due to the faster shock front providing less time to accrete gas, a factor noted by Takahira et al. (2014) as the reason why steadily faster shocks do not form ever larger clumps. By contrast, the isolated cloud case created only 9 sink particles during the first 4 Myr, compared with 83 and 434 in the colliding runs.
The distribution of the stellar masses of the sink particles can be seen in the mass function in the right-hand panel of Figure 4 for the same runs. The black solid line in this figure shows a power-law relation with an index of , which is the prediction of the Salpeter IMF, described by for . Since our simulations really only resolve star clusters, the mass function we plot is best interpreted as a molecular core mass function and not as the stellar IMF. Despite significant differences in the total number of stars and the maximum cluster mass, both the isolated and colliding cloud runs show a similar gradient that is consistent with the slope of the Salpeter IMF. It is worth noting that the isolated cloud has only nine sink particles, so the distribution for this run is relatively scarce. However, the particles formed do appear to follow the same trend as for the colliding cases.
At the high-mass end, the colliding clouds both show extensions beyond the isolated case, indicating the effectiveness of forming high-mass stars during a collision. There is evidence in this region that the IMF may steepen. This fall-off likely corresponds to star formation that occurs only in the densest part of the shock interface.
3.3 The Effect of Stellar Feedback
While the cloud collision provides an external source of stirring to the GMC gas, the stars themselves will add energy to their surrounding medium. To explore this, we include photoionising feedback as described in Section 2 in the isolated cloud simulation and the collisional case at 10 km s-1 impact velocity.
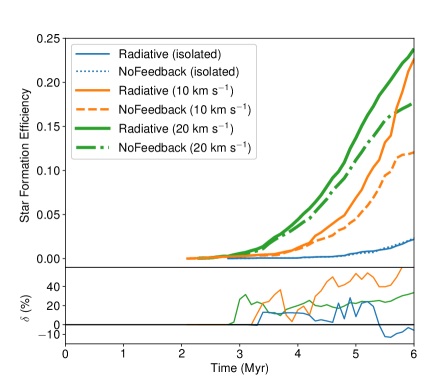
The evolution of the star formation efficiency when feedback is included is shown in Figure 5. The dashed and dotted lines show the same result for the non-feedback case as in Figure 3, with blue-dots showing the result for the isolated cloud and orange-dash and green-dot-dash for the 10 km s-1 and 20 km s-1 collisional case, respectively. The solid blue line shows the isolated cloud SFE when photoionising feedback is included, while the solid orange and green lines show the feedback results for the colliding clouds. The bottom panel of the figure shows the difference between the equivalent non-feedback and feedback runs, where is defined as %. A positive value of corresponds to feedback promoting the star formation in the cloud, while a negative value means that star formation is being suppressed.
In both the isolated and colliding cases, the effect of feedback is generally to promote star formation over the 6 Myr. This effect was previously seen in Shima et al. (2017) in cases where the feedback had a chance to act before the gas became so dense that the self-gravity dominated over the pressure from the feedback. There, the radiation heated the gas to suppress fragmentation and allowed the gas to be accreted to form more massive stars. This persisted until the cloud was dispersed by the feedback, leading to a subsequent drop in star formation.
In the isolated cloud, we repeat this effect. Feedback initially makes a positive difference and raises the SFE. As the dense clumps within the cloud begin to be dispersed around 5.5 Myr, the star formation drops compared to the non-feedback case were collapse continues unabated.
When feedback acts during the cloud collision, the effect is uniformly positive, with feedback aiding stellar production. This is from the photoionisation heating of the dense gas within the shocked collisional interface, preventing fragmentation and allowing still larger stars to form. This agrees qualitatively with the smaller-scale simulations of ionising feedback by Peters et al. (2010, 2012), who simulated collapsing molecular cores with radiative feedback and found that the heated gas boosted the Jeans mass to form massive star clusters. While the feedback there could be both positive and negative, it was primarily positive when averaged over longer timescales. This boost in stellar production is stronger in the 10 km s-1 case than in the faster 20 km s-1 collision. As we will see below, this is due to the speed of the shock front compared to that of the expanding HII region.
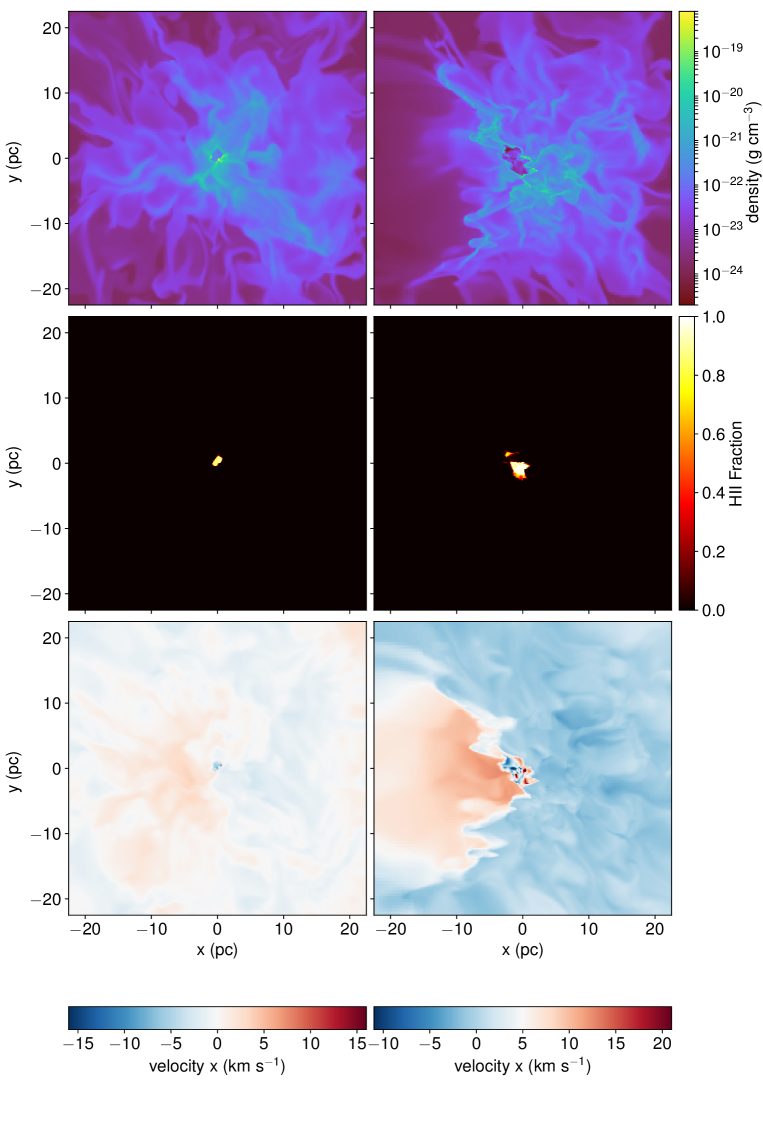
Exactly why the feedback can have different effects on the cloud SFE can be seen visually in a close-up image of the gas around the most massive sink particle a few Myr after it has begun to emit radiation in Figure 6. The left-hand column of images shows the gas around the massive sink in the isolated cloud case, while the right-hand images shown the collisional case for a velocity of 10 km s-1. In the middle row of images showing the HII fraction (HII mass divided by hydrogen mass), a bubble of hot ionised gas can be seen expanding around the photoionising sink. The total HII mass is 0.003 M⊙ in the isolated cloud case and 6.2 M⊙ in the collisional case. The top row shows the gas density in a slice at the sink’s position, while the bottom row shows the velocity in the direction of the collision. In the collisional case, the velocity axis has been shifted to match the shock propagation speed. As the formation of the sink particles differ between simulations, the isolated case shows the most massive sink forming at 5.2 Myr, while the collisional case is at 3.7 Myr.
The isolated cloud forms its massive stars close to the cloud center, as gas is collapsing towards this region as the initial turbulent support decays. As the massive star cluster forms and begins to photoionise, the radiation heats the surrounding layers of gas and prevents further fragmentation in this region. This suppresses the formation of smaller stars, but allows the gas to be accreted onto the massive star cluster. The mass of the star clusters forming in the simulation therefore increases, as in Shima et al. (2017). Eventually, the heat from the centrally concentrated radiating stars counters the gravitational collapse and further accretion and the star formation begins to slow. This results in the negative effect we see in Figure 5 around 5.5 Myr.
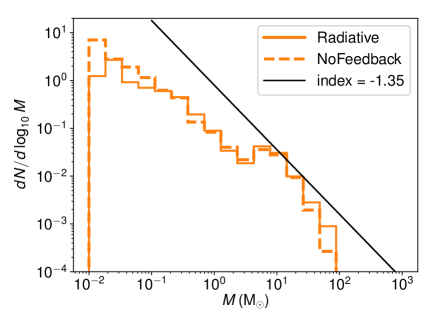
In the case of the colliding clouds, the gas structure is markedly different. The first massive sinks form in the shock generated at the collision interface. As the shock continues to move forward, the HII region expands behind and in front of the shock front. The shock propagation speed for the collision at 10 km s-1 is approximately 5 km s-1 through the cloud, but with a thermal temperature of 104 K, the maximum expanding velocity due to the pressure gradient is around 10 km s-1 corresponding to the sound speed within the HII region. This allows the HII region to stay within the dense gas piling onto the shock front, continuing to suppress fragmentation in this very dense region and allowing the gas to be accreted onto the massive sinks. Since the high density of the shock front is harder to dispel than the gas in the isolated case, feedback continues to have a positive impact on the SFE. This can be seen quantitatively in the mass function for the run in Figure 7. The orange solid line corresponds to the simulation with radiation feedback, while the dashed line is for the non-feedback case for the cloud collision at 10 km s-1, both taken at 4.5 Myr. The photoionisation results in more high-mass star particles being created as fragmentation into smaller stars is suppressed. While the trend for the stellar mass function for the faster cloud collision at 20 km s-1 is the same, the overall effect is more modest. In the bottom panel showing the net effect of feedback on Figure 5, the green line is below the orange line. This is again due to the swiftness of the shock front passing through the cloud. With the higher propagation speed, the expanding HII region is outstripped and can have less effect on the star-forming gas. As we have seen, the reduced time of the shock front within the cloud also lowers the maximum mass of the sinks, additionally lowering the impact of the feedback.
Previous simulations have suggested that expanding HII regions could still promote the formation of smaller stars in a ‘collect and collapse’ scheme, where stars form around the edge of the expanding bubble. However, as in Shima et al. (2017), we find no evidence of that mechanism in play within our simulations, neither within the isolated nor the collisional case.
4 Conclusions
We compared stars forming in idealised isolated and colliding cloud cases at two different velocities with a sink particle method for forming stellar clusters and also emitting photoionising radiation.
The effect of the cloud collision was to increase the total stellar mass formed and also the maximum size of the star cluster born in the simulation, compared with the isolated cloud case. The collision created a dense shock front and compressed the gas within the colliding clouds. The added density provided a larger reservoir of gas for star formation, while the compressive turbulence promoted the production of more high mass stars. The higher collision velocity increased the total stellar mass due to the production of a denser shock front, but the slower velocity speed produced the highest individual cluster mass and strongest response to feedback, due to the reduced speed increasing the time for the sink particle to accrete.
The overall gradient of the stellar mass distribution was not strongly different between the isolated and colliding cases and remains consistent with a Salpeter IMF for star clusters up to 10 M⊙. At the higher mass clusters achieved during the cloud collision simulations, the power-law relation appears to steepen. This may suggest that the biggest stellar clusters can only be formed during a collision between clouds and not through regular gravitational collapse.
The addition of photoionising feedback affected the isolated and colliding clouds differently, due to differences in the structure of the gas. In both cases, the radiation initially suppressed fragmentation, throttling the production of smaller stars but allowing more gas to be accreted onto the larger star clusters. This created a positive impact on the SFE. In the isolated case, radiation from the centrally concentrated star formation began to counter the gravitational collapse after several Myr. This ultimately slowed the production of stars and throttled the cloud SFE. In the collisional case, the expanding HII region from the massive star clusters was able to keep pace with the shock front as it travelled through the cloud. The particularly dense gas inside the shock front was not dispersed by the radiation, which continued to have a positive impact on the SFE.
The overall effect of the collision is therefore to boost the production of high-mass stars. Providing the shock speed is comparable to the sound speed within the resulting HII regions, feedback can be a positive force on star formation triggered in collisions, while it ultimately curtails star formation in the less dense isolated system.
Numerical computations were carried out on Cray XC30 at the Center for Computational Astrophysics (CfCA) of the National Astronomical Observatory of Japan. The authors would like to thank the YT development team for many helpful analysis support (Turk et al., 2011). EJT was partially supported by JSPS Grant-in-Aid for Scientific Research Number 15K0514. C.F. acknowledges funding provided by the Australian Research Council’s Discovery Projects (grants DP130102078 and DP150104329). C.F. thanks the Juelich Supercomputing Centre (grant hhd20), the Leibniz Rechenzentrum and the Gauss Centre for Supercomputing (grants pr32lo, pr48pi and GCS Large-scale project 10391), the Partnership for Advanced Computing in Europe (PRACE grant pr89mu), and the Australian National Computational Infrastructure (grant ek9), as well as the Pawsey Supercomputing Centre with funding from the Australian Government and the Government of Western Australia.
References
- Abel & Wandelt (2002) Abel, T., & Wandelt, B. D. 2002, MNRAS, 330, L53
- Alves et al. (2001) Alves, J. F., Lada, C. J., & Lada, E. A. 2001, Nature, 409, 159
- Arzoumanian et al. (2011) Arzoumanian, D., André, P., Didelon, P., et al. 2011, A&A, 529, L6
- Balfour et al. (2015) Balfour, S. K., Whitworth, A. P., Hubber, D. A., & Jaffa, S. E. 2015, MNRAS, 453, 2471
- Balfour et al. (2017) Balfour, S. K., Whitworth, A. P., & Hubber, D. A. 2017, MNRAS, 465, 3483
- Beaumont et al. (2013) Beaumont, C. N., Offner, S. S. R., Shetty, R., Glover, S. C. O., & Goodman, A. A. 2013, ApJ, 777, 173
- Bonnor (1956) Bonnor, W. B. 1956, MNRAS, 116, 351
- Bryan et al. (2014) Bryan, G. L., Norman, M. L., O’Shea, B. W., et al. 2014, ApJS, 211, 19
- Chabrier (2005) Chabrier, G. 2005, The Initial Mass Function 50 Years Later, 327, 41
- Chomiuk & Povich (2011) Chomiuk, L., & Povich, M. S. 2011, AJ, 142, 197
- Dale et al. (2014) Dale, J. E., Ngoumou, J., Ercolano, B., & Bonnell, I. A. 2014, MNRAS, 442, 694
- Dobbs et al. (2011) Dobbs, C. L., Burkert, A., & Pringle, J. E. 2011, MNRAS, 413, 2935
- Ginsburg et al. (2012) Ginsburg, A., Bressert, E., Bally, J., & Battersby, C. 2012, ApJ, 758, L29
- Glover et al. (2010) Glover, S. C. O., Federrath, C., Mac Low, M.-M., & Klessen, R. S. 2010, MNRAS, 404, 2
- Górski et al. (2005) Górski, K. M., Hivon, E., Banday, A. J., et al. 2005, ApJ, 622, 759
- Harper-Clark & Murray (2009) Harper-Clark, E., & Murray, N. 2009, ApJ, 693, 1696
- Hennebelle & Chabrier (2009) Hennebelle, P., & Chabrier, G. 2009, ApJ, 702, 1428
- Jin et al. (2017) Jin, K., Salim, D. M., Federrath, C., et al. 2017, arXiv:1703.09709
- Kainulainen et al. (2014) Kainulainen, J., Federrath, C., & Henning, T. 2014, Science, 344, 183
- Kennicutt (1998) Kennicutt, R. C., Jr. 1998, ApJ, 498, 541
- Klessen (2000) Klessen, R. S. 2000, ApJ, 535, 869
- Koda et al. (2009) Koda, J., Scoville, N., Sawada, T., et al. 2009, ApJ, 700, L132
- Kritsuk et al. (2011) Kritsuk, A. G., Norman, M. L., & Wagner, R. 2011, ApJ, 727, L20
- Krumholz et al. (2010) Krumholz, M. R., Cunningham, A. J., Klein, R. I., & McKee, C. F. 2010, ApJ, 713, 1120
- Larson (1981) Larson, R. B. 1981, MNRAS, 194, 809
- Roman-Duval et al. (2010) Roman-Duval J., Jackson J. M., Heyer M., Rathborne J., Simon R., 2010, ApJ, 723, 492
- Federrath et al. (2008) Federrath, C., Klessen, R. S., & Schmidt, W. 2008, ApJ, 688, L79
- Federrath et al. (2010) Federrath, C., Banerjee, R., Clark, P. C., & Klessen, R. S. 2010, ApJ, 713, 269
- Federrath et al. (2010) Federrath, C., Roman-Duval, J., Klessen, R. S., Schmidt, W., & Mac Low, M.-M. 2010, A&A, 512, A81
- Federrath et al. (2011) Federrath, C., Sur, S., Schleicher, D. R. G., Banerjee, R., & Klessen, R. S. 2011, ApJ, 731, 62
- Federrath & Klessen (2012) Federrath, C., & Klessen, R. S. 2012, ApJ, 761, 156
- Federrath (2013) Federrath, C. 2013, MNRAS, 436, 1245
- Federrath & Klessen (2013) Federrath, C., & Klessen, R. S. 2013, ApJ, 763, 51
- Federrath (2016) Federrath, C. 2016, MNRAS, 457, 375
- Federrath et al. (2016) Federrath, C., Rathborne, J. M., Longmore, S. N., et al. 2016, ApJ, 832, 143
- Federrath et al. (2017) Federrath, C., Rathborne, J. M., Longmore, S. N., et al. 2017, The Multi-Messenger Astrophysics of the Galactic Centre, 322, 123
- Ferland et al. (1998) Ferland, G. J., Korista, K. T., Verner, D. A., et al. 1998, PASP, 110, 761
- Fujimoto et al. (2014b) Fujimoto, Y., Tasker, E. J., & Habe, A. 2014, MNRAS, 445, L65
- Fujimoto et al. (2014) Fujimoto Y., Tasker E. J., Wakayama M., Habe A., 2014, MNRAS, 439, 936
- Fukui et al. (2016) Fukui, Y., Torii, K., Ohama, A., et al. 2016, ApJ, 820, 26
- Fukui et al. (2017) Fukui, Y., Torii, K., Hattori, Y., et al. 2017, arXiv:1701.04669
- Furukawa et al. (2009) Furukawa, N., Dawson, J. R., Ohama, A., et al. 2009, ApJ, 696, L115
- Lada C. J., Lombaridi M. & Alves J. F. (2010) Lada C. J., Lombaridi M. & Alves J. F. 2010, ApJ, 724, 687
- Ohama et al. (2010) Ohama, A., Dawson, J. R., Furukawa, N., et al. 2010, ApJ, 709, 975
- Mac Low et al. (1998) Mac Low, M.-M., Klessen, R. S., Burkert, A., & Smith, M. D. 1998, Physical Review Letters, 80, 2754
- Meidt et al. (2013) Meidt, S. E., Schinnerer, E., García-Burillo, S., et al. 2013, ApJ, 779, 45
- Momose et al. (2010) Momose, R., Okumura, S. K., Koda, J., & Sawada, T. 2010, ApJ, 721, 383
- Pan et al. (2016) Pan, H.-A., Fujimoto, Y., Tasker, E. J., et al. 2016, MNRAS, 458, 2443
- Pan et al. (2015) Pan, H.-A., Fujimoto, Y., Tasker, E. J., et al. 2015, MNRAS, 453, 3082
- Peters et al. (2010) Peters, T., Banerjee, R., Klessen, R. S., et al. 2010, ApJ, 711, 1017
- Peters et al. (2012) Peters, T., Klaassen, P. D., Mac Low, M.-M., Klessen, R. S., & Banerjee, R. 2012, ApJ, 760, 91
- Schaerer (2003) Schaerer, D. 2003, A&A, 397, 527
- Schneider et al. (2013) Schneider, N., André, P., Könyves, V., et al. 2013, ApJ, 766, L17
- Shima et al. (2017) Shima, K., Tasker, E. J., & Habe, A. 2017, MNRAS, 467, 512
- Smith et al. (2008) Smith, B., Sigurdsson, S., & Abel, T. 2008, MNRAS, 385, 1443
- Stone & Norman (1992) Stone, J. M., & Norman, M. L. 1992, ApJS, 80, 753
- Takahira et al. (2014) Takahira, K., Tasker, E. J., & Habe, A. 2014, ApJ, 792, 63
- Tan (2000) Tan, J. C. 2000, ApJ, 536, 173
- Tasker et al. (2015) Tasker, E. J., Wadsley, J., & Pudritz, R. 2015, ApJ, 801, 33
- Tasker (2011) Tasker, E. J. 2011, ApJ, 730, 11
- Turk et al. (2011) Turk, M. J., Smith, B. D., Oishi, J. S., et al. 2011, ApJS, 192, 9
- Torii et al. (2015) Torii, K., Hasegawa, K., Hattori, Y., et al. 2015, ApJ, 806, 7
- Truelove et al. (1997) Truelove, J. K., Klein, R. I., McKee, C. F., et al. 1997, ApJ, 489, L179
- Wise & Abel (2011) Wise, J. H., & Abel, T. 2011, MNRAS, 414, 3458
- Wise et al. (2012) Wise, J. H., Abel, T., Turk, M. J., Norman, M. L., & Smith, B. D. 2012, MNRAS, 427, 311
- Wu et al. (2017) Wu, B., Tan, J. C., Christie, D., et al. 2017, arXiv:1702.08117