Stellar Photometric Structures of the Host Galaxies of Nearby Type 1 Active Galactic Nuclei11affiliation: Based on observations made with the NASA/ESA Hubble Space Telescope, obtained from the Data Archive at the Space Telescope Science Institute, which is operated by the Association of Universities for Research in Astronomy (AURA), Inc., under NASA contract NAS5-26555. These data are associated with program AR-12133 and AR-12818.
Abstract
We present detailed image analysis of rest-frame optical images of 235 low-redshift ( 0.35) type 1 active galactic nuclei (AGNs) observed with the Hubble Space Telescope. The high-resolution images enable us to perform rigorous two-dimensional image modeling to decouple the luminous central point source from the host galaxy, which, when warranted, is further decomposed into its principal structural components (bulge, bar, and disk). In many cases, care must be taken to account for structural complexities such as spiral arms, tidal features, and overlapping or interacting companion galaxies. We employ Fourier modes to characterize the degree of asymmetry of the light distribution of the stars, as a quantitative measure of morphological distortion due to interactions or mergers. We examine the dependence of the physical parameters of the host galaxies on the properties of the AGNs, namely radio-loudness and the width of the broad emission lines. In accordance with previous studies, narrow-line (H FWHM km s-1) type 1 AGNs, in contrast to their broad-line (H FWHM km s-1) counterparts, are preferentially hosted in later type, lower luminosity galaxies, which have a higher incidence of pseudo-bulges, are more frequently barred, and are less morphologically disturbed. This suggests narrow-line type 1 AGNs experienced a more quiescent evolutionary history driven primarily by internal secular evolution instead of external dynamical perturbations. The fraction of AGN hosts showing merger signatures is larger for more luminous sources. Radio-loud AGNs generally preferentially live in earlier type (bulge-dominated), more massive hosts, although a minority of them appears to contain a significant disk component. We do not find convincing evidence for enhanced merger signatures in the radio-loud population.
Subject headings:
galaxies: active — galaxies: bulges — galaxies: fundamental parameters — galaxies: photometry — quasars: general1. Introduction
Active galactic nuclei (AGNs), being some of the most energetic sources in the Universe, are powered by accretion onto supermassive black holes (BHs) at the centers of galaxies. The discoveries of tight correlations between BH mass and large-scale properties of their host galaxies (Kormendy & Richstone 1995; Magorrian et al. 1998; Ferrarese & Merritt 2000; Gebhardt et al. 2000) point to the possibility that the growth of BHs and the evolution of their surrounding host galaxy are closely related. The underlying causes of this apparent coevolution, however, are still debated (Kormendy & Ho 2013). One hypothesis is that AGN-driven feedback may cause BHs and galaxies to grow together in lock-step (e.g., Kauffmann & Haehnelt 2000; Hopkins et al. 2006). If so, fundamental questions of interest to address are how BHs and their host galaxies relate and interact, and what produces the different types of AGNs.
Within this context, the detailed stellar photometric properties of AGN host galaxies help to establish when and why supermassive BHs are active or inactive, and potentially the feedback consequences that AGNs may have on the hosts. While a significant number of imaging datasets of type 1 (broad-line) AGN host galaxies now exist at low to intermediate redshifts, obtained by various large-scale Hubble Space Telescope (HST; e.g., Giavalisco et al. 2004, Rix et al. 2004, Scoville et al. 2007, Koekemoer et al. 2011) and ground-based (e.g., Alam et al. 2015) surveys, the sample of well-studied type 1 AGN host galaxies is still small. This, in part, is a result of the fact that disentangling the luminous central AGN robustly still poses a technical challenge, even with the resolution of HST (e.g., McLeod & Rieke 1995b; Bahcall et al. 1997; McLure et al. 1999; Dunlop et al. 2003). Both the high contrast between the bright AGN nucleus and the host and variations in the HST point-spread function (PSF) introduce systematic uncertainties in photometric measurements of host galaxies (Kim et al. 2008a). Thus, a detailed, quantitative study of a large sample of hosts of type 1 AGNs is still largely lacking.
Although the host galaxies of type 2 AGNs are easier to study because they are not overwhelmed by the luminous central point source present in type 1 AGNs, key physical properties, such as the BH mass or even intrinsic luminosity, cannot be reliably measured in these systems. By contrast, BH masses in type 1 AGNs can be estimated with reasonable accuracy from their broad emission lines ( dex; e.g., Kaspi et al. 2000; Ho & Kim 2015), and we can obtain their
luminosities (and hence Eddington ratios) rather straightforwardly. The AGN phenomenon and the properties of AGN host galaxies are closely related to BH mass and Eddington ratio. For example, radio-loudness and width of broad emission lines appear to be closely connected to BH mass, Eddington ratio, and the morphological types of the host galaxies (e.g., Pounds et al. 1995; Crenshaw et al. 2003; Best et al. 2005; Sikora et al. 2007). Thus, investigating a comprehensive sample of host galaxies of type 1 AGN is essential to understand the coevolution of BHs and their host galaxies.
In this paper, we analyze images of type 1 AGNs obtained with the HST, using the largest sample to date for this purpose. We perform a careful decomposition of AGN host galaxies into their principal structural components (e.g., bulge, bar, disk), at the same time allowing for, if warranted, complexities due to spiral arms, tidal arms, and other distortions due to tidal interactions and mergers. We derive detailed structural parameters (e.g., surface brightness, size, profile shape), bulge-to-total light ratio, and we quantitatively measure asymmetries using Fourier modes.
A number of past studies have utilized HST images to investigate sizable numbers of nearby type 1 AGNs (e.g., Schade et al. 2000; Dunlop et al. 2003; Hamilton et al. 2008). Most of these efforts have focused only on specific categories of sources (e.g., luminous QSOs and X-ray selected AGNs). Here we place no such restrictions, aiming to study as wide a range of properties as possible, only requiring that the sample selection be restricted to type 1 AGNs so that BH masses can be estimated. In addition to sample size and broad representation of AGN properties, our study utilizes a uniform method of analysis, pays close attention to the treatment of the PSF, and, for the first time, systematically treats the many structural complexities inherent to many AGN hosts galaxies. Our large database has many applications for a wide variety of statistical studies of AGN host galaxies. Here we focus on three issues.
It is well-known that radio-loud AGNs are preferentially hosted by massive, early-type galaxies (e.g., Matthews et al. 1964; Best et al. 2005; Floyd et al. 2010). However, this finding has not been confirmed with a large sample of type 1 AGNs (Dunlop et al. 2003). Meanwhile, it is still under debate whether radio-loudness is related to galaxy merging or tidal interactions (Best et al. 2005; but see Heckman 1983; Ramos Almeida et al. 2012). We revisit these issues by investigating how AGN radio-loudness correlates with host galaxy properties.
There is mounting evidence that the host galaxies of narrow-line Seyfert 1 (NLS1; FWHM (H) km s-1) sources differ statistically from those of the broad-line type 1 (BLS1; FWHM (H) km s-1) class, in the sense that NLS1s are more likely to be associated with barred galaxies and have more prominent star formation activity (e.g., Crenshaw et al. 2003; Deo et al. 2006; Sani et al. 2010). In addition, the fraction of pseudo-bulges111 Kormendy & Kennicutt (2004) describe pseudo-bulges as the bulge-like central concentration of stars in disk galaxies formed through internal secular evolution, to be contrasted with classical bulges, which experienced major mergers, similar to elliptical galaxies. has been reported to be significantly higher in NLS1s compared to BLS1s (Orban de Xivry et al. 2011). This might indicate that the AGN triggering mechanism of NLS1s, perhaps reflecting the predominance of secular evolution of their host galaxies, is distinctive from that of BLS1s. This work adopts the cosmological parameters: km s-1 Mpc-1, , and (Planck Collaboration et al. 2016). All magnitudes are in the Vega magnitude system (Bessel 2005).
2. Data Selection
The ultimate goal of our series of papers is to understand how the properties of nearby AGNs are related to the structural and morphological characteristics of their host galaxies (Kim et al. 2007, 2008a, 2008b), using as the primary tool high-resolution HST images. For that purpose, we choose a sample of type 1 AGNs that has usable archival HST images and sufficient spectroscopic information to estimate BH masses (; Section 3.3).
We began by searching for all objects that are known to be AGNs of any type in the HST archives. As of June 2012, we found candidates. After a careful literature search, we discarded objects that are not known to have broad emission lines (i.e. type 2 AGNs or narrow-line radio galaxies; objects) or that have redshifts ( objects). We limit the sample to to avoid complications from cosmic evolution of the BH-host relations, which has been reported above this redshift (Treu et al. 2007; Bennert et al. 2010). The spatial resolution of the HST images corresponds to kpc at this redshift limit (), which is sufficient to resolve the bulges of host galaxies. These cuts resulted in an initial sample of nearby type 1 AGNs. We then inspected the list to retain only those objects that have reliable spectroscopic data, either from the literature or from our own observations (Ho & Kim 2009).
Of most relevance for our goal of estimating is the availability of a robust measurement of the velocity widths of the broad emission lines222Because broad H and H are often blended with other narrow emission lines and Fe II multiplets, accurate measurement of their line widths requires spectra of relatively high S/N. The typical uncertainty of the FWHM measurements is ; for 6% of the sample, the uncertainty is up to 20%. This further reduced the sample to objects. To facilitate comparison of our results with previous studies, we restrict our attention to optical images taken as closely as possible to the , , or bands333Roughly 40 objects have HST images in multiple optical filters. For this study we only consider the deepest image. A forthcoming paper will use the multiple filters to study the colors of the host galaxies.. Since these AGNs are at low redshifts, -corrections will be minimal. We choose all suitably deep Wide-Field Planetary Camera 2 (WFPC2) and Advanced Camera for Surveys (ACS) images, guided by the signal-to-noise ratio (S/N) requirements given in Kim et al. (2008a). 35 objects are rejected because they only have UV or Bband images, or because their S/N is smaller than 250.444 Kim et al. (2008a) showed that accurate measurement of the host brightness requires especially if the host galaxy is fainter than the nucleus.
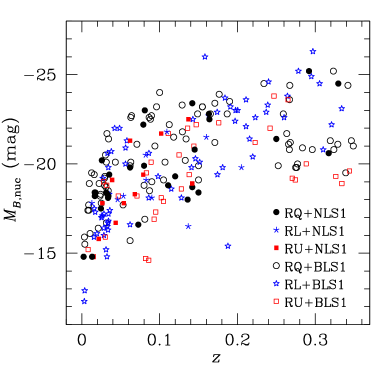
The final sample, summarized in Table 1 and Figures 1–2, consists of 235 objects. The sample contains both quasars and lower-luminosity Seyfert 1 galaxies. We note that the sample is selected in a heterogeneous manner. Thus, it is worthwhile to briefly summarize the characteristics of the objects. The HST images of the final sample were obtained through 28 different HST programs. While most of the objects are identified as AGNs from optical color selection (e.g., Bahcall et al. 1994; Letawe et al. 2008; Floyd et al. 2004), of the sample was selected through X-ray surveys (e.g., Schade et al. 2000). Also, the fraction of radio-loud AGNs in our sample () is significantly higher than that of other typical AGN samples (; e.g., Kellermann et al. 1989; Ivezić et al. 2002). This is a consequence of HST programs specifically devoted to radio-selected AGNs (e.g., McLure et al. 1999; Dunlop et al. 2003; de Koff et al. 1996). Approximately of the sample are NLS1s, comparable to optically selected AGN samples (; Zhou et al. 2006). Finally, a significant fraction () of the sample comes from the large HST survey of nearby AGNs by Malkan et al. (1998). For the sake of completeness, the objects analyzed in Kim et al. (2008b) are also included (45 objects).
The majority of the sample () are observed with WFPC2. WFPC2 is composed of three wide-field cameras (WF) and one planetary camera (PC). The field-of-view is 13 with a pixel scale of 01 for the WF and 34′′ with with a pixel scale of 0046 for the PC. Among the 167 sources with WFPC2 data, we use PC images for 80, WF images for 40, and full WFPC2 mosaic images for 47. The rest of the sample, except for one object, was observed with ACS, which comprises two optical cameras: 39 used the High Resolution Camera (HRC) and 28 used the Wide Field Camera (WFC). The HRC has a high angular resolution (0027 pixel-1) but a narrow field-of-view (29′′26′′), while the WFC has relatively high throughput and covers a wide field-of-view of 202′′ with 0049 pixels. Only one object (Mrk 1048) was observed with Wide-Field Planetary Camera 1 (WF/PC), one of the first-generation instruments that was replaced with WFPC2 in 1993. It contains four WF chips and four PC chips, whose characteristics are similar to those on WFPC2.
The sample has been observed with various broad-band and medium-band optical filters, such as F547M, F550M, F555W, F606W, F625W, F675W, F702W, F785LP, F791W, and F814W, which are roughly equivalent to conventional , , and filters. A total of 124, 45, and 66 targets were observed in the -like (F547M, F550M, F555W, F606W, and F625W), -like (F675W and F702W), and -like (F785LP, F791W, and F814W) filters, respectively. The exposure time varies between s and s, with a median value of s. These depths reach a surface brightness limit of 24–28 mag arcsec-2 over an area of 1 arcsec2. The S/N within such an area in the center ranges from 250 to a few thousand.
![[Uncaptioned image]](/html/1710.02194/assets/x3.png)
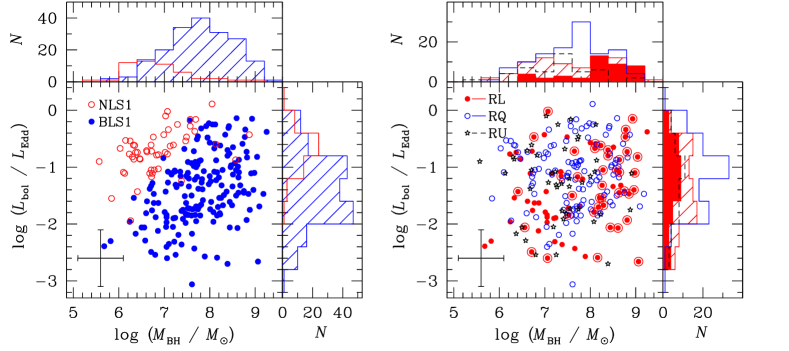
As illustrated in Figure 2, the sample spans a wide range in , from to , and /, from 0.001 to 1 (see §5.1 and §5.2). We assemble measurements of FWHM for the broad component of either H or H, taken either from literature sources we deem to be sufficiently reliable, or directly measured by ourselves from our own optical spectra. Following common practice, we classify the objects according to the FWHM of their broad emission lines: 184 objects qualify as BLS1s and 51 as NLS1s. We further consider the radio brightness of the objects, using published radio flux density measurements from the literature. As the literature data are quite heterogeneous in terms of angular resolution, which ranges from a few arcseconds to 6′, some care is required to assemble measurements that pertain only to the AGN, especially for more nearby Seyferts wherein host galaxy contamination can be a serious issue (Ho & Peng 2001). Moreover, the published measurements were taken at various wavelengths. We homogenize the literature data by converting all flux densities to 6 cm assuming a radio spectral index of (Ho & Ulvestad 2001). We include upper limits from FIRST (Becker et al. 1995), if available.
The monochromatic flux density of the nucleus at rest-frame 4400 Å () and -band absolute magnitude () are derived directly from our work, using the decomposition of the HST images presented below. We apply a -correction using the composite quasar spectrum of Vanden Berk et al. (2001), and we correct for Galactic extinction using values of from Schlafly & Finkbeiner (2011) and the extinction curve of Cardelli et al. (1989).
We combine the radio and extinction-corrected optical flux densities to calculate the radio-loudness parameter, (Kellermann et al. 1989). Our sample has an unusually large fraction of radio-loud (RL; ) sources (33%; 78 objects) compared to radio-quiet (RQ; ) sources (48%; 113 objects); the radio status of 44 objects (19%) is unknown (RU) because either there is no measured upper limit available or the available upper limits are too high to determine the radio-loudness parameter (. The conventionally used radio-loudness threshold of might not be sufficiently restrictive. If, as advocated by Chiaberge & Marconi (2011), we adopt a higher value of , we are left with 41 extreme radio-loud (RL2) sources. The spatial resolution of the radio data ranges from 5′′ to 6′.
3. Data Reduction
Our data reduction procedure depends on the HST camera used. Basic data processing was performed by the standard HST pipeline. If there are multiple images with similar exposure time, we combine them to increase the S/N and to facilitate cosmic ray rejection. For cosmic ray removal in single images, we use the lacos_im task within IRAF555IRAF is distributed by the National Optical Astronomy Observatory, which is operated by the Association of Universities for Research in Astronomy (AURA) under cooperative agreement with the National Science Foundation. (van Dokkum 2001). Multiple dithered images taken with ACS are combined and corrected for distortion using the software MultiDrizzle (Koekemoer et al. 2002).
If the full WFPC2 frame is necessary in order to cover the entire galaxy (e.g., ESO 031G8), we combine the images of the four chips using the IRAF task wmosaic. The mosaiced images introduce gaps between the CCD chips; we mask out these gaps for the subsequent fits.
Due to the high contrast ratio between the nucleus and the underlying host galaxy, a long exposure commonly results in saturation of the galaxy center. If a short exposure is available in addition to the long exposure, we replace the saturated pixels and bleeding columns in the long exposure by scaling the corresponding pixels from the unsaturated image. If no short, unsaturated exposure is available, we simply mask the saturated pixels during the fit.
Accurate sky subtraction is of great importance to obtain accurate photometric measurements. We initially determine a rough estimate of the sky level using the IRAF task sky. For a more refined measurement, we perform aperture photometry of the source as a function of radius after subtracting the sky background and masking nearby sources. If the background is subtracted correctly, the cumulative flux eventually reaches a constant value at large radii. However, if the sky is overestimated, the aperture flux at large radius will decrease; the opposite trend will occur if the sky is underestimated. In order to find the best-fit sky value, we vary the sky manually until the curve of growth flattens at large radius. For images in highly crowded fields, for which the above method is inapplicable, we solve for the sky value during the image-fitting process (Section 4.1).
Our image decomposition requires a robust estimation of the PSF. Whenever possible we use empirical PSFs derived from bright, unsaturated stars observed using the same filter, camera, and position within the camera field-of-view. But such data are quite rare. In practice most of our analysis (189 out of 235 sources) is done using synthetic PSFs generated by TinyTim (Krist 1995), which have been shown to work reasonably well for our application (Kim et al. 2008a). The empirical or synthetic PSFs are reduced in the same manner as the science images so as to preserve the native shape of the PSF. For PSF stars observed with the ACS/WFC, we adopt IDL wrappers developed to account for the PSF changing during MultiDrizzle (Rhodes et al. 2006, 2007).
4. Image Decomposition
Our main goal is to measure the luminosity and structural parameters of the bulges of the host galaxies. To this end, a comprehensive global model must be constructed for the entire galaxy to properly disentangle the bulge from the active nucleus, which often can dominate the light, as well as other components that might be present, such as a disk and bar (Table 2).
The details of our technique for decomposing HST images of AGN host galaxies have been discussed in previous papers by our group. Our method is based on two-dimensional (2-D) parametric fitting using the code GALFIT (Peng et al. 2002). Kim et al. (2008a) performed extensive simulations to quantify the systematic uncertainties in measurements of bulge parameters under conditions that closely mimic HST images of AGN host galaxies. Based on these controlled experiments, we devised a strategy to minimize the error on the recovery of the photometric parameters of the bulge component. In brief, the dominant uncertainty on the bulge luminosity highly depends on how well we can reduce the errors due to mismatch of the PSF, which mainly arise due to its variation in time and position within the detector. Another important contribution to PSF mismatch comes from the fact that HST PSFs are undersampled. We showed that one can mitigate the effects of an undersampled PSF by broadening both the science image and the PSF image to critical sampling. We follow the same strategy in this study.
We use an updated version (3.0) of GALFIT (Peng et al. 2010). This code fits 2-D images with multi-component models, which include not only a nucleus and a bulge, but, especially in lower-mass systems, often also a disk and a bar. These additional components are crucial for obtaining a proper decomposition of the host galaxies (Greene et al. 2010; Jiang et al. 2011; Gao & Ho 2017). The new version of the code has new capabilities to fit non-axisymmetric features such as spiral arms, tidal features, and distortions due to tidal interactions. These higher-order components, too, can affect the accuracy of the bulge measurements.
As described in Kim et al. (2008b), we fit the nucleus with a point source model represented by the PSF and the host galaxy with the Sérsic (1968) profile
| (1) |
where is the surface brightness at radius , is the effective radius (within which half of the total light is contained), is the effective brightness at , is the Sérsic index, and is a constant coupled to . Depending on the complexity of each source, we fit it with one or more of the following models: (1) a single Sérsic component with free; (2) a single component with ; (3) a single component with ; (4) two components with for the disk and for the bulge; (5) two components with for the disk and free for the bulge; and (6) two components with free for the disk and the bulge. We always begin with the simplest single-component models and gradually increase in complexity if the residuals indicate that the source is more complex.
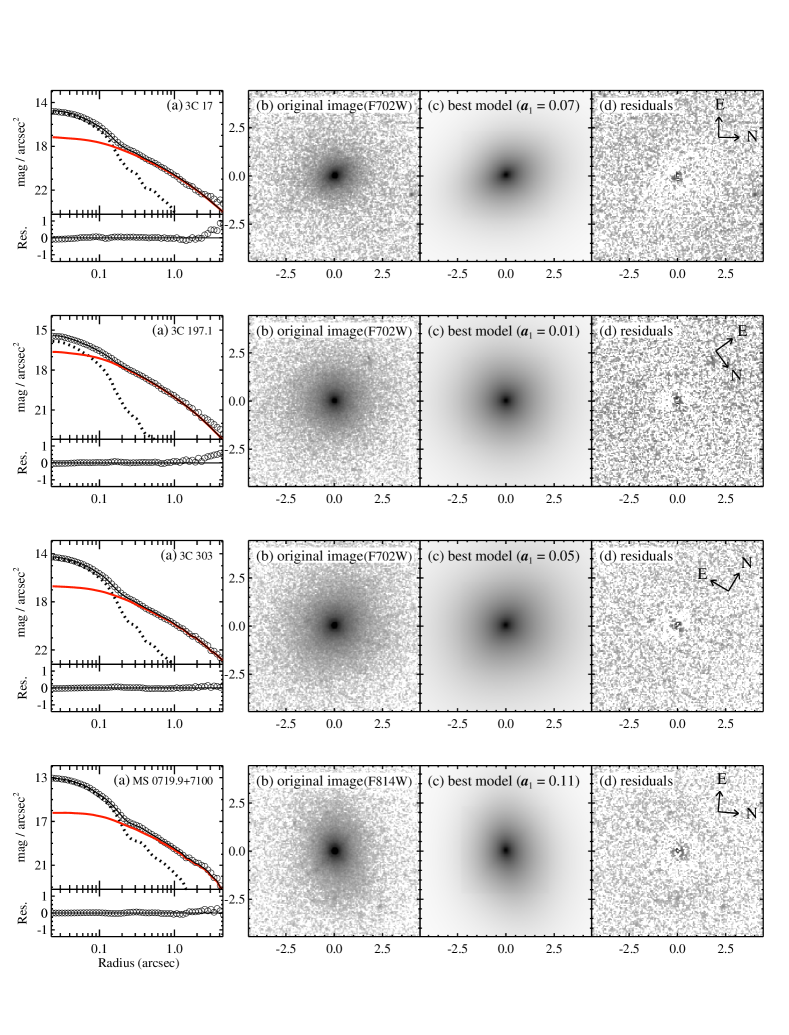
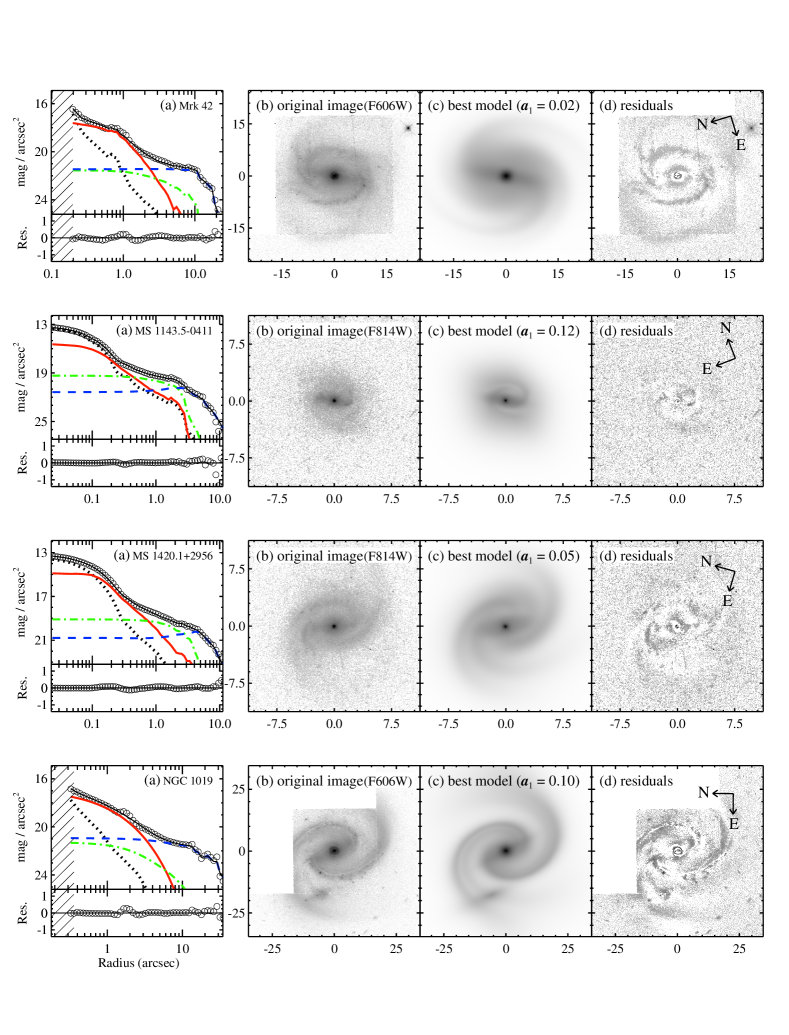
We allow to be fit as a free parameter in order to account for the possibility of pseudo-bulges (Kormendy & Kennicutt 2004), but in practice the solution is not always trustworthy because it can yield unphysical parameter values (e.g., , unrealistically small ). This often arises when the central nucleus is substantially brighter than the underlying galaxy, and small PSF mismatches in the center are being compensated by the free Sérsic component. Under these conditions, it is often better to fix the value of of the bulge component to minimize systematic uncertainty on the bulge luminosity (). Our tests suggest that values of in the range 2–5 have only a small effect on , and so for concreteness we adopt in these cases. Examples of fits with a single component for the host are shown in Figure 3.
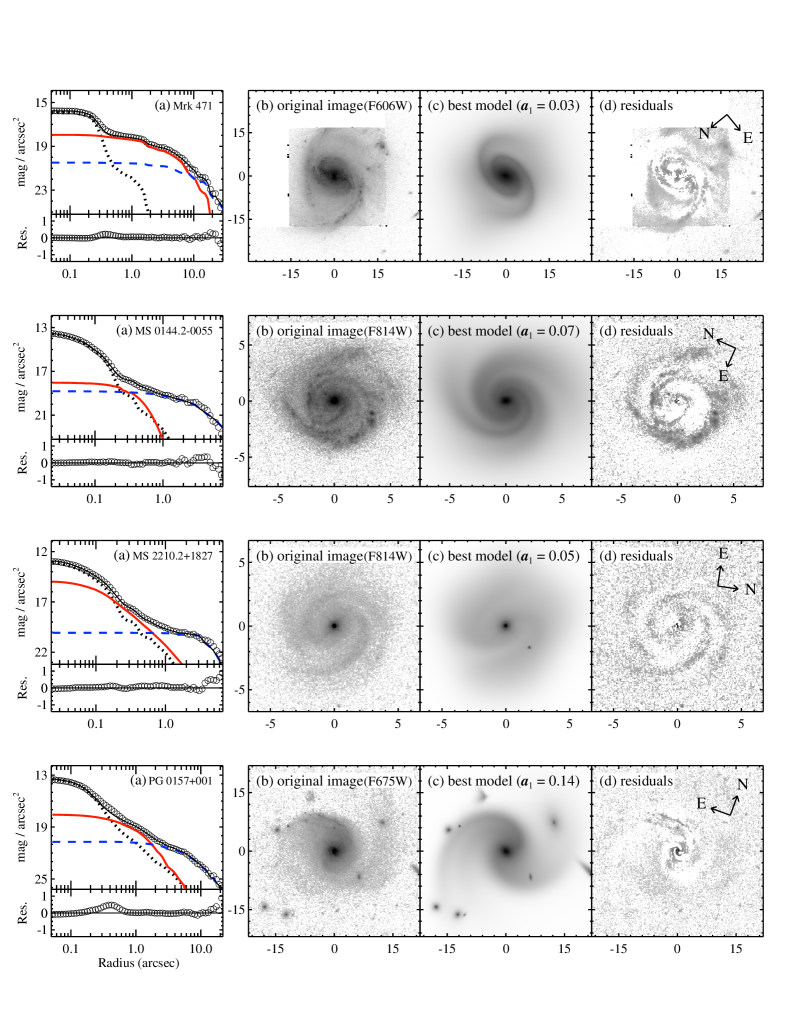
We model the host with two components—bulge plus a disk—if there is a clear indication of a disk or extended features in the original image or in the residual image. The choice between a single-component and a double-component fit is not always clear. We include an extra component only if it significantly improves the fit compared to a single component judged from the visual inspection of the residual image, or if it is clearly visible in the residual image (Figure 4).
The disk component, even if present, may be undetectable if the images are too shallow. Another complication arises from the fact that the fits are not always unique. While a single bulge may adequately fit the host, in some cases we cannot rule out the possibility that a disk component can also be accommodated. Following the methodology of Kim et al. (2008b), we derive upper limits for a disk component in objects for which none is detected or required by simulating a disk on the science image. We constrain the brightness and scale length of an exponential disk using the known relation between bulge-to-total light ratio () and the ratio of bulge to observed in nearby early-type disk galaxies (de Jong et al. 2004). We generate artificial images comprised of a model bulge and disk with different , add noise to match the S/N of the object in question, and then attempt to recover the two components with our fitting procedure. The upper limit on the disk contribution is set by the minimum disk brightness below which we fail to recover it.
A significant fraction of the sample shows clear evidence of spiral arms (Figure 4) and bars (Figure 5). The latest version of GALFIT has the ability to model these features (Peng et al. 2010). The code creates spiral structure by a hyperbolic tangent rotation function plus high-order Fourier modes. Bars are represented by a Gaussian-like Sérsic profile (; Freeman 1966; de Jong 1996). When both a bar and spiral arms are present simultaneously through visual inspection of the HST images, and the two features appear to have clearly distinct profiles (e.g., different axis ratio, discontinuity in their boundary), we use a truncation function to create a composite model that has a truncated inner profile and a truncated outer profile. The truncated profile is represented by:
| (2) |
where and represent the original light profile for the inner and outer regions, respectively, is the break radius, and is the softening length. The inner truncation function tapers the light profile in the core, whereas the outer truncation function tapers the light profile in the wings. At , the surface brightness of the truncated profile is 99% of that in the original profile. The surface brightness is 1% of the original at for the inner profile and at for the outer profile. We can also fit an outer ring by using solely an outer profile with an inner truncation function (see, e.g., MS 1545.3+0305 in Figure 11). A host galaxy is identified to have a bar if the fitting result improves significantly with the addition of the bar component, judged from the visual inspection of the residual image, and the fitted bar is physically reliable ().
As in Kim et al. (2008b), we use Fourier components to quantify the degree of asymmetry of the hosts. The Fourier mode, which describes deviations of the original radial profile in the azimuthal direction, is defined as
| (3) |
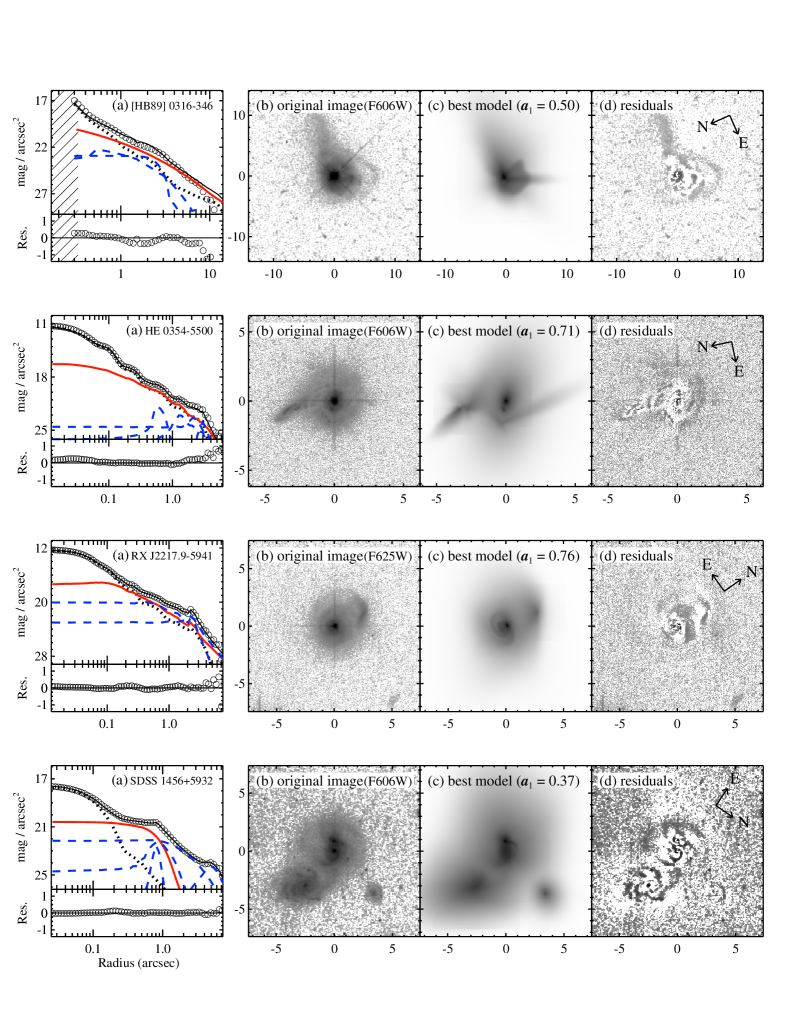
where is the shape of the original ellipse in the radial coordinate, is the amplitude of mode , is the position angle of the ellipse, and is the relative alignment of mode relative to . The first () mode represents lopsidedness (how bright one side is compared to the other side) in the galaxy. Thus, the amplitude of the mode can be used to gauge the degree of asymmetry of the galaxy (Peng et al. 2010). In this study, we employ to select host galaxies that show morphological signs of interaction. Apart from this quantitative analysis, we also look for signatures of interaction and companion galaxies through visual inspection. Figure 6 shows fits of some of the most complex interacting galaxies in our sample. Note that Fourier components to measure lopsidedness are distinctive from those used to model spiral arms. We also fit companions for 92 objects. We normally use a minimum number (usually just one) of Sérsic component to model companion galaxies. Foreground stars are fit with the PSF.
Apart from GALFIT-based parametric fits, we also obtain nonparametric measurements of the host galaxy luminosity by performing aperture photometry on the images after subtracting the active nucleus (Greene et al. 2008; Kim et al. 2008b). By comparing this measurement of the host luminosity with that based on parametric fits, we can gauge the reliability of the fits independently. We remove the AGN either by using the nucleus component derived from the best-fit GALFIT model or by scaling the PSF to match the brightness of the central pixel. In general we find very good agreement between the host magnitudes derived from aperture photometry () and those obtained from model fitting (). The only exceptions are cases in which close companion galaxies are present (e.g., [HB89] 1549+203), saturation affects the core, or the image does not cover the entire galaxy (e.g., Mrk 40). Excluding such outliers, mag.
5. Derived Properties
5.1. AGN and Host Galaxy Luminosities
In order to determine the luminosity of the nucleus and the host in the rest-frame band, we need to convert the observed HST filters to and apply a -correction. Both are performed using our own IDL routines and the response functions supplied by the Space Telescope Science Data Analysis Software SYNPHOT package. For the nucleus, we employ the quasar template spectrum from the Sloan Digital Sky Survey (SDSS; Vanden Berk et al. 2001), while for the host we use galaxy template spectra from Calzetti et al. (1994) and Kinney et al. (1996). We assign a Hubble type to each host based on the derived from our decomposition, using the relation between the two quantities given in Simien & de Vaucouleurs (1986); we apply the same correction to the bulge and disk component. Table 3 lists the final luminosities of the nucleus, expressed as absolute magnitudes in the band, , and as a monochromatic luminosity at 5100 Å, . The -band luminosities are given for the bulge alone and for the entire host galaxy.
![[Uncaptioned image]](/html/1710.02194/assets/x8.png)
5.2. Black Hole Masses
The subsequent analysis in this and in our subsequent papers makes use of BH masses. We estimate virial BH masses following , where is the size of the broad-line region (BLR) obtained from an empirical correlation between and AGN luminosity (Kaspi et al. 2000; Bentz et al. 2013), is the virial velocity of the BLR inferred from the width of broad emission lines (commonly parameterized as the FWHM or as the line dispersion ), and the normalization coefficient absorbs the poorly understood structure and kinematics of the BLR. In practice, is calibrated using local type 1 AGNs that have derived from reverberation mapping and measurements of bulge stellar velocity dispersion , by scaling their virial to the relation of inactive galaxies. The calibration by Woo et al. (2010), referenced to the relation of Gültekin et al. (2009), gives for set to FWHM of broad H. This normalization, in conjunction with the BLR size-luminosity relation of Bentz et al. (2013), yields (Park et al. 2012):
| (4) |
Most of the line widths come from the literature. Whenever possible, we use our own measurements derived from high-quality Magellan spectra (Ho & Kim 2009). For a small fraction of the sample, we located matching archival spectra from SDSS (Alam et al. 2015), the FIRST Bright Quasar Survey (White et al. 2000), and the 6dF Galaxy Survey (Jones et al. 2004). We reanalyzed these archival data, performing spectral decomposition following the methodology of Kim et al. (2006) and Ho & Kim (2009), which includes fitting the AGN continuum, the stellar continuum, Fe emission, and deblending of narrow and broad emission lines. Note that in the derivation of we do not use the continuum luminosity () from the spectral analysis but instead the nucleus luminosity derived from our photometric decomposition, which we believe to be more robust against host galaxy contamination. And while most of the line widths pertain to H, a minority come from H. We adopt H instead of H when a FWHM measurement for the latter is unavailable or unreliable, mainly because Fe II multiplets were not included in the spectral fitting or H is heavily affected by the young stellar population.
Both lines share very similar kinematics. In general, however, H tends to be slightly narrower than H; we convert the FWHM of H to H using the statistical relation between the two line widths given by Greene & Ho (2005). Note that, for 37 objects, BH masses come from the reverberation mapping.
The dominant uncertainty for BH virial masses comes from the current uncertainty on the virial coefficient , which is dex (Onken et al. 2004; Collin et al. 2006; Woo et al. 2010; Ho & Kim 2014). Variability introduces an additional source of uncertainty, since the HST images, from which we extract the AGN luminosity, and the spectra, which provide the line widths, were not observed simultaneously. However, variability affects BH virial mass estimates only at the level of dex (Wilhite et al. 2006; Denney et al. 2009; Park et al. 2012). We conservatively and uniformly assign an overall error budget of 0.5 dex to . This is in a good agreement with the uncertainties quoted in previous studies (e.g., Vestergaard & Peterson 2006; Park et al. 2012).
We estimate bolometric luminosities using the continuum luminosity at 5100 Å measured from the imaging analysis and a conversion factor (McLure & Dunlop 2004). Our sample spans a relatively wide range of Eddington ratios666The Eddington luminosity is defined as erg s-1., from to 1, with / (Figure 2).
5.3. Bulge Type Classification
We divide the sample of late-type galaxies into two classes using the Sérsic index and bulge-to-total light ratio [classical bulges ( and ) and pseudo-bulges ( or ; Fisher & Drory 2008; Gadotti 2009). However, for some objects, there are ambiguities involved for the classification. We classify the bulge-type of host galaxies as “intermediate” (1) if the host is highly disturbed, which makes us difficult to constrain the Sérsic index and reliably (e.g., 3C 57), (2) if it is hard to choose the best single model to describe the host profile because either models (with a classical bulge or a pseudo-bulge) work equally well for the fit (e.g., MS 0111.90132, MS 1455.7+2121, etc.), (3) if there is severe discrepancy between our fitting result and that from the literature (e.g., Mrk 509, Mrk 609, etc.).
5.4. Uncertainties on Host Galaxy Parameters
The dominant sources of uncertainty for the host galaxy measurements arise from systematic rather than statistical errors. These have been extensively explored by Kim et al. (2008a) through controlled tests using simulated images, which take into into account factors such as PSF variation, S/N, and the brightness contrast ratio between AGN and the host. We find that the most important factor affecting the final uncertainty is the luminosity ratio of the bulge to the nucleus (). If , the bulge luminosity typically has an uncertainty of 0.3 mag, but it increases to 0.4 mag if . The error budget increases by mag if a disk component is present, and by mag if the core of the image is saturated. For the relatively bright AGNs in our sample, the luminosity of the nucleus is quite well determined, with errors mag, degrading to mag only when the nucleus is much fainter than the host (). If the best model for the host is not unique, we incorporate measurements from the second-best model into the error budget (e.g., 3C 17).
As -corrections need to be applied to the host luminosities (Section 5.1), the final -band bulge luminosities are sensitive both to the choice of galaxy template spectra and the original HST filter in question. We study these effects by experimenting with template spectra of different galaxy types and calculate the scatter in the inferred output bulge luminosities. We choose a range of Hubble types that reasonably bracket the likely morphological type of the host galaxy in question. Not surprisingly, the uncertainty is larger for bluer filters and for more distant objects since we will be sampling the rest-frame light further away from the central wavelength of the band filter, but the typical error budget is negligible ( mag). The bulge luminosity can be systematically underestimated at most by 0.1 mag, if the filter is bluer than F606W and the redshift is larger than 0.3. There is, however, one important caveat. If the stellar population of the host is very young (e.g., that of an Sc or starburst galaxy), the final luminosity can be systematically overestimated by as much as 0.8 mag at since we assume the stellar population to be old (e.g., that of an elliptical).
Our -corrections for the nucleus luminosity assume a fixed quasar composite spectrum. The continuum shape and emission-line spectra of individual optically selected quasars typical vary by around the mean (Vanden Berk et al. 2001). Monte Carlo simulations indicate that this level of spectral variation introduces variations of less than 0.03 mag for and 0.1 dex for , respectively.
![[Uncaptioned image]](/html/1710.02194/assets/x10.png)
Although our objects are relatively nearby, they can still be affected by cosmological evolution of the stellar mass-to-light ratio (). More distant galaxies have younger stars and hence lower . In order to correct for this effect, we adopt the correction taken from Treu et al. (2002). According to the stellar population models of Bruzual & Charlot (2003), this magnitude of evolution of is well described by a single stellar population with a formation redshift of 1.5 [assuming solar metallicity and a Salpeter (1955) initial mass function]. The corresponding evolution in the band is . Given that , the correction for the -band magnitudes is negligibly small ( 0.07 mag).
Lastly, some of our objects have saturated AGN cores that we could not fully correct using short, unsaturated exposures. Under these circumstances we masked out the few central saturated pixels during the fitting process. Our simulations indicate that this procedure can increase the uncertainty of the bulge luminosity by 0.2 mag.
Determining errors on and is non-trivial, as their errors are highly coupled and, as mentioned in Section 4, can be difficult to fit reliably. For moderately bright hosts ( ) for which can be fit freely, our tests show that we can determined and to within 25% and 15%, respectively. However, when the host is faint relative to the nucleus ( 0.2), the error on and can be as large as 0.5 dex.
6. Statistical Trends
Table 4 summarizes the mean properties of various subclasses of AGNs and their host galaxies.
6.1. Radio-loudness
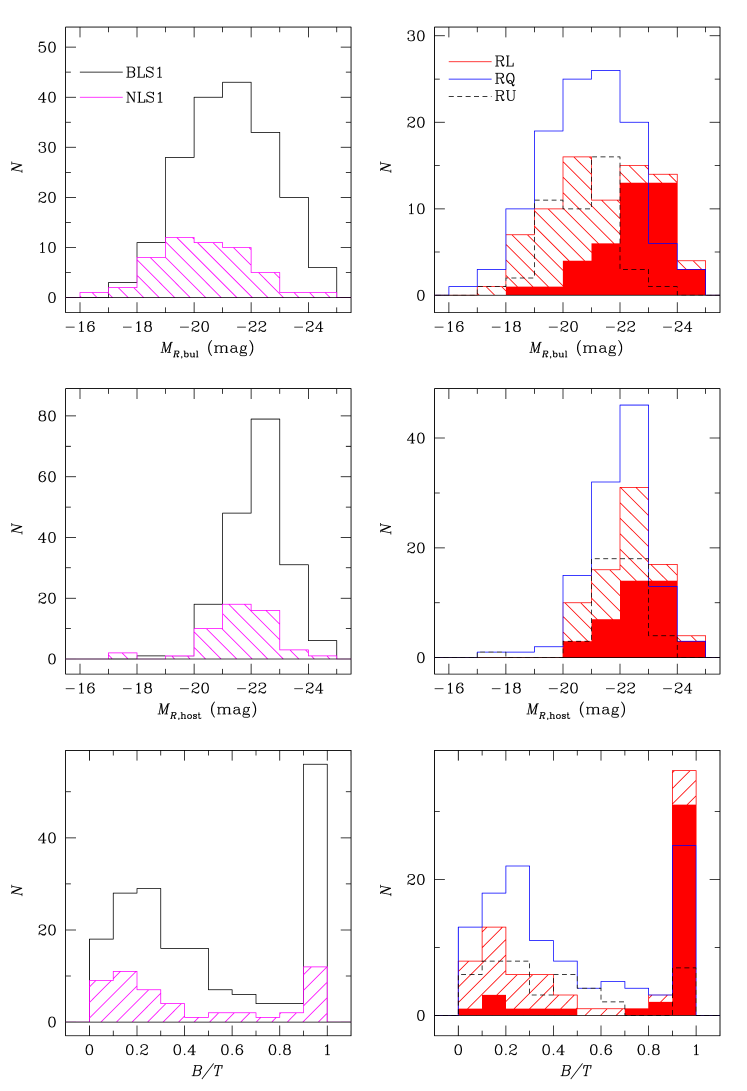
There is increasing evidence that RL galaxies are somewhat more massive and more early in type than RQ galaxies (e.g., Smith et al. 1986; Best et al. 2005; Floyd et al. 2010). We test whether the trend with radio emission also holds for the host galaxies of type 1 AGNs. The top and middle panels in Figure 7 show the luminosity distributions of the bulges and host galaxies for the different subsets of AGNs. We find that RL AGNs tend to have more luminous bulges than RQ sources. The Anderson-Darling test (A-D test) rejects the null hypothesis that the samples are drawn from the same parent distributions with a probability of less than 3%. The difference between the median of the two subsamples is mag, and for the difference is mag. This is consistent with prior studies, which find that, on average, the host galaxies of RL quasars are brighter than those of their RQ counterparts (Dunlop et al. 2003). The median for the host galaxies of RL AGNs is significantly larger than that of RQ AGNs ( vs. ). The difference in is even larger for the extreme radio-loud sources (RL2; median ). These trends are broadly consistent with the findings of Floyd et al. (2010), who report that 3CR radio galaxies are preferentially bulge-dominated. In addition, the discrepancy between RL AGNs and RQ AGNs becomes more significant if we classify RU AGNs as RQ AGNs. From the A-D test, the null hypothesis that the two samples come from the same population can be rejected with a probability of less than 1% for the distributions of bulge luminosity, host luminosity, and .
RL AGNs are traditionally associated with massive elliptical galaxies (e.g., Matthews et al. 1964). The median of the RL sources in our sample is mag, 1.4 mag brighter than of local elliptical galaxies (Tempel et al. 2011). The extreme RL (RL2) population, with median = mag, stands out even more. Therefore, we confirm that the majority of type 1 RL AGNs are hosted by massive galaxies. A significant number of RL sources in our sample (35 objects or of the RL sources) seem to be hosted by rather late-type, disk-dominated () galaxies777Some S0 galaxies can be disk-dominated, having as small as (e.g., Im et al. 2002, and references therein).. This is rarely seen among classical radio galaxies and RL quasars (e.g., Dunlop et al. 2003; Madrid et al. 2006), although some notable exceptions have been reported (Bagchi et al. 2014; Kotilainen et al. 2016). The majority of these sources in our sample have moderate absolute ( W Hz-1) or relative () radio powers. As Ho & Peng (2001) demonstrate, the radio-loudness parameter for AGNs of moderate luminosity can be severely underestimated if the host galaxy contamination to the optical light is not properly removed. Were it not for the high-resolution of the HST images and the careful separation of the nucleus from the host, which can contribute 4%–99% of the total optical light, some of the disk-dominated RL objects in this study also would traditionally have been classified as RQ. The radio morphologies appear to be compact, with no obvious signs of extended jets or lobes, but the resolution of the available radio maps (5′′ to 6′) is too poor and heterogeneous to yield meaningful insights into source structure. In our calculation of the parameter, we assume that all of the detected radio emission comes from the AGN; this may overestimate the radio power of the AGN because we have not accounted for the contribution from the host galaxy (e.g., Lal & Ho 2010).
Four of the objects with a disk-like component have sufficiently strong radio sources ( W Hz-1; ) that they are, without a doubt, genuinely RL. Three of them (3C 67, 3C 120, and PG 2349014) show clear evidence of tidal interaction. This is consistent with other nearby radio galaxies, for which those with “disky” stellar component are mostly either merging or post-merging systems (Floyd et al. 2008).
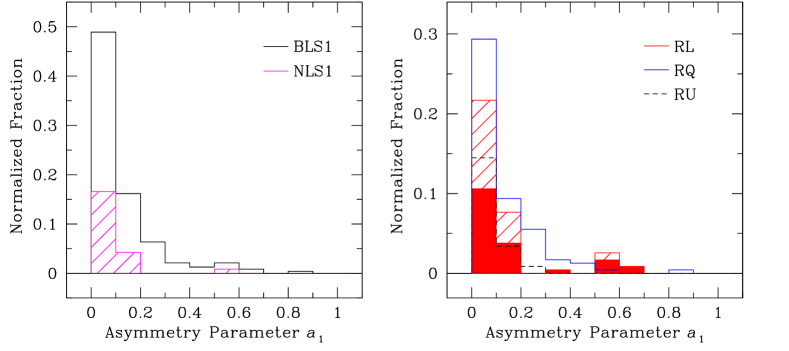
Galaxy interactions are often implicated for triggering AGNs (e.g., Stockton et al. 1982; Bennert et al. 2008). However, it is unclear whether ongoing mergers enhance radio emission in AGNs (Dunlop et al. 2003, Best et al. 2005; but see Heckman 1983). In order to investigate possible influence of mergers or interactions on radio activity, we examine the degree of asymmetry of the hosts, as measured by the amplitude of the first Fourier mode () derived from our 2-D fits. The right panel in Figure 8 shows that the majority of radio-loud AGN are hosted by undisturbed galaxies. If anything, fraction of hosts with is actually slightly higher for RQ AGNs compared to RL AGNs, exactly the opposite of what is expected. The extreme RL AGNs (RL2) appears to be hosted by similar fraction of disturbed galaxies as RQ AGNs. Overall, there appears to be no clear casual connection between radio emission and ongoing merger.
![[Uncaptioned image]](/html/1710.02194/assets/x12.png)
6.2. NLS1: Does Secular Evolution Play an Important Role?
NLS1s distinguish themselves from BLS1s not only in terms of their nuclear properties, but also in terms of the large-scale characteristics of their host galaxies (see Boller 2004 for a review). While the original HST observations analyzed in this study were not based on selection by host galaxy morphology, we find that BLS1 galaxies tend to have more luminous bulges and have earlier morphological types than NLS1s (Figure 7 and Table 4). The difference ( mag) in between BLS1 and NLS1 hosts corroborates with the notion that the central BHs in the former is more massive than those in the latter. The difference is not as great in terms of total luminosity, but it is still significant (0.55 mag). The A-D test for both the distributions of bulge luminosity and total luminosity rejects the null hypothesis that the samples are drawn from the same parent distributions with a probability of less than 1%.
Moreover, if NLS1s experience more elevated star formation activity compared to BLS1s (Sani et al. 2010), we expect NLS1s to have younger stellar populations and hence lower mass-to-light ratios than BLS1s, which would further enhance the mass difference between the two classes.
We find no significant difference in the overall distribution of global morphological asymmetry between NLS1s and BLS1s, but the fraction of disturbed hosts () evidently decreases for NLS1s. Only 4 out of 51 objects (HB89 1321+058, Mrk 896, PG1700+518, RX J2217.9-5941) show weak signs of interactions (Table 2). Numerical simulations (Lotz et al. 2008, 2010) show that morphological disturbances last much longer in gas-rich mergers than in dry mergers. Indeed, among nearby () field galaxies, the merging fraction among spiral galaxies is higher than in elliptical galaxies (Darg et al. 2010). Since NLS1s are preferentially hosted by late-type (low-) galaxies, the apparent rarity of merger or tidal features for NLS1s is especially telling. Darg et al. (2010) find that the merging fraction for nearby late-type galaxies is approximately %, essentially identical to the detection frequency of global asymmetry in our sample of NLS1s (8%). Taken at face value, these results suggest that dynamical interactions play a minor role in triggering AGN activity for NLS1s. Secular evolution seems to be more important for NLS1s (Orban de Xivry et al. 2011). These conclusions need to be verified using a statistically more rigorous sample with better control on surface brightness depth.
If galaxy mergers play a less crucial role in the lifecycle of NLS1s, then pseudo-bulges should be more common in NLS1s than in BLS1s. Using the Sérsic index (; Fischer & Drory 2008) as a proxy for identifying pseudo-bulges, we find that the fraction of pseudo-bulges in disky NLS1s is . Gadotti (2009) warns, however, that the Sérsic index threshold may not be rigorous enough to cleanly distinguish pseudo-bulges from classical bulges. We therefore impose an additional criterion, namely that, in addition to , the bulge fraction of the host must be . This reduces the pseudo-bulge fraction in NLS1s to , but it is still much larger than that in BLS1s (). As the fraction of pseudo-bulges may depend on galaxy mass (e.g., Gadotti 2009), we perform the same comparison in bins of fixed host galaxy luminosity. For 1 mag-wide bins within , the fraction of pseudo-bulges in NLS1s () always significantly exceeds that in BLS1s (), by a factor of .
Several studies claim that the frequency of bars is significantly larger in the hosts of NLS1s than in BLS1s (Crenshaw et al. 2003; Deo et al. 2006; Ohta et al. 2007). Among NLS1s hosted by spiral galaxies, the bar fraction is which is marginally lower than that in other studies of nearby (low-luminosity) Seyfert galaxies (). By contrast, spiral galaxies with BLS1s have a bar fraction of only , in excellent agreement with previous HST studies (; Crenshaw et al. 2003). Care must be exercised in comparing bar fractions between subsamples, because the incidence of bars in the general local galaxy population depends strongly on galaxy color and morphology. Redder, more bulge-dominated disk galaxies tend to have a higher bar fraction (Masters et al. 2011). Interestingly, the trend we observe in our AGN sample is precisely the opposite: the bar fraction is higher for the NLS1s than in BLS1s. Our analysis shows that NLS1s are less bulge-dominated than BLS1s, and, if they experience increased levels of star formation (Sani et al. 2010), we also expect them to be bluer. This implies that the observed higher bar fraction in NLS1 must be a genuine enhancement relative to the general galaxy population.
The above four characteristics—more disk dominance, higher fraction of pseudo-bulges, higher bar frequency, and lower merger fraction—implicate secular processes as the main agent for BH growth in NLS1s.
Among our sample of 51 NLS1s, 12 (24%) appear not to have a disk component. What kind of galaxies are these? Given the low BH and stellar masses of NLS1s, one interesting possibility is that hosts may be spheroidals rather than genuine low-mass elliptical galaxies (Greene et al. 2008; Jiang et al. 2011). Spheroidals, like pseudo-bulges, occupy a different locus on the Kormendy relation than do classical bulges and elliptical galaxies (Kormendy et al. 2009). Figure 9 compares the host galaxies of the 12 apparently diskless NLS1s with a sample of inactive galaxies. Apart from POX 52, whose host is a genuine spheroidal (Barth et al. 2004), the majority of the NLS1s largely follow the sequence of classical bulges and elliptical galaxies. It appears that these diskless NLS1s are low-mass elliptical galaxies rather than spheroidals. One object (RX J1702.5+3247) with a small effective radius (007) and high surface brightness appears to be significantly off from the Kormendy relation of normal galaxies. Given the fact that the size of the bulge is comparable to that of the PSF and the residuals still show an extended feature, the host modelling can be
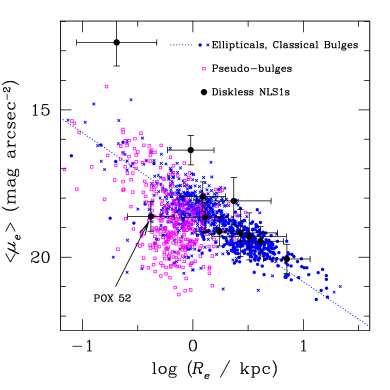
heavily affected by the PSF mismatch. Therefore, the derived parameters for the host galaxy can be unreliable for RX J1702.5+3247.
6.3. Merging Features
Merger induced AGN activity is a long-standing issue that still remains unsolved. Letawe et al. (2010) showed that the interaction frequency in nearby QSOs is marginally higher than that in normal galaxies (See also Bennert et al. 2008; Ramos Almeida et al. 2012; Hong et al. 2015). On the other hand, a lack of sign of interaction have been found in low-luminosity AGN and X-ray selected distant AGN (Schade et al. 2000; Cisternas et al. 2011). As discussed above, GALFIT allows us to quantify the degree of disturbance using the Fourier mode components. While there can be several different forms to quantify the degree of asymmetry using the Fourier components, Kim et al. (2008b) showed that the amplitude of the first Fourier component () can be used as an indicator of interaction. We also find sign of interaction by eye in the original image and residual image and classify interacting hosts independently. There is a slight discrepancy between the two methods but the overall result is similar.

Using the amplitude of the first fourier mode (), we find that 39 objects () show signs of interaction while the visual inspection yields 40 merging hosts. Note that 12 hosts with are classified as non-interacting galaxies from the visual inspection. While dust lanes are present in the host for the majority of them, some of them are associated with close companion. It is unclear if there are merging features in the images. And 75 objects seem to have close companion in the images. We compare to in Figure 10a, which shows that, the vast majority of merging hosts () have bright nucleus ( mag). This is consistent with the previous finding in which sign of interaction is found more frequently in QSO hosts than in Seyfert hosts (e.g., Treister et al. 2012). There are three outliers that have high values of () but a relatively low-luminosity nucleus ( mag). While two of them (3C 61.1 and Mrk 40) clearly show merging features in the HST images, one object (NGC 4143) appears to be a non-interacting galaxy and its high value of mainly comes from the dust lanes in the host. Figure 10b shows the fraction of merging AGNs () as a function of the nucleus luminosity. For comparison, we overplot the merging fraction from Treister et al. (2012). Because the sample of Treister et al. (2012) contains more distant objects () than our sample, a direct comparison with our results is not straightforward. Nevertheless, we find that the trend in our sample is in good overall agreement with that from Treister et al. (2012). As a caveat, however, it is worthwhile noting that our sample spans wide range of redshift and is observed under different observing conditions (S/N, filters, and detectors).
7. Summary
We present detailed analysis of HST optical images of a diverse sample of 235 type 1 AGNs for which reliable BH masses can be estimated from available optical spectroscopy, with the primary goal of investigating the structures of their host galaxies and their dependence on AGN properties. This represents the largest sample of low-redshift AGNs to date for which quantitative measurements of the host galaxies are derived from two-dimensional (GALFIT) decomposition using high-resolution images. We perform a careful decomposition of the sources into their principal structural components (nucleus, bulge, bar, disk), accounting for the effects of the PSF and simultaneously modeling, if necessary, spiral arms, tidal features, and other distortions due to tidal interactions and mergers. Whenever possible, we measure the luminosity profile of the bulge, classify its type (pseudo-bulge or classical bulge), and specify the overall morphology of the host galaxy in terms of its bulge-to-total light ratio. Fourier modes are used to quantify the degree of asymmetry of the light distribution of the stars.
Our database will be used for a variety of forthcoming applications. Here, we focus only on some issues relevant to the nature of two subclasses of AGNs, namely those with “narrow” (H FWHM km s-1)) broad lines (so-called NLS1s) and radio-loud sources. Our main results are:
-
•
Compared to broad-line (H FWHM km s-1) type 1 AGNs, NLS1s have lower overall luminosity, lower bulge luminosity, lower bulge-to-total light ratio (later Hubble types), higher incidence of pseudo-bulges, higher frequency of bars, and fewer signs of morphological asymmetry. This suggests that NLS1s have experienced fewer external dynamical perturbations and that their evolution is primarily driven by internal secular evolution.
-
•
The fraction of AGN hosts showing morphological signatures of tidal interactions and mergers is larger for more luminous AGNs.
-
•
The properties of the host galaxies vary systematically with the degree of radio-loudness of the AGN. Radio-loud sources inhabit more bulge-dominated, more luminous hosts, but, contrary to earlier reports, in our sample they are not preferentially interacting or merger systems.
We are grateful to an anonymous referee for constructive comments. This work was supported by NASA grants HST-AR-10969.03-A and HST-GO-10428.11-A from the Space Telescope Science Institute (operated by AURA, Inc., under NASA contract NAS5-26555). MK was supported by the National Research Foundation of Korea (NRF) grant funded by the Korea government (MSIP) (No. 2017R1C1B2002879). MI was supported by the National Research Foundation of Korea (NRF) grant, No. 2017R1A3A3001362, funded by the Korea government (MSIP). The work of LCH was supported by the National Key Program for Science and Technology Research and Development (2016YFA0400702) and the National Science Foundation of China (11303008, 11473002). Research by AJB is supported in part by NSF grant AST-1412693. We made use of the NASA/IPAC Extragalactic Database (NED), which is operated by the Jet Propulsion Laboratory, California Institute of Technology, under contract with NASA.
References
- (1) Alam, S., Albareti, F. D., Allende Prieto, C., et al. 2015, ApJS, 219, 12
- (2) Amram, P., Marcelin, M., Bonnarel, F., et al. 1992, A&A, 263, 69
- (3) Bagchi, J., Vivek, M., Vikram, V., et al. 2014, ApJ, 788, 174
- (4) Bahcall, J. N., Kirhakos, S., Saxe, D. H., & Schneider, D. P. 1997, AJ, 479, 642
- (5) Barth, A. J., Ho, L. C., Rutledge, R. E., & Sargent, W. L. W. 2004, ApJ, 607, 90
- (6) Barvainis, R., Lonsdale, C., & Antonucci, R. 1996, AJ, 111, 1431
- (7) Becker, R. H., White, R. L., & Edwards, A. L. 1991, ApJS, 75, 1
- (8) Becker, R. H., White, R. L., & Helfand, D. J. 1995, ApJ, 450, 559
- (9) Bender, R., Burstein, D., & Faber, S. M. 1992, ApJ, 399, 462
- (10) Bennert, N., Canalizo, G., Jungwiert, B., et al. 2008, ApJ, 677, 846
- (11) Bennert, N., Jungwiert, B., Komossa, S., Haas, M., & Chini, R. 2006, A&A, 459, 55
- (12) Bennert, V. N., Treu, T., Woo, J., et al. 2010, ApJ, 708, 1507
- (13) Bentz, M. C., Denney, K. D., Grier, C. J., et al. 2013, ApJ, 767, 149
- (14) Bessell, M. S. 2005, ARA&A, 43, 293
- (15) Best, P. N., Kauffmann, G., Heckman, T. M., et al. 2005, MNRAS, 362, 25
- (16) Biermann, P., Strom, R., & Bartel, N. 1985, A&A, 147, L27
- (17) Böhm, A., Wisotzki, L., Bell, E. F., et al. 2013, A&A, 549, A46
- (18) Boller, Th. 2004, Progress of Theoretical Physics Supplement, 155, 217
- (19) Botte, V., Ciroi, S., Rafanelli, P., & Di Mille, F. 2004, AJ, 127, 3168
- (20) Boyce, P. J., Disney, M. J., Blades, J. C., et al. 1998, MNRAS, 298, 121
- (21) Boyce, P. J., Disney, M. J., & Bleaken, D. G. 1999, MNRAS, 302, L39
- (22) Brotherton, M. S. 1996, ApJS, 102, 1
- (23) Bruzual, G., & Charlot, S. 2003, MNRAS, 344, 1000
- (24) Cales, S. L., Brotherton, M. S., Shang, Z., et al. 2011, ApJ, 741, 106
- (25) Calzetti, D., Kinney, A. L., & Storchi-Bergmann, T. 1994, ApJ429, 582
- (26) Cameron, E. 2011, PASA, 28, 128
- (27) Cardelli, J. A., Clayton, G. C., & Mathis, J. S. 1989, ApJ, 345, 245
- (28) Cassata, P., Guzzo, L., Franceschini, A., et al. 2007, ApJS, 172, 270
- (29) Chen, Y.-M., Wang, J.-M., Yan, C.-S., Hu, C., & Zhang, S. 2009, ApJL, 695, L130
- (30) Cisternas, M., Jahnke, K., & Inskip, K. J. et al. 2011, ApJ, 726, 57
- (31) Collin, S., Kawaguchi, T., Peterson, B. M., & Vestergaard, M. 2006, A&A, 456, 75
- (32) Condon, J. J., Cotton, W. D., & Broderick, J. J. 2002, AJ, 124, 675
- (33) Condon, J. J., Cotton, W. D., Greisen, E. W., et al. 1998, AJ, 115, 1693
- (34) Courbin, F., Letawe, G., Magain, P., et al. 2002, A&A, 394, 863
- (35) Courteau, S., Dutton, A. A., van den Bosch, F. C., et al. 2007, ApJ, 671, 203
- (36) Crenshaw, D. M., Kraemer, S. B., & Gabel, J. R. 2003, AJ, 126, 1690
- (37) Darg, D. W., Kaviraj, S., Lintott, C. J., et al. 2010, MNRAS, 401, 1043
- (38) de Jong, R. S. 1996, A&AS, 118, 557
- (39) de Jong, R. S., Simard, L., Davies, R. L., et al. 2004, MNRAS, 355, 1155
- (40) de Koff, S., Baum, S. A., Sparks, W. B., et al. 1996, ApJS, 107, 621
- (41) Dennefeld, M., Boller, T., Rigopoulou, D., &Spoon, H. W. W. 20 03, A&A, 406, 527
- (42) Denney, K. D., Peterson, B. M., Dietrich, M., Vestergaard, M., & Bentz, M. C. 2009, ApJ, 692, 246
- (43) Deo, R. P., Crenshaw, D. M., & Kraemer, S. B. 2006, AJ, 132, 321
- (44) de Vaucouleurs, G., de Vaucouleurs, A., Corwin Jr., H. G., et al. 1991, Third Reference Catalogue of Bright Galaxies, Version 3.9 (New York: Springer)
- (45) Donzelli, C. J., Chiaberge, M., Macchetto, F. D., et al. 2007, ApJ, 667, 780
- (46) Dunlop, J. S., McLure, R. J., Kukula, M. J., et al. 2003, MNRAS, 340, 1095
- (47) Edelson, R. A. 1987, ApJ, 313, 651
- (48) Eracleous, M., & Halpern, J. P. 1994, ApJS, 90, 1
- (49) Eracleous, M., & Halpern, J. P. 2003, ApJ, 599, 886
- (50) Ferrarese, L., & Merritt, D. 2000, ApJL, 539, L9
- (51) Ferrarese, L., Pogge, R. W., Peterson, B. M., et al. 2001, ApJL, 555, L79
- (52) Fischer, S., Iserlohe, C., Zuther, J., et al. 2006, A&A, 452, 827
- (53) Fisher, D. B., & Drory, N. 2008, AJ, 136, 77
- (54) Floyd, D. J. E., Axon, D., Baum, S., et al. 2008, ApJS, 177, 148
- (55) Floyd, D. J. E., Axon, D., Baum, S., et al. 2010, ApJ, 713, 66
- (56) Floyd, D. J. E., Kukula, M. J., Dunlop, J. S., et al. 2004, MNRAS, 355, 196
- (57) Freeman, K. C. 1966, MNRAS, 133, 47
- (58) Fukugita, M., Shimasaku, K., & Ichikawa, T. 1995, PASP, 107, 945
- (59) Gadotti, D. A. 2009, MNRAS, 393, 1531
- (60) Gallimore, J. F., Axon, D. J., O’Dea, C. P., Baum, S. A., & Pedlar, A. 2006, AJ, 132, 546
- (61) Gao, H., & Ho, L. C. 2017, ApJ, submitted
- (62) Gear, W. K., Stevens, J. A., Hughes, D. H., et al. 1994, MNRAS, 267, 167
- (63) Gebhardt, K., Bender, R., Bower, G., et al. 2000, ApJL, 539, L13
- (64) Ghigo, F. D., Wycko, S., Wardle, J. F. C., & Cohen, N. L. 1982, AJ, 87, 1438
- (65) Giavalisco, M., Ferguson, H. C., Koekemoer, A. M., et al. 2004, ApJL, 600, L93
- (66) Grandi, S. A., & Osterbrock, D. E. 1978, ApJ, 220, 783
- (67) Greene, J. E., & Ho, L. C. 2005, ApJ, 630, 122
- (68) Greene, J. E., & Ho, L. C. 2006a, ApJL, 641, L21
- (69) Greene, J. E., & Ho, L. C. 2006b, ApJ, 641, 117
- (70) Greene, J. E., Ho, L. C., & Barth, A. J. 2008, ApJ, 688, 159
- (71) Greene, J. E., Peng, C. Y., Kim, M., et al. 2010, ApJ, 721, 26
- (72) Gregory, S. A., Tifft, W. G., & Cocke, W. J. 1991, AJ, 102, 1977
- (73) Grupe, D., Beuermann, K., Mannheim, K., & Thomas, H.-C. 1999, A&A, 350, 805
- (74) Grupe, D., & Mathur, S. 2004, ApJL, 606, L41
- (75) Gültekin, K., Richstone, D. O., Gebhardt, K., et al. 2009, ApJ, 698, 198
- (76) Guyon, O., Sanders, D. B., & Stockton, A. 2006, ApJS, 166, 89
- (77) Halpern, J. P., & Filippenko, A. 1986, AJ, 91, 1019
- (78) Hamilton, T. S., Casertano, S., & Turnshek, D. A. 2002, ApJ, 576, 61
- (79) Hamilton, T. S., Casertano, S., & Turnshek, D. A. 2008, ApJ, 678, 22
- (80) Heckman, T. M. 1983, ApJ, 268, 628
- (81) Helmboldt, J. F., Taylor, G. B., Tremblay, S., et al. 2007, ApJ, 658, 203
- (82) Hill, G. J., Goodrich, R. W., & Depoy, D. L. 1996, ApJ, 462, 163
- (83) Ho, L. C., Filippenko, A. V., Sargent, W. L. W., & Peng, C. Y. 1997, ApJS, 112, 391
- (84) Ho, L. C., & Kim, M. 2009, ApJS, 184, 398
- (85) Ho, L. C., & Kim, M. 2014, ApJ, 789, 17
- (86) Ho, L. C., & Kim, M. 2015, ApJ, 809, 123
- (87) Ho, L. C., & Peng, C. Y. 2001, ApJ, 555, 650
- (88) Ho, L. C., & Ulvestad, J. S. 2001, ApJS, 133, 77
- (89) Hong, J., Im, M., Kim, M., & Ho, L. C. 2015, ApJ, 804, 34
- (90) Hopkins, P. F., Hernquist, L., Cox, T. J., et al. 2006, ApJS, 163, 1
- (91) Hutchings, J. B., Holtzman, J., Sparks, W. B., et al. 1994, ApJ, 429, L1
- (92) Hutchings, J. B., & Neff, S. G. 1992, AJ, 104, 1
- (93) Im, M., Simard, L., Faber, S. M., et al. 2002, ApJ, 571, 136
- (94) Inskip, K. J., Tadhunter, C. N., Morganti, R., et al. 2010, MNRAS, 407, 1739
- (95) Ivezić, Z̆., Menou, K., Knapp, G.R., et al. 2002, AJ, 124, 2364
- (96) Ivezić, Z̆., Smith, J. A., Miknaitis, G., et al. 2007, AJ, 134, 973
- (97) Jiang, Y.-F., Greene, J. E., Ho, L. C., Xiao, T., & Barth, A. J. 2011, ApJ, 742, 68
- (98) Jones, D. H., Saunders, W., Colless, M., et al. 2004, MNRAS, 355, 747
- (99) Kaspi, S., Smith, P. S., Netzer, H., et al. 2000, ApJ, 533, 631
- (100) Kauffmann, G., & Haehnelt, M. 2000, MNRAS, 311, 576
- (101) Keel, W. C. 1985, AJ, 90, 1449
- (102) Kellermann, K. I., Pauliny-Toth, I. I. K., & Williams, P. J. S. 1969, ApJ, 157, 1
- (103) Kellermann, K. I., Sramek, R. A., Schmidt, M., Shaffer, D. B., & Green, R. F. 1989, AJ, 98, 1195
- (104) Kim, M., Ho, L. C., & Im, M. 2006, ApJ, 642, 702
- (105) Kim, M., Ho, L. C., Peng, C. Y., Barth, A. J., & Im, M. 2008a, ApJS, 179, 283
- (106) Kim, M., Ho, L. C., Peng, C. Y., et al. 2008b, ApJ, 687, 767
- (107) Kim, M., Ho, L. C., Peng, C. Y., & Im, M. 2007, ApJ, 658, 107
- (108) Kinney, A. L., Calzetti, D., & Bohlin, R. C. 1996, ApJ, 467, 38
- (109) Koekemoer, A. M., Faber, S. M., Ferguson, H. C., et al. 2011, ApJS, 197, 36
- (110) Koekemoer, A. M., Fruchter, A. S., Hook, R. N., & Hack, W. 2002, The 2002 HST Calibration Workshop: Hubble After the Installation of the ACS and the NICMOS Cooling System, ed. S. Arribas, A. M. Koekemoer, & B. Whitmore (Baltimore, MD: STScI), 337
- (111) Kojoian, G., Tovmassian, H. M., Dickinson, D. F., & Dinger, A. S. 1980, AJ, 85, 1462
- (112) Kormendy, J. 1979, ApJ, 227, 714
- (113) Kormendy, J., Cornell, M. E., Block, D. L., Knapen, J. H., & Allard, E. L. 2006, ApJ, 642, 765
- (114) Kormendy, J., Fisher, D. B., Cornell, M. E., & Bender, R. 2009, ApJS, 182, 216
- (115) Kormendy, J., & Ho 2013, ARA&A, 51, 511
- (116) Kormendy, J., & Kennicutt Jr., R. C. 2004, ARA&A, 42, 603
- (117) Kormendy, J., & Richstone, D. O. 1995, ARA&A, 33, 581
- (118) Kotilainen J. K., Tavares J. L., Olguín-Iglesias, et al. 2016, ApJ, 832, 157
- (119) Kotilainen, J. K., & Ward, M. J. 1994, MNRAS, 266, 953
- (120) Kotilainen, J. K., Ward, M. J., & Williger, G. M. 1993, MNRAS, 263, 655
- (121) Krist, J. 1995, in Astronomical Data Analysis Software and Systems IV, ed. R. A. Shaw, H. E. Payne, & J. J. E. Hayes (San Francisco: ASP), 349
- (122) Kuraszkiewicz, J. K., Green, P. J., Crenshaw, D. M., et al. 2004, ApJS, 150, 165
- (123) Kühr, H., Witzel, A., Pauliny-Toth, I. I. K., & Nauber, U. 1981, A&AS, 45, 367
- (124) La Barbera, F., Busarello, G., Merluzzi, P., Massarotti, M., & Capaccioli, M. 2003, ApJ, 595, 127
- (125) Laing, R., & Peacock, J. A. 1980, MNRAS, 190, 903
- (126) Lal, D. V., & Ho, L. C. 2010, AJ, 139, 1089
- (127) LaMassa, S. M., Heckman, T. M., Ptak, A., & Urry, C. M. 2013, ApJL, 765, L33
- (128) Laurikainen, E., Salo, H., Buta, R., Knapen, J. H., & Comerón, S. 2010, MNRAS, 405, 1089
- (129) Lawrence, C. R., Zucker, J. R., & Readhead, A. C. S. 1996, ApJS, 107, 541
- (130) Leipski, C., Falcke, H., Bennert, N., & Hüttemeister, S. 2006, A&A, 455, 161
- (131) Letawe, G., Magain, P., & Courbin, F. 2007, MNRAS, 378, 83
- (132) Letawe, Y., Magain, P., Letawe, G., Courbin, F., & Hutsemékers, D. 2008, ApJ, 679, 967
- (133) Letawe, Y., Letawe, G., & Magain, P. 2010, MNRAS, 403, 2088
- (134) Lotz, J. M., Jonsson, P., Cox, T. J., & Primack, J. 2008, MNRAS, 391, 1137
- (135) Lotz, J. M., Jonsson, P., Cox, T. J., & Primack, J. 2010, MNRAS, 404, 590
- (136) Madrid, J. P., Chiaberge, M., Floyd, D., et al. 2006, ApJS, 164, 307
- (137) Magorrian, J., Tremaine, S., Richstone, D., et al. 1998, AJ, 115, 2285
- (138) Malkan, M. A., Gorjian, V., & Tam, R. 1998, ApJS, 117, 25
- (139) Marble, A. R., Hines, D. C., Schmidt, G. D., et al. 2003, ApJ, 590, 707
- (140) Marshall, H. L., Schwartz, D. A., Lovell, J. E. J., et al. 2005, ApJS, 156, 13
- (141) Martel, A. R., Baum, S. A., Sparks, W. B., et al. 1999, ApJS, 122, 81
- (142) Marziani, P., Sulentic, J. W., & Zamanov, R. 2003, ApJS, 145, 199
- (143) Masters, K. L., Nichol, R. C., Hoyle, B., et al. 2011, MNRAS, 411, 202
- (144) Mathur, S., Fields, D., Peterson, B. M., & Grupe, D. 2012, ApJ, 754, 146
- (145) Matthews, T. A., Morgan, W. W., & Schmidt, M. 1964, ApJ, 140, 35
- (146) Mauch, T., Murphy, T., & Buttery, H. J. 2003, MNRAS, 342, 1117
- (147) McCarthy, P. J., Baum, S. A., & Spinrad, H. 1996, ApJS, 106, 281
- (148) McLeod, K. K., & McLeod, B. A. 2001, ApJ, 546, 782
- (149) McLeod, K. K., & Rieke, G. H. 1995a, ApJ, 441, 96
- (150) McLeod, K. K., & Rieke, G. H. 1995b, ApJL, 454, L77
- (151) McLure, R. J., & Dunlop, J. S. 2001, MNRAS, 327, 199
- (152) McLure, R. J., & Dunlop, J. S. 2004, MNRAS, 352, 1390
- (153) McLure, R. J., Kukula, M. J., Dunlop, J. S., et al. 1999, MNRAS, 308, 377
- (154) Nagar, N. M., Falcke, H., & Wilson, A. S. 2005, A&A, 435, 521
- (155) Ohta, K., Aoki, K., Kawaguchi, T., & Kiuchi, G. 2007, ApJS, 169, 1
- (156) Onken, C. A., Ferrarese, L., Merritt, D., et al. 2004, ApJ, 615, 645
- (157) Orban de Xivry, G., Davies, R., & Schartmann, M. 2011, MNRAS, 417, 2721
- (158) Osterbrock, D. E. 1977, ApJ, 215, 733
- (159) Osterbrock, D. E. 1981, ApJ, 249, 462
- (160) Park, D., Woo, J.-H., Treu, T., et al. 2012, ApJ, 747, 30
- (161) Peletier, R. F., Knapen, J. H., Shlosman, I., et al. 1999, ApJS, 125, 363
- (162) Peng, C. Y., Ho, L. C., Impey, C. D., & Rix, H.-W. 2002, AJ, 124, 266
- (163) Peng, C. Y., Ho, L. C., Impey, C. D., & Rix, H.-W. 2010, AJ, 139, 2097
- (164) Peterson, B. M., Ferrarese, L., Gilbert, K. M., et al. 2004, ApJ, 613, 682
- (165) Planck Collaboration, Ade, P. A. R., Aghanim, N., et al. 2016, A&A, 594, 13
- (166) Polletta, M., Tajer, M., Maraschi, L., et al. 2007, ApJ, 663, 81
- (167) Pounds, K. A., Done, C., & Osborne, J. P. 1995, MNRAS, 277, L5
- (168) Ramos Almeida, C., Bessiere, P. S., Tadhunter, C. N., et al. 2012, MNRAS, 419, 687
- (169) Rhodes, J. D., Massey, R., & Albert, J. 2006, in The 2005 Calibration Workshop, ed. A. Koekemoer, P. Goudfrooij, & L. Dressel (Baltimore: STScI), 21
- (170) Rhodes, J. D., Massey, R. J., Albert, J., et al. 2007, ApJS, 172, 203
- (171) Rix, H.-W., Barden, M., Beckwith, S. V. W., et al. 2004, ApJS, 152, 163
- (172) Rodríguez-Ardila, A., Binette, L., Pastoriza, M. G., & Donzelli, C. J. 2000, ApJ, 538, 581
- (173) Rothberg, B., Fischer, J., Rodrigues, M., & Sanders, D. B. 2013, ApJ, 767, 72
- (174) Salpeter, E. E. 1955, ApJ, 121, 161
- (175) Salpeter, E. E., & Hoffman, G. L. 1996, ApJ, 465, 595
- (176) Sani, E., Lutz, D., Risaliti, G., et al. 2010, MNRAS, 403, 1246
- (177) Schade, D. J., Boyle, B. J., & Letawsky, M. 2000, MNRAS, 315, 498
- (178) Schlafly, E. F., & Finkbeiner, D. P. 2011, ApJ, 737, 103
- (179) Scoville, N., Abraham, R. G., Aussel, H., et al. 2007, ApJS, 172, 38
- (180) Sérsic, J. L. 1968, Atlas de Galaxias Australes (Córdoba: Observatorio Astronómico, Univ. Córdoba)
- (181) Sikora, M., Stawarz, łL., & Lasota, J.-P. 2007, ApJ, 658, 815
- (182) Simien, F., & de Vaucouleurs, G. 1986, ApJ, 302, 564
- (183) Smirnova, A. A., Moiseev, A. V., & Afanasiev, V. L. 2010, MNRAS, 408, 400
- (184) Smith, E. P., Heckman, T. M., Bothun, G. D., Romanishin, W., & Balick, B. 1986, ApJ, 306, 64
- (185) Stephens, S. A. 1989, AJ, 97, 10
- (186) Stirpe, G. M. 1990, A&AS, 85, 1049
- (187) Stockton, A. 1982, ApJ, 257, 33
- (188) Storchi-Bergmann, T., Bica, E., & Pastoriza, M. G. 1990, MNRAS, 245, 749
- (189) Strateva, I. V., Brandt, W. N., Eracleous, M., Schneider, D. P., & Chartas, G. 2006, ApJ, 651, 749
- (190) Taylor, G. L., Dunlop, J. S., Hughes, D. H., & Robson, E. I. 1996, MNRAS, 283, 930
- (191) Tempel, E., Saar, E., Liivamägi, L. J., et al. 2011, A&A, 529, 53
- (192) Thornton, C. E., Barth, A. J., Ho, L. C., Rutledge, R. E., & Greene, J. E. 2008, ApJ, 686, 892
- (193) Tovmassian, H. M. 1972, AJ, 77, 705
- (194) Treu, T., Stiavelli, M., Casertano, S., Møller, P., & Bertin, G. 2002, ApJL, 564, L13
- (195) Treu, T., Woo., J.-H., Malkan, M. A., & Blandford, R. D. 2007, ApJ, 667, 117
- (196) Treister, E., Schawinski, K., Urry, C. M., & Simmons, B. D. 2012, ApJ, 758, L39
- (197) Ulvestad, J. S., Antonucci, R. R. J., & Barvainis, R. 2005, ApJ, 621, 123
- (198) Ulvestad, J. S., & Wilson, A. S. 1984, ApJ, 285, 439
- (199) Vanden Berk, D. E., Richards, G. T., Bauer, A., et al. 2001, AJ, 122, 549
- (200) van Bemmel, I. M., Barthel, P. D., & de Graauw, T. 2000, A&A, 359, 523
- (201) van Dokkum, P. G. 2001, PASP, 113, 1420
- (202) Veilleux, S., Rupke, D. S. N., Kim, D.-C., et al. 2009, ApJS, 182, 628
- (203) Véron-Cetty, M.-P., Véron, P., & Gonçalves, A. C. 2001, A&A, 372, 73
- (204) Véron-Cetty, M.-P., & Woltjer, L. 1990, A&A, 236, 69
- (205) Vestergaard, M., & Peterson, B. M. 2006, ApJ, 641, 689
- (206) Vika, M., Driver, S. P., Cameron, E., Kelvin, L., & Robotham, A. 2012, MNRAS, 419, 2264
- (207) Virani, S., De Robertis, M. M., & VanDalfsen, M. L. 2000, AJ, 120, 1739
- (208) Wang, J., Wei, J. Y., & He, X. T. 2006, ApJ, 638, 106
- (209) White, R. L., & Becker, R. H. 1992, ApJS, 79, 331
- (210) White, R. L., Becker, R. H., Gregg, M. D., et al. 2000, ApJS, 126, 133
- (211) Wilhite, B. C., Vanden Berk, D. E., Brunner, R. J., & Brinkmann, J. V. 2006, ApJ, 641, 78
- (212) Winkler, H. 1992, MNRAS, 257, 677
- (213) Woo, J.-H., Treu, T., Barth, A. J., et al. 2010, ApJ, 716, 269
- (214) Wright, A., & Otrupcek, R. 1990, PKS Catalog, 0
- (215) Xu, D. W., Komossa, S., Wei, J. Y., Qian, Y., & Zhen, X. Z. 2003, ApJ, 590, 73
- (216) Zheng, X. Z., Xia, X. Y., Mao, S., Wu, H., & Deng, Z. G. 2002, AJ, 124, 18
- (217) Zhou, H.-Y., Wang, T.-G., & Yuan, W. 2006, ApJS, 166, 12
- (218) Zirbel, E. L. 1996, ApJ, 473, 713
Appendix A Notes on Individual Objects
Comments on the fitting results for individual objects are given here. The corresponding fit results are located at the Figures indicated. Note that the luminosities from literature are corrected to our adopted cosmology.
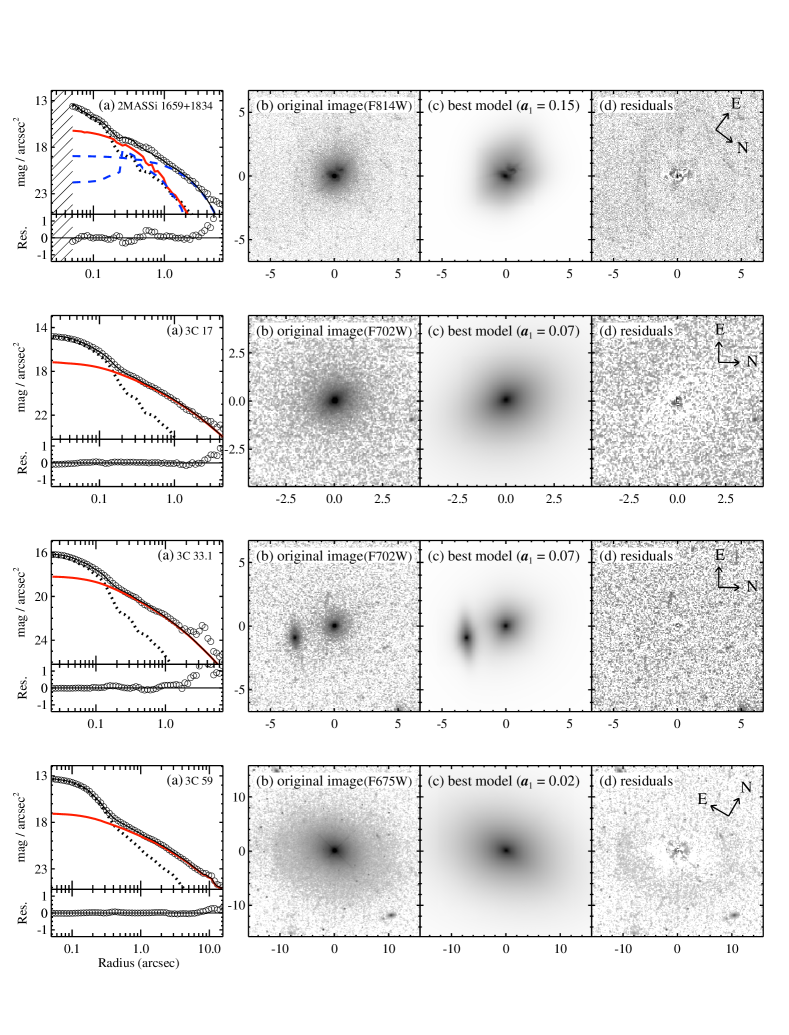
2MASSi 1659397+183436 (Fig. 11.1) — The image is slightly saturated at the center. It appears that the host galaxy has a companion. The host is fit with a pseudo-bulge and a disk, while the companion galaxy requires a disk with spiral arms. Marble et al. (2003) estimate that the nucleus-subtracted host galaxy has an -band magnitude of , which is mag fainter than our estimate.
3C 17 (Fig. 11.1) — While the host galaxy appears to be E-type, the fit with two components works reasonably well. The aperture magnitude of the host inside 15 kpc from de Koff et al. (1996) agrees with our estimates to within the uncertainties. Based on ground-based and HST/NICMOS images, Zirbel (1996) and Donzelli et al. (2007) also classify this object as an elliptical galaxy. Floyd et al. (2008) and Donzelli et al. (2007) fit the band NICMOS image and find and , respectively.
3C 33.1 (Fig. 11.1) — The host galaxy is fit with a single Sérsic component. There is a companion source which we fit with a bulge and a disk. Our measurement is in broad agreement with the aperture photometry of de Koff et al. (1996). Floyd et al. (2008) and Donzelli et al. (2007) derive and 2.3, respectively.
3C 61.1 (Fig. 11.2) — There are three diffuse companions. The nucleus appears much fainter than the host. The host galaxy is fit with a bulge and an off-center disturbed structure. Donzelli et al. (2007) classify this object as an elliptical galaxy. The measured also reveals that the host is an early-type galaxy. Floyd et al. (2008) and Donzelli et al. (2007) estimate and 3.5, respectively, which agree well with our measurement.
3C 67 (Fig. 11.2) — The host galaxy is disturbed, leading to a rather ambiguous fit. We fit the host with a low- bulge and two disks with Fourier modes. The aperture photometry from de Koff et al. (1996) closely matches our measurement.
3C 109 (Fig. 11.2) — The host galaxy is fit with a single Sérsic component. De Koff et al. (1996) slightly overestimate the aperture magnitude because they do not subtract the nucleus from the image.
3C 111 (Fig. 11.2) — The host galaxy is fit with a single Sérsic component. Martel et al. (1999) argue that the host might be an elliptical-like galaxy. Donzelli et al. (2007) estimate .
3C 120 (Fig. 11.3) — The host galaxy is fit with a tiny bulge (01) and a disturbed disk with spiral arms. However, we also find that a fit with a single Sérsic component can be acceptable. Using ground-based band data, Inskip et al. (2010) also fit the host with two components, resulting in . However, they claim that the inner component ( kpc) and the larger component ( kpc) can be regarded as as a disk and a bulge, respectively, which is the opposite of our interpretation (). By contrast, Bennert et al. (2010) concluded that the host is an elliptical galaxy (but see Bentz et al. 2009). The reason for this controversy is due to presence of the disturbed disk-like feature.
3C 197.1 (Fig. 11.3) — While a single Sérsic component gives the best fit, two components also works reasonably well. Donzelli et al. (2007) classify this object as an elliptical galaxy and derive .
3C 206 (Fig. 11.3) — The central region is saturated and there is a tiny companion galaxy. Thus the fit could be a bit ambiguous. The host is fit either with a single bulge (; 18.12 mag) or with a tiny bulge ( pix; 17.95 mag) and a disk (). Interestingly, our estimation of the bulge luminosity is an order of magnitude smaller (fainter) than that ( mag) from Hamilton et al. (2008). While the reason for the substantial difference is unclear, Hamilton et al. reported that their photometry method using the PSF-subtracted image systematically overestimates the host luminosity. In this particular object, companion galaxies might contribute to the discrepancy.
3C 219 (Fig. 11.3) — There are more than 20 companion galaxies in the image. There seems to be a weak sign of interaction with companion galaxies. The host is well fit with a single bulge but an additional extended component slightly helps. The bulge magnitude would be 0.3 mag fainter if we use two components model. McLure et al. (1999) and Donzelli et al. (2007) classified the host galaxy as an elliptical galaxy.
3C 223 (Fig. 11.4) — The host is fit well with a single bulge (; 16.78 mag). But, alternatively the fits with a single () or two component models also reasonably work well. Thus the bulge luminosity can range 16.7 17.7 mag. Donzelli et al. (2007) fit the host with a single component with ), which is in good agreement with our estimation.
3C 227 (Fig. 11.4) — The image is saturated in the center. We fit the host with a single bulge (). The host is also classified as an elliptical () in Donzelli et al. (2007).
3C 277.1 (Fig. 11.4) — The host is associated with an interacting galaxy and is fit with a bulge and a tidal tail. Out measurement of the host luminosity is well matched with that of Hamilton et al. (2002).
3C 287.1 (Fig. 11.4) — The host is fit with a single bulge. There are several companion objects. But we find no clear sign of interaction. While Donzelli et al. (2007) claimed that this object has disk-like structure, Dunlop et al. (2003) fit the host with a single component. It is possible that Donzelli et al. misclassified the host due to the bright nucleus. The bulge luminosity from Dunlop et al. (2003) is in good agreement with that from our method.
3C 303 (Fig. 11.5) — While the host galaxy is well fit with a single bulge, the host model with two components works reasonably well. Donzelli et al. (2007) fit the host with a single component ().
3C 332 (Fig. 11.5) — The host galaxy is well-fit with a single bulge. Donzelli et al. (2007) claim that the host is fit with a bulge and a disk. As in 3C 287.1, the fit from Donzelli et al. can be affected by the bright nucleus. In addition, Floyd et al. (2008) show that the Sérsic index of the host ranges from 1.7 to 4.5 depending on the fitting method (1D or 2D). We cannot completely rule out the existence of the disk in this object.
3C 382 (Fig. 11.5) — The image is heavily saturated at the center. The host galaxy only requires a single bulge component to fit. Floyd et al. (2008) found that the host can be fit with high Sérsic index ().
3C 390.3 (Fig. 11.5) — There is a marginal PSF mismatch for this object. While a single bulge (17.09 mag) is sufficient for representing the host, the fit with two components ( mag) works reasonable well, also. The host is well-fit with a Sérsic profile with in the HST IR image (Floyd et al. 2008). Bennert et al. (2010) also described the host as an elliptical galaxy (but see Bentz et al. 2009).
3C 445 (Fig. 11.6) — The image is saturated in the center, thus the fit might be ambiguous. The host is fit with a single bulge. Floyd et al. (2008) also claim that the host might be an elliptical galaxy ().
ESO 031G8 (Fig. 11.6) — The image is saturated in the center. The fit is done with a bulge, a bar, and a disk with spiral arms. We use the hybrid method for the disk. The host is classified as a barred spiral galaxy from previous studies (Crenshaw et al. 2003; Malkan et al. 1998).
ESO 362G18 (Fig. 11.6) — The image is saturated in the center. The fit is done with a mosaic image. The host galaxy is modeled with a pseudo-bulge () component and a disk with spiral arms. There might be a companion galaxy but it is not certain whether the two galaxies are in merging process.
ESO 383G35 (Fig. 11.6) — The image is saturated in the center in this WFPC2 mosaic image. The host galaxy is classified as a S0 galaxy in Malkan et al. (1998), and we fit it with a bulge and a disk component.
FBQS 125807.4+232921 (Fig. 11.7) — The image is slightly saturated in the center. The host is fit with a single bulge. Our measurement of the host luminosity () is in good agreement with that (, converted to our assumed cosmology with ) from Marble et al. (2003).
Fairall 9 (Fig. 11.7) — The host is fit with a bulge and a disk (). Based on the ground-based image, Kotilainen et al. (1993) obtain . There is a good agreement between our measurement and that () from Bentz et al. (2009) derived with the same HST image.
Fairall 1146 (Fig. 11.7) — The WFC2 image is saturated in the center and the nucleus is very faint compared to the host galaxy. The host appears to be a pseudo-bulge with Sérsic index of , a bar, and a disk with spiral arms. While Crenshaw et al. (2003) and Malkan et al. (1998) conclude that the host is an unbarred spiral galaxy, we find that a bar is required for a better fit.
HB89 0244+194 (Fig. 11.7) — The host galaxy is well-fit with a single component, although the residual shows an extended feature. McLure et al. (1999) identify the host as an elliptical galaxy.
HB89 0316346 (Fig. 1.8) — While the host galaxy is fit with a bulge and a highly disturbed component, the galaxy is likely to be an early-type ( and (bulge)). Based on the same HST image, Bahcall et al. (1997) conclude that , consistent with our measurement.
HB89 0759+651 (Fig. 11.8) — The image is saturated in the center, thus the fit might be ambiguous. Tidal features are seen. The host galaxy is fit with a bulge and two extended components with azimuthal Fourier modes. The light of the host galaxy appears to be dominated by the bulge (). Boyce et al. (1998) also claimed that the host might be a disk galaxy.
HB89 1150+497 (Fig. 11.8) — The host galaxy is fit with a bulge component, and a faint fine structure ( mag; ). The residual image shows significant PSF mismatch, thus the nucleus magnitude could be significantly underestimated. Floyd et al. (2004) also described the host as an elliptical galaxy.
HB89 1321+058 (Fig. 11.8) — The host galaxy is highly disturbed, thus the fit might be ambiguous. The host is fit with a pseudo-bulge (), and two disks with azimuthal Fourier modes.
HB89 1402+436 (Fig. 11.9) — The image is saturated in the center. We fit the host galaxy with a bulge and extended disturbed components. But it appears to be a bulge-dominated galaxy merging with a smaller galaxy (see also Hutchings & Neff 1992).
HB89 1549+203 (Fig. 11.9) — Using a ground-based image, Hutchings & Neff (1992) find that the host galaxy appears to a barred spiral. However, the HST image shows that the bar-like structure extending N-S is more likely to be spiral arms. In contrast, Dunlop et al. (2003) conclude that the fit is consistent with an elliptical galaxy. But the discrepancy in the bulge luminosity estimates is relatively small ( mag). From our fit, we find that the host might have a compact nucleus or tiny bulge ( pixels), and a disk with spiral arms.
HB89 1635+119 (Fig. 11.9) — The host galaxy is well fit with a single bulge-like component, which is consistent with findings from McLure et al. (1999).
HB89 1821+643 (Fig. 11.9) — The contamination from surrounding objects is severe, thus we fit them ( objects) simultaneously. A single bulge-like component suffices for fitting the host galaxy, consistent with the result from Floyd et al. (2004).
HB89 2141+175 (Fig. 11.10) — While the host galaxy is fit with a bulge component and an elongated disk-like feature, it still appears to be dominated by the bulge (). Previous studies also conclude that it is an elliptical galaxy, although the image reveals extended filaments (e.g., McLure et al. 1999; Hutchings et al. 1994).
HB89 2201+315 (Fig. 11.10) — The fit favors the host galaxy being E-type. Using the -band image with adaptive optics (AO), Guyon et al. (2006) also conclude that the host is well fit with a single bulge component.
HB89 2215037 (Fig. 11.10) — The host appears to be an elliptical galaxy. Our estimate of the bulge luminosity is well matched to that from Dunlop et al. (2003).
HB89 2344+184 (Fig. 11.10) — While the host galaxy is well-fit using a bulge and a disk-like components (see also Taylor et al. 1996; McLure et al. 1999), Hutchings & Neff (1992) claim that it can be a barred spiral galaxy.
HE 00542239 (Fig. 11.11) — The host galaxy is fit with a tiny bulge-like component (06) and a disk with spiral arms. Ohta et al. (2007) find that the host is a barred spiral galaxy, based on a ground-based image with 0510 seeing. However, we find no clear evidence for a bar.
HE 03063301 (Fig. 11.11) — The host is fit with a pseudo bulge () and a disk with spiral arms.
HE 03545500 (Fig. 11.11) — This object appears to reside in a merging system. The host galaxy is highly disturbed and might have a disk with spiral arms.
HE 10431346 (Fig. 11.11) — The host galaxy is fit with a bulge () component, an inner disk (with spiral arms) and an additional outer disk with spiral arms. The bulge luminosity can range from 18.6 to 19.3 mag depending on the model profile for the bulge. We tried to add a bar but it appears to be unnecessary.
HE 11101910 (Fig. 11.12) — Whereas the best fit of the host galaxy using a single bulge component yields a bulge luminosity of mag, a fit with two components (bulge+disk) finds that the bulge luminosity can either either 18.35 () or 19.0 () mag. Jahnke et al. (2004) conclude that the host is a slightly disturbed elliptical galaxy, using a ground-based image.
HE 12281637 (Fig. 11.12) — This AGN appears to be a merging system. While we fit the companion objects with four Sérsic components along with Fourier azimuthal modes, the host galaxy requires only a single Sérsic component to model. With ground-based images, Jahnke et al. (2004) also classify this as an elliptical galaxy but they find no clear sign of interaction in the 5 seeing image.
HE 1252+0200 (Fig. 11.12) — The residual image shows a significant PSF mismatch at the core. Aperture photometry of the host galaxy might be uncertain due to the presence of companions. The best fit requires only a single Sérsic component to describe the host galaxy, consistent with findings of Floyd et al. (2004).
HE 14341600 (Fig. 11.12) — The host galaxy is well fit with a single bulge component. Jahnke et al. (2004) also conclude that the host is an elliptical galaxy based on the ground-base image. The HST image reveals shell-like features which could indicate a recent minor merger event.
HE 1503+0228 (Fig. 11.13) — The host galaxy is fit with a bulge () and a disk with spiral arms. Using dynamical information obtained from the spatially resolved spectroscopy, Courbin et al. (2002) conclude that the host galaxy is a normal spiral.
HE 23452906 (Fig. 11.13) — The host is fit with a very small bulge (), a bar, an inner ring (with the hybrid mode), and a disk with spiral arms. Letawe et al. (2007; 2008) also classify the host as a barred spiral galaxy.
IC 4329A (Fig. 11.13) — We masked out the dust lane along the disk and fit the host with a pseudo-bulge () and a disk. While previous studies claim that the host is a spiral galaxy (Malkan et al. 1998; Crenshaw et al. 2003), Kotilainen & Ward (1994) fail to detect the bulge component in ground-based optical images.
Mrk 10 (Fig. 11.13) — We use a mosaic image of WFPC2 for the fit. The image is slightly saturated. The host galaxy has fitted components that resemble a pseudo-bulge () and a disk with spiral arms. Previous studies based on the same HST image also conclude that the host is an unbarred spiral galaxy (Malkan et al. 1998; Crenshaw et al. 2003).
Mrk 40 (Fig. 11.14) — The WFPC2 image is saturated in the center. While the image does not cover the entire galaxy, the host galaxy appears to have a bulge () and a disk with tidal tails. This object is almost certainly an interacting system.
Mrk 42 (Fig. 11.14) — The WFPC2 image is saturated in the center. The host galaxy appears to possess a pseudo-bulge, a bar, and a disk with spiral arms, modeled with the hybrid method. An inner ring is apparent in the residual image. Jiang et al. (2011) and Orban de Xivry et al. (2011) also fit the host with a bulge, a bar, and a disk components. The bulge to total ratio () found by Jiang et al. and Orban de Xivry et al. is in good agreement with our estimation ().
Mrk 50 (Fig. 11.14) — The WFPC2 image is saturated in the center. The host galaxy appears to have a bulge and a faint disk (), and might be a S0 galaxy (Malkan et al. 1998).
Mrk 79 (Fig. 11.14) — The outer part of the galaxy is outside the detector field of view, thus the total brightness of the host might be an upper limit. The host galaxy is fit with components that resemble a bulge and a disturbed bar and a disk. Dust lanes are prominent. Malkan et al. (1998) and Crenshaw et al. (2003) classify the host as a barred disk galaxy. Bennert et al. (2010) find the ratio of to be a bit larger than our estimate ().
Mrk 231 (Fig. 11.15) — The WFPC2 mosaic image is saturated in the center. Because the host galaxy is highly disturbed (), it is fit with a pseudo-bulge and two disturbed disks.
Mrk 352 (Fig. 11.15) — The WFPC2 mosaic image is saturated. The host galaxy is fit with a bulge and a disk components. The found in this study matches well with that () derived in Orban de Xivry et al. (2011). However, previous studies (Malkan et al. 1998 and Crenshaw et al. 2003) based on visual inspection conclude that the host is an elliptical galaxy.
Mrk 359 (Fig. 11.15) — The WFPC2 mosaic image is saturated in the center. We fit the host galaxy with 3 components that resemble pseudo-bulge (), a bar, and a disk with spiral arms. Orban de Xivry et al. (2011) derive which is in good agreement with our measurement.
Mrk 372 (Fig. 11.15) — The WFPC2 mosaic image is saturated in the center. The host galaxy appears to have a bulge and a disk with spiral arms which we fit with a two component model. There is no sign of a bar in the image (see also Malkan et al. 1998 and Crenshaw et al. 2003).
Mrk 382 (Fig. 11.16) — The WFPC2 mosaic image is saturated in the center. The host galaxy is fit with a bulge component (), a bar, and a disk with spiral arms. Our estimate on the () ratio is slightly higher than that (0.31) from Orban de Xivry et al. (2011). This might be because we fit for the bar component explicitly in the decomposition.
Mrk 423 (Fig. 11.16) — The host galaxy in the WFPC2 mosaic image appears to be associated with a interacting galaxy. The host is fit with a pseudo-bulge component, a disk with spiral arms, and tidal tails. As with Mrk 382, we slightly underestimate () compared to Orban de Xivry et al. (2011; ).
Mrk 471 (Fig. 11.16) — We fit the WFPC2 mosaic image of the host galaxy using a pseudo-bulge () component and a disk with spiral arms. Although Malkan et al. (1998; and Crenshaw et al. 2003) classify the host as a barred galaxy, the best fit indicates that an additional bar is unnecessary to model the host.
Mrk 493 (Fig. 11.16) — The WFPC2 mosaic image is saturated at the center. The host galaxy appears to have tiny pseudo-bulge (), a bar, and a disk with spiral arms. The bar and the disk are fit by the hybrid model. Orban de Xivry et al. (2011) also find the host galaxy to contain a pseudo-bulge ().
Mrk 509 (Fig. 11.17) — From ground-based NIR data, the host galaxy appears as an elliptical (e.g., Fischer et al. 2006). However, the HST image shows that it s not a typical elliptical galaxy as it has spiral structures, dusty features, and a ring. We model it with a small bulge, a disk, and a ring-like structure (outer ring); the latter is modeled with the hybrid method.
Mrk 516 (Fig. 11.17) — The host galaxy is fit with a bulge component and a disk with spiral arms in this WFPC2 mosaic image. From the double nuclei (separation of ) it appears that the host is merging system (see also Deo et al. 2006), however there are no other clear signs of interaction in the WFPC2 image. Smirnova et al. (2010) claim that a wide-field deep image shows shell-like structures, which might be formed during minor mergers.
Mrk 543 (Fig. 11.17) — The WFPC2 mosaic image is saturated at the center. The host galaxy has a pseudo-bulge-like () component and a disk with spiral arms. Although no clear signs of interaction are present in the HST image, shells are seen in a deep ground-based image from Smirnova et al. (2010).
Mrk 590 (Fig. 11.17) — The host galaxy has a pseudo-bulge () and a disk (). There is also a faint inner spiral arm-like structure in the residual image. The fit with a ground-based NIR image (Vika et al. 2012) yields a larger () than our results based on an optical image, perhaps due to the relative prominence of older stellar populations in the NIR.
Mrk 595 (Fig. 11.18) — Since the WFPC2 mosaic image is highly saturated in the center, the fit parameters may be compromised. The host galaxy is modeled with a bulge and a disk () component. Our result is consistent with Orban de Xivry et al. (2011; ), within the errors.
Mrk 609 (Fig. 11.18) — The WFPC2 mosaic image is saturated in the center. The AGN host appears to have a pseudo-bulge (), an inner disk, and another outer disk. We adopt the hybrid method to model the inner disk. Our fitting result () is notably different from that in Orban de Xivry et al. (2011; ). This is because we use an inner disk to model the host. If instead we assume the inner disk is part of the bulge, becomes dramatically larger () comparable to that from Orban de Xivry et al.
Mrk 699 (Fig. 11.18) — Since cosmic rays are not removed perfectly we mask out pixels affected by cosmic rays. The WFPC2 mosaic image is saturated in the center. The host galaxy is fit with a bulge (), and a disk component. Alternatively, a fit with a classical bulge () and a disk finds a bulge component that is brighter by 0.4 mag. We conclude that the host can be classified as an S0 galaxy.
Mrk 704 (Fig. 11.18) — The WFPC2 mosaic image is saturated in the center. The AGN host is fit with components: a bulge, a bar, and a disk with spiral arms. For the bar and disk, we use the hybrid method. Our result is broadly consistent with Orban de Xivry et al. (2011).
Mrk 766 (Fig. 11.19) — The WFPC2 mosaic image is saturated in the center. The host galaxy can be modeled with a bulge, a bar, and a disk with spiral arms, components. The result is comparable to that from Orban de Xivry et al. (2011).
Mrk 871 (Fig. 11.19) — The WFPC2 mosaic image is saturated in the center. The best fit finds that the host galaxy has a pseudo-bulge (), a bar and a disk with spiral arms. Orban de Xivry et al. (2011) found and , which is in good agreement with our measurements ().
Mrk 896 (Fig. 11.19) — The WFPC2 mosaic image is saturated in the center. The AGN host is fit with a pseudo-bulge (), a bar, two (outer and inner) disks with spiral arms (), components . Orbad de Xivry et al. (2011) fit the host with a bulge () and a disk ().
Mrk 1040 (Fig. 11.19) — We use a mosaic image of WFPC2 for the fit, although it appears to cover only a part of the host galaxy. The image is saturated at the center. We fit the AGN host with a pseudo-bulge () and a disk with spiral arms (). Although a bar is not clearly seen in the HST image (see also Malkan et al. 1998 and Crenshaw et al. 2003), there is gas-dynamical evidence for a bar (Amram et al. 1992).
Mrk 1044 (Fig. 11.20) — The mosaic image of WFPC2 is saturated in the center. The fit finds a small pseudo-bulge (), an inner disk, and an outer disk with spiral arms (). The results are generally in good agreement with Orbad de Xivry et al. (2011; and ).
Mrk 1048 (Fig. 11.20) — The host galaxy appears to be a single bulge from the fit. A companion galaxy also appears to be a spheroid. There is an extended ring-like structure which is not easy to see in Figure 11.20.
Mrk 1095 (Fig. 11.20) — There are prominent spiral arms in the image which are not fit. The best fit finds that the AGN host can be modeled with a bulge ( mag) component and an exponential disk without spiral arms (). While previous studies claim that the host certainly contains a disk, the ratio appears to be somewhat uncertain and ranges from 0.35 (Bennert et al. 2010) to 0.49 (Bentz et al. 2009).
Mrk 1126 (Fig. 11.20) — The image is slightly saturated. We use a mosaic image of WFPC2 for the fit. The AGN host galaxy is fit with a pseudo-bulge and two disks with spiral arms. The inner disk component has , which suggests that it can be a “lens” (Kormendy 1979). The fitting result is consistent with Orbad de Xivry et al. (2011; and )
Mrk 1330 (Fig. 11.21) — This SBb galaxy (Sandage 1961) contains dust lanes which make the fitting result uncertain. The fit uses a pseudo-bulge () and a disk component with spiral arms. Based on wide-field ground-based images, Kormendy et al. (2006) also find the bulge of the host to be an pseudo-bulge.
Mrk 1469 (Fig. 11.21) — The WFPC2 image is saturated in the center. The AGN host is fit with a pseudo-bulge and a disk, but the result is affected by dust lanes. We omit Fourier modes in the fit which are even more affected by dust lanes.
MS 0007.10231 (Fig. 11.21) — The fit is affected by a dust lane which may be perturbing the profile of the galaxy bulge.
MS 0048.8+2907 (Fig. 11.21) — The host galaxy is a very complicated object, and we fit it with a bulge and a disk with spiral arms. There are tiny inner arms, large outer arms, and a highly extended wing which is not shown in this image. The complicated structures in the residual image suggest that the bulge parameters may be uncertain. We also tried to model the host galaxy with an additional bar but failed to find an optimal solution. Contrary to our results, Schade et al. (2000) claim that the host is a bulge-dominated system () based on both ground-based and HST images. However, visual inspection would suggest that the bulge size and its contribution to the total luminosity should both be modest to small.
MS 0111.90132 (Fig. 11.22) — The AGN host galaxy seems to have a small bulge ( pixels) along with some weak signs of interaction. Like with MS 0048.8+2907 there is some disagreement between our model and that from Schade et al. (2000), where they find the host galaxy to have a single component bulge. Although we do find that the fit with a single bulge might work, the residual image from such a fit clearly shows a more extended structure, possibly indicating a disk in the host.
MS 0135.4+0256 (Fig. 11.22) — While we find that the host galaxy may have a small bulge (23), a bar, and a disk (), Schade et al. (2000) fit the host with a larger and brighter bulge (66 and ).
MS 0144.20055 (Fig. 11.22) — The host galaxy appears to have a small bulge (032) with a disk. This is in broad agreement with the fitting results from Schade et al. (2000).
MS 0321.56657 (Fig. 11.22) — We fit the host galaxy with a small pseudo-bulge (018, ), a bar, and a disk. Our estimate on the ratio () is substantially smaller than that () from Schade et al. (2000).
MS 0330.8+0606 (Fig. 11.23) — The host galaxy requires a bulge, a bar, and a disk with spiral arms to fit well. The estimated () is slightly smaller than that (0.32) from Schade et al. (2000), possibly due to the bar component.
MS 0412.40802 (Fig. 11.23) — Although a single bulge (14.88 mag) seems to suffice to represent the host galaxy, a fit with a bulge (16.26 mag) and disk (15.54 mag) also works reasonably well. Schade et al. (2000) classify the host galaxy as an elliptical galaxy.
MS 0444.91000 (Fig. 11.23) — The best fit with a bulge, a bar, and a disk finds that the bulge is as bright as 17.81 mag. A fit without a disk is also acceptable and yields a bulge as bright as 17.76 mag. Our measurements is consistent with Schade et al. (2000) to within the measurement uncertainties.
MS 0457.9+0141 (Fig. 11.23) — The host galaxy is fit with a classical bulge (, mag) and an exponential disk. But a bulge with and mag also works very well. Schade et al. (2000) conclude that the host can be described by the single bulge ( mag).
MS 0459.5+0327 (Fig. 11.24) — The WFPC2 mosaic image is saturated in the center. The host galaxy has a bulge, a disk, and a faint tidal tail. We are unable to fit the tidal tail with Fourier modes. Crenshaw et al. (2003) classify the host as an elliptical.
MS 0719.9+7100 (Fig. 11.24) — While the best fit yields a single bulge for the host galaxy, a fit with two components also works well. The fitting result is in good agreement with Schade et al. (2000).
MS 0754.6+3928 (Fig. 11.24) — Either a fit with a single bulge ( mag) or a fit with a bulge ( mag) + a disk works equally well. We find a high discrepancy in the host galaxy magnitude between image fitting and aperture photometry techniques, possibly due to a significant PSF mismatch. Schade et al. (2000) argue that the host is an elliptical galaxy. However, they estimate the bulge brightness to be mag brighter than our measurement.
MS 0801.9+2129 (Fig. 11.24) — The image is slightly saturated. We mask out pixels where the values are greater than 1000 ADUs. The bulge magnitude can range from 16.7 mag to 17.1 mag depending on the model. Overall, the best fitting parameters are in broad agreement with those from Schade et al. (2000).
MS 0842.70720 (Fig. 11.25) — The host galaxy can be described by a bulge, a disk and a bar. However, a fit without a bar appears to be acceptable. The bulge magnitude can be either 17.37 mag with, or 17.50 mag without, a bar. The best fit for the host is broadly consistent with findings from Schade et al. (2000).
MS 0844.9+1836 (Fig. 11.25) — The best fit finds that the host galaxy has a bulge ()-to-disk ratio as high as . While the bulge luminosity is in good agreement with Schade et al. (2000), they find a slightly larger () for the host galaxy.
MS 0849.5+0805 (Fig. 11.26) — Due to substantial PSF mismatch, it is nontrivial to determine the best fit. We choose the double component (bulge+disk) fit as the best model, judging by the residual image, but a fit with a single component is also acceptable. Schade et al. (2000) classify the host as an elliptical galaxy with a bulge magnitude of mag.
MS 0904.41505 (Fig. 11.26) — There are some weak signs of interaction but the image is too shallow to confirm it. The host galaxy shows some very complex features in the center and the best fit finds the host to require a pseudo-bulge (), a bar, and a disk, components. Schade et al. (2000) find a substantially larger , which might be due to the bar component being fitted as part of the bulge in their analysis.
MS 0905.60817 (Fig. 11.26) — The best fit finds that the host galaxy has a bulge and a slightly disturbed disk. Our results are in good agreement with the analysis of Schade et al. (2000).
MS 0942.8+0950 (Fig. 11.26) — The host galaxy is fit with a bulge, a bar, a disk with spiral arms, yielding mag. But the bulge can be as bright as mag for a fit without a bar. The fitting results are consistent with those in Schade et al. (2000).
MS 1059.0+7302 (Fig. 11.27) — The host galaxy can be fit with a bulge and a disk component. There are weak signs of an inner ring in the residual. Schade et al. (2000) find a larger () than our estimate () and a larger for the bulge. This discrepancy could be related to the existence of the inner ring.
MS 1136.5+3413 (Fig. 11.27) — We fit the host galaxy with a bulge component, a bar and a disk with spiral arms. We use the hybrid technique to better model/merge the bar and the disk components. The fitting results are in good agreement with those in Schade et al. (2000).
MS 1139.7+1040 (Fig. 11.27) — Although the residual image shows weak signs of spiral arms, it is too faint to be modeled. The host galaxy appears to have a pseudo-bulge (, mag) and a disk component. Schade et al. (2000) find a brighter bulge ( mag), thus a slightly larger ().
MS 1143.50411 (Fig. 11.27) — The host galaxy has a bulge ( mag), a bar, and a disk with spiral arms (). The hybrid model is used to merge the bar and disk components. The bulge is tiny ( pixels). Like MS 1139.7+1040, the fitting results from Schade et al. (2000) yield a slightly brighter bulge brighter ( mag) and slightly larger compared to our results.
MS 1158.60323 (Fig. 11.28) — A ring-like structure and tidal features are present in the residual image. The bulge magnitude can range from 15.95 to 16.86 mag depending on the model. Schade et al. (2000) obtain a slightly smaller bulge magnitude ( mag).
MS 1205.7+6427 (Fig. 11.28) — The host galaxy has a bulge component, and a disturbed disk fitted using two additional components for the disturbed wings. While we find that the bulge has ′′, Schade et al. (2000) conclude that of the bulge is ′′, which might be the main reason for there being a discrepancy in the bulge magnitude.
MS 1214.3+3811 (Fig. 11.28) — The host galaxy appears to have a tiny bulge (015 and ). The overall fitting results appears to be consistent with those from Schade et al. (2000).
MS 1217.0+0700 (Fig. 11.28) — The host galaxy has a tiny bulge and a disk with spiral arms. An additional bar is otherwise unhelpful to model the host. Like MS 1214.3+3811, our analysis is in good agreement with the study by Schade et al. (2000).
MS 1219.6+7535 (Fig. 11.29) — The host galaxy appears to have a pseudo-bulge (16.49 mag and ) while, the fit with a classical bulge () yields mag. The lopsidedness parameter, , is slightly large (0.15) but this might be caused by the presence of a companion. In contrast to our findings, Schade et al. (2000) find a substantially brighter bulge ( mag).
MS 1220.9+1601 (Fig. 11.29) — The bulge magnitude can range from 18.2 () to 18.64 () depending on the adopted Sérsic index. Like MS 1205.7+6427, Schade et al. (2000) claim that the size of the bulge (′′) is much larger than our measurement (′′). Also, they find the bulge to be 2.5 mag brighter than our optimal fit.
MS 1232.4+1550 (Fig. 11.29) — While we fit the host galaxy with a small bulge ( mag), a bar, and disk with spiral arms, the fit without a bulge appears to work reasonably well. Schade et al. (2000) find a slightly brighter bulge ( mag) from their best fit without a bar component.
MS 1239.2+3219 (Fig. 11.29) — There is an inner ring-like structure. The host galaxy has a bulge and a ring (modeled with the hybrid model), and a disk. The overall result is consistent with that from Schade et al. (2000).
MS 1306.10115 (Fig. 11.30) — Although the fit with a bulge ( mag) and a disk is deemed as the best solution, a fit with a single bulge ( mag) is also acceptable. Schade et al. (2000) conclude that the host can be described with a single bulge.
MS 1322.3+2925 (Fig. 11.30) — The fitting result is uncertain because the target object is located at the edge of the image. The host is fit with a single bulge component, which is consistent with the study by Schade et al. (2000).
MS 1327.4+3209 (Fig. 11.30) — The host galaxy is fit with a bulge, a disk, and an outer ring, components. For the disk and the ring, we adopt the hybrid model.
MS 1333.9+5500 (Fig. 11.30) — The host galaxy appears to be an edge-on galaxy with a warped disk, and is fit with a bulge and a disk. The best fitting parameters are in good agreement with those in Schade et al. (2000).
MS 1334.6+0351 (Fig. 11.31) — The host galaxy has both a bulge ( mag) and a disk. However, the fit with a single bulge ( mag) also works reasonably well. Schade et al. (2000) conclude that the host is an elliptical galaxy.
MS 1351.6+4005 (Fig. 11.31) — The bulge brightness can range from to mag depending on the adopted model. A ring-like structure is seen in the residual image. Schade et al. (2000) find of , which is considerably larger than our measurement ().
MS 1403.5+5439 (Fig. 11.31) — While we fit the host galaxy with a bulge and a disk components, the residuals show a ring-like or spiral structure in the central region. In the spectrum from SDSS, the broad H is very weak, but the broad H is prominent. The best fit yields the host to be a bulge-dominated system. Similarly, Schade et al. (2000) classify the host as an elliptical galaxy.
MS 1414.0+0130 (Fig. 11.31) — Although we fit the host galaxy with a bulge(, ) and a disk, fits with a single bulge (17.4 mag with or 17.7 mag with ) or a pseudo-bulge (18.4 mag) plus a disk also work well. Regardless of adopted fitting models, the host appears to be a bulge-dominated system. Like MS 1403.5+5439, Schade et al. (2000) conclude that the host is an elliptical galaxy.
MS 1420.1+2956 (Fig. 11.32) — The host galaxy is decomposed of a small bulge (02), a bar, and a disk with spiral arms. The bar and disk are modeled with the hybrid method.
MS 1455.7+2121 (Fig. 11.32) — The host galaxy has a bulge ( mag) and a disk with spiral arms. However, based on the HST and ground-based images, Schade et al. (2000) argue that the host is an elliptical galaxy.
MS 1456.4+2147 (Fig. 11.32) — A single bulge ( mag) is sufficient to describe the host galaxy, while a fit with a bulge ( mag) and a disk also works reasonably well.
MS 1519.80633 (Fig. 11.32) — We fit the host galaxy with a bulge, a bar, and a disk with spiral arms. The best fit yields that the ratio is as large as 0.14. Schade et al. (2000) find significantly larger ( 0.56) possibly because they do not model the bar, which may then be included as part of the bulge component.
MS 1545.3+0305 (Fig. 11.33) — The host galaxy is fit with a tiny bulge, a ring like structure (modeled with the hybrid method) and a disk with spiral arms. Due to the complexity of the host structure, the fit might be uncertain. Schade et al. (2000) derive a bulge that is 1 mag brighter than our measurement.
MS 1846.57857 (Fig. 11.33) — The object extends a bit outside of PC chip field-of-view, which makes the fit somewhat uncertain. The best fit finds a pseudo-bulge (), a bar, and a disk. Like MS 1519.80633, the decomposition without including bar yields significantly brighter bulge component (Schade et al. 2000).
MS 2039.50107 (Fig. 11.33) — The host galaxy shows tidal features. While we fit the host with a tiny bulge (01) and a disk, Shade et al. (2000) conclude that the host is an elliptical galaxy.
MS 2128.3+0349 (Fig. 11.33) — A few pixels in the center are saturated. The host galaxy is fit with a single bulge component. However, a two components model also works reasonably well. Schade et al. (2000) also classify the host as an elliptical galaxy.
MS 2144.92012 (Fig. 11.34) — The host galaxy is fit with a bulge, an inner disk and an outer disk with spiral arms. We tried to use a bar instead of a exponential profile for the inner disk, but it was unhelpful. Instead, the inner disk may just be oval in shape. Schade et al. (2000) use two components (bulge+disk) to fit the host and derive a brighter bulge ( mag) than our measurement ( mag).
MS 2159.55713 (Fig. 11.34) — The host galaxy is fit with a pseudo-bulge () and a disk with spiral arms. The central part shows dust lanes. Although Schade et al. derive a higher than our measurement, both studies agree that the host is a bulge-dominated system.
MS 2210.2+1827 (Fig. 11.34) — The host galaxy appears to have a small bulge (016).
MS 2254.93712 (Fig. 11.34) — The host galaxy has a pseudo-bulge and a disk with faint spiral arms. The fitting results are in good agreement with those from Mathur et al. (2012).
MS 2340.91511 (Fig. 11.35) — The host galaxy is fit with a single bulge (17.47 mag), while a different fit with two components, where the bulge is as bright as 18.13 mag and , works equally well. However, in both cases there are systematically positive residuals at large radii. Mathur et al. (2012) use the same HST dataset to estimate the bulge luminosity of the host galaxy and conclude that the host has two components (bulge+disk), with a relatively larger .
MS 2348.3+3250 (Fig. 11.35) — The best fit finds that the host galaxy is well-fit with two components with a bulge ( mag) and a disk. But the fit using a single component bulge ( mag) is also acceptable. Schade et al. (2000) classify the host as an elliptical galaxy.
MS 2348.6+1956 (Fig. 11.35) — The host galaxy has a bulge, a bar, and a disk with spiral arms.
NGC 1019 (Fig. 11.35) — The WFPC2 mosaic image is saturated in the center. The host galaxy has a bulge, a bar, and an outer disk with spiral arms. We use hybrid method to model the bar and the disk. Crenshaw et al. (2003) also classify the host as a barred spiral galaxy. There might be a small inner ring in the center. We simultaneously fit a neighboring galaxy using an exponential profile.
NGC 3227 (Fig. 11.36) — The host galaxy extends outside the FOV of the chip. While the host galaxy is fit with a disturbed pseudo-bulge and a disturbed disk, the fit might be uncertain because of the prominent dust lanes and the small field of view of the image, as was also pointed out in Ho & Kim (2014). In contrast, Kormendy & Ho (2013) and Virani et al. (2000) derive a lower ().
NGC 3516 (Fig. 11.36) — The mosaic image of WFPC2 is saturated in the center and the border lines between chips are masked out in the fit. The host galaxy appears to have a pseudo-bulge (), a bar, and a disk. We find that , which is slightly lower than that () derived by Bentz et al. (2009) using the HST image obtained with a blue filter (F550M). Virani et al. (2000) find using the ground-based -band image.
NGC 3783 (Fig. 11.36) — Like NGC 3227, the host galaxy does not fully fit within the FOV of the image. It might have a large ring-like structure just outside the FOV. The host galaxy is fit with a pseudo-bulge () and a disk. While we find , Bentz et al. (2009) obtain .
NGC 3982 (Fig. 11.36) — The host galaxy has a pseudo-bulge and a disk with spiral arms, while the nucleus appears to be very faint. An optimal PSF is generated by an IDL procedure (Rhodes et al. 2006, and 2007; http://www.astro.caltech.edu/ rjm/acs/PSF/). Using a ground-based -band image, Virani et al. (2000) find , which is slightly larger than our measurement ().
NGC 4051 (Fig. 11.37) — The fit can be highly uncertain due to the presence of a dust lane. The host is fit with a pseudo-bulge () and a disturbed disk. We find mag, which is in good agreement with Virani et al. (2000). However, Bentz et al. (2009) obtain a significantly brighter bulge ().
NGC 4151 (Fig. 11.37) — The host galaxy is fit with a classical bulge ( mag; ) and a disk (). Owing to the prominent dust lanes and the small FoV of the HRC image, the fitting results may be uncertain. Based on fitting the same HST image, Bentz et al. (2009) find a brighter bulge ( mag) with a much higher (). Using the ground-based images, Virani et al. (2000) find .
NGC 5548 (Fig. 11.37) — The host galaxy is fit with a bulge component and a disk with spiral arms. Bentz et al. (2009) use two components (inner and ordinary bulges) to model the bulge; our bulge component is consistent with their inner bulge. The sum of two bulge components in Bentz et al. is 3.3 times brighter than ours. In terms of measurements, the fitting result in Virani et al. (2000) appears to be in between our and Bentz et al. (2009).
NGC 5940 (Fig. 11.38) — Because the WFPC2 mosaic image is heavily saturated in the center the fitting result might be unreliable. The host galaxy is well-fit with a pseudo-bulge (), and a disk with spiral arms. An additional bar does not help. Using a ground-based image, Virani et al. (2000) find a slightly larger () compared to our measurement (). It may be that they overestimated the bulge brightness by underestimating the nucleus brightness due to PSF mismatch.
NGC 6104 (Fig. 11.38) — The fit is done with a WFPC2 mosaic image. The host galaxy has a pseudo-bulge (), and a disk with spiral arms. An additional bar for the host is not helpful. The host appears to be an interacting galaxy (Peletier et al. 1999).
NGC 6212 (Fig. 11.38) — The fit is done on a mosaic WFPC2 image. The host galaxy is fit with a pseudo-bulge () and a disk. While the host is often regarded as an elliptical galaxy (e.g., Biermann et al. 1985), the HST image clearly reveals flocculent spiral arms (Malkan et al. 1998).
PG 0003+199 (Fig. 11.39) — We fit the host galaxy with a bulge ( mag) and a disk. Alternatively, if the host is fit with a single bulge, the magnitude is mag. However doing so reveals signs of an extended disk in the residual. Bentz et al. (2009) also find that the host galaxy has an extended disk component. However, they find a slightly brighter bulge ( mag).
PG 0026+129 (Fig. 11.39) — While the host galaxy is well-fit with a single bulge, it also can be fit with a small bulge and a disk (B/T ¿ 0.69). There is a slight PSF mismatch which may cause a discrepancy between the host magnitude from the best fit and that from the aperture photometry. Bentz et al. (2009) use two nuclei and a single Sérsic component to model the central point source and the host, respectively. Other studies also show that the host is an elliptical galaxy (McLeod & McLeod 2001, Guyon et al. 2006; Veilleux et al. 2009).
PG 0844+349 (Fig. 11.40) — The host galaxy has a bulge component and a disk with spiral arm. Adding a bar is not helpful. Our best-fit model yields that the bulge magnitude is mag, while the study of Bentz et al. (2009) finds the bulge ( mag) to be slightly fainter than our measurement for the bulge.
PG 0921+525 (Fig. 11.40) — The host appears to be a disk galaxy () and has a relatively small km s-1(Ferrarese et al. 2001).
PG 1001+291 (Fig. 11.41) — The host galaxy fit finds a tiny bulge ( pix), a bar, and a disk with spiral arms. As there is a significant PSF mismatch as shown in the residual image, the brightness of nucleus might be underestimated. Boyce et al. (1999) claim that the host can either be a barred spiral galaxy or a disturbed galaxy with signs of tidal interactions. Owing to the large size of the spiral features ( kpc), Boyce et al. conclude that the latter is more favorable. However, the tidal features appear to be symmetric, like well defined spiral arms. The scale-length of the disk ( kpc) is consistent with that expected for massive early spiral galaxies (de Jong et al. 2004).
PG 1202+281 (Fig. 11.42) — The image is saturated in the center. Bahcall et al. (1997) classify the host as an elliptical galaxy.
PG 1229+204 (Fig. 11.43) — There is a faint tidal tail which might be evidence of interaction or minor merging. The host galaxy is fit with a pseudo-bulge () and a disk. We find . Based on the HST NIR image, Veilleux et al. (2009) reach a similar conclusion ().
PG 1302102 (Fig. 11.43) — The image is highly saturated in the core. While we fit the host galaxy with a single bulge, significant structures remain in the residual image (Kim et al. 2008b). Guyon et al. (2006) also classify the host as an elliptical galaxy, but Veilleux et al. (2009) conclude that the morphology is ambiguous.
PG 1351+695 (Fig. 11.44) — The host galaxy has a disturbed bulge () and a disturbed disk (), which might be caused either by interaction or dusty lanes. While the best-fit model yields and , previous studies (Bentz et al. 2009; Bennert et al. 2010; Orban de Xivry et al. 2011) suggest a slightly higher ().
PG 1402+261 (Fig. 11.44) — The image is highly saturated, thus the fitting result may be unreliable. The host galaxy is fit with a pseudo-bulge (), a bar, and a disk with spiral arms. Bahcall et al. (1997) also classify the morphology of the host galaxy to be an SBb.
PG 1416129 (Fig. 11.45) — The image is saturated at the center. A single bulge component is sufficient to model the host galaxy. Although Schade et al. (2000) find that the host is well fit with an additional disk, the ratio of means that it is a bulge-dominated (early-type) galaxy. Using ground-based images, Jahnke et al. (2004) argue that the host galaxy is an elliptical galaxy.
PG 1426+015 (Fig. 11.45) — Although the host galaxy has a highly disturbed appearance it can be fit with a single Sérsic component, suggesting that it is a disturbed elliptical galaxy. We simultaneously fit the merging galaxy with three components. Guyon et al. (2006) also classify the host an an elliptical galaxy. However, Schade et al. (2000) use two components to fit the host ().
PG 1434+590 (Fig. 11.45) — The FoV of the HST image is not large enough to cover the outer part of the host galaxy, making the analysis uncertain. The host galaxy apparently has a small bulge (, mag), a bar and a disk with spiral arms. Crenshaw et al. (2003) also classify the host as being a barred galaxy. Without using a bar component, Bentz et al. (2009) and Bennert et al. (2010) find a slightly fainter bulge ( mag).
PG 1440+356 (Fig. 11.46) — The host galaxy has a pseudo-bulge (17.07 mag, ) and a disk. Guyon et al. (2006) and Mathur et al. (2012) also find that the disk component is required to model the host galaxy adequately.
PG 1534+580 (Fig. 11.46) — The WFPC2 mosaic image is saturated in the center. The host galaxy is fit with a bulge and a disk components. However, a single component bulge fit also appears to be reliable. Earlier studies (Orban de Xivry et al. 2011; Bentz et al. 2013) also suggest that the host galaxy is well-fit with two components (bulge+disk).
PG 1545+210 (Fig. 11.46) — Also known as 3C323.3, this is a radio-loud QSO. The image is slightly saturated in the center. The host galaxy is fit with a single bulge, but another fit with two components also works reasonably well. There are positive residuals in the 1-D profile due to a companion galaxy. Bahcall et al. (1997) also classify the host as an elliptical.
PG 1613+658 (Fig. 11.47) — The host galaxy is highly disturbed and has double nuclei. It appears that the host galaxy can be well-fit with a single component bulge modified by large Fourier amplitudes (). Guyon et al. (2006) and Bentz et al. (2009) also classify the host as an elliptical galaxy.
PG 1617+175 (Fig. 11.47) — While multiple HST images taken with different instrument configuration are available for this object, we use the deeper ACS/WFC images in our analysis. The best-fit model finds the host galaxy is a single component bulge. Other studies also categorize this object as an elliptical galaxy (Guyon et al. 2006; Bentz et al. 2009; Veilleux et al. 2009).
PG 1700+518 (Fig. 11.47) — Although the host galaxy is fit with three components to account for the tidally disturbed features, the galaxy is bulge dominated (). Previous studies also findthat the host is either a disturbed elliptical or bulge-dominated galaxy (Guyon et al. 2006; Bentz et al. 2009; Veilleux et al. 2009).
PG 2130+099 (Fig. 11.47) — The host galaxy has a pseudo-bulge () and a disturbed disk. The outer disk has a low Sérsic index which might be due to the outer ring. The bulge magnitude spans from 17.8 to 18.9 mag according to previous studies (Bentz et al. 2009; Bennert et al. 2010), while the best-fit model from this study yields mag.
PKS 031277 (Fig. 11.48) — The image is saturated in the center, thus the fit might be uncertain. The host galaxy is a single component bulge, but a fit with two components also works reasonably well. Boyce et al. (1998) and Veron-Cetty & Woltjer (1990) classify the host as an elliptical type.
PKS 051845 (Fig. 11.49) — The WFPC2 mosaic image is saturated in the center. The host galaxy has a bulge and a disk. Using the ground-based images, Zirbel et al. (1996) claim that the host has a de Vaucouleurs profile (). However, Inskip et al. (2010) find that a disky model () is more appropriate to represent the host, which is consistent with this study.
POX 52 (Fig. 11.50) — The host galaxy is fit with a single bulge with . There is a blob in the central region. Thornton et al. (2008) also analyze the same HST image with GALFIT. While our galaxy parameters are in good agreement to within the errors, their nuclear luminosity is brighter by 0.4 mag. While the origin of the discrepancy is unclear, it is possible that our method to broaden the images could alleviate the PSF mismatch significantly.
RX J1117.1+6522 (Fig. 11.51) — The host galaxy is modeled with a bulge and a disk with spiral arms. While the best-fit model finds that the host is a bulge-dominated spiral galaxy (), Mathur et al. (2012) suggest the bulge fraction is fairly modest ().
RX J1209.8+3217 (Fig. 11.51) — The host galaxy model is of a single bulge component. The residual image reveals a ring-like feature in the center. Based on the same HST images, Mathur et al. (2012) also find that the host is well represented by a single component with a small Sérsic index ().
RX J1702.5+3247 (Fig. 11.51) — The host galaxy has a tiny single bulge ( 007). Its effective radius is comparable to FWHM of the PSF. However, the study by Mathur et al. (2012) show that the host is well represented by a spiral galaxy with a bulge.
RX J2216.84451 (Fig. 11.51) — The host galaxy is modeled with a pseudo-bulge, a disk, and a ring like structure. Owing to the ring, there are sharp discontinuities in the 1-D profile. Mathur et al. (2012) find a slightly larger .
RX J2217.95941 (Fig. 11.52) — The host galaxy is fit with a bulge and a disk with spiral arms. Clearly the host is interacting with a companion galaxy. The best-fit parameters are in good agreement with those in Mathur et al. (2012).
SDSS 003043.59103517.6 (Fig. 11.52) — The host galaxy model has a pseudo-bulge (), a bar, and a disk with spiral arm, components. The optimal psf is generated by IDL procedure (Rhodes et al. 2006, and 2007; http://www.astro.caltech.edu/ rjm/acs/PSF/). Cales et al. (2011) find that the bulge is relatively large (23) compared to our measurement (03). While it is unclear what caused this discrepancy, visual inspection shows that the size of the bulge ought to be be smaller than 1″.
SDSS 005739.19+010044.9 (Fig. 11.52) — The host galaxy model has a pseudo-bulge () and a disk with spiral arm components. Cales et al. (2011) also classify the host galaxy as a grand-design spiral galaxy.
SDSS 020258.94002807.5 (Fig. 11.52) — The host galaxy has very complicated features (tidal tails, spiral arms and SF arc; Cales et al. 2011). We fit it with a pseudo-bulge, a disk and another disk with spiral arms.
SDSS 021447.00003250.6 (Fig. 11.53) — Since the host galaxy has complicated features, the fit might be rather uncertain. There is a companion galaxy but whether it is interacting with the host galaxy is unknown. While we model the host with a bulge and a disk (), Cales et al. (2011) argue that the host is a bulge-dominated galaxy ().
SDSS 023700.30010130.5 (Fig. 11.53) — The host galaxy model consists a pseudo-bulge, a disk with spiral arms, and a ring-like structure. We also fit three unresolved objects simultaneously, which are not considered part the host. Cales et al. (2011) use a bulge and a disk to model the host galaxy, finding that the host galaxy is bulge-dominated ().
SDSS 040210.90054630.3 (Fig. 11.53) — The host galaxy fit consists a bulge, an outer disk, and another inner disk with spiral arms. Our finding that the host galaxy is disk-dominated () is in good agreement with Cales et al. (2011).
SDSS 074621.06+335040.7 (Fig. 11.53) — The host galaxy is fit with either a single bulge ( mag; ) or a small blob with a disk (19.61 mag).
SDSS 075521.30+295039.2 (Fig. 11.54) — The host galaxy model has a pseudo-bulge (), a disk, and a another disk with spiral arms. The bulge luminosity does not change significantly even though the fit is done with a bulge and a disk. Cales et al. (2011) also argue that the host light is disk-dominated ().
SDSS 081018.67+250921.2 (Fig. 11.54) — The image is slightly saturated in the center. The host galaxy appears to be highly disturbed but is well-fit with a bulge (), a disturbed disk, and two fine structures. It is unclear whether the bulge can be classified as a pseudo-bulge or classical bulge based on the Sérsic index and (). Cales et al. (2011) find that the host is a bulge-dominated galaxy ().
SDSS 105816.81+102414.5 (Fig. 11.54) — The host galaxy has a single bulge component, but a fit with two components also works reasonably well. The bulge luminosity can either be 18.56 mag for a single component bulge, or 18.63 mag from B/D decomposition. Cales et al. (2011) also classify the host as a bulge-dominated galaxy.
SDSS 115159.59+673604.8 (Fig. 11.54) — The host galaxy model consists a tiny pseudo-bulge (012; ), a bar, and a disk.
SDSS 115355.58+582442.3 (Fig. 11.55) — A single bulge component is sufficient to fit the host galaxy.
SDSS 123043.41+614821.8 (Fig. 11.55) — The host galaxy is fit with a bulge () and a disk component. The ratio is relatively large (), and Cales et al. (2011) find that the host is likely to be an early-type galaxy. There are several nearby companions, but it is unclear whether they are associated with the host galaxy.
SDSS 124833.52+563507.4 (Fig. 11.55) — There are fine structures in the host galaxy, including shells and tidal features. The host galaxy is modeled using a classical bulge component and a disk with spiral arms.
SDSS 145640.99+524727.2 (Fig. 11.55) — The host galaxy has a pseudo-bulge (), a bar, and a disk with spiral arms in the model. The result shows a , which is consistent with Cales et al. (2011).
SDSS 145658.15+593202.3 (Fig. 11.56) — This is a merging system with companion galaxies so the fit may be uncertain. The host galaxy has a pseudo-bulge () and a disk with disturbed spiral arms. The closest companion model consists a unresolved nucleus and a disk with spiral arms. The second companion is fit with a disk with disturbed spiral arms. Finally, the other companion that is slightly apart from the host is fit with a disk.
SDSS 154534.55+573625.1 (Fig. 11.56) — The host galaxy is fit with a pseudo-bulge (), a disk, and a ring-like, components.
SDSS 164444.92+423304.5 (Fig. 11.56) — The image shows some weak signatures of interaction. The host is well-fit using a single bulge component. A fit with two components produces a bulge magnitude of 20.18, but it is not obvious that this model is more appropriate than the one component model. Cales et al. (2011) also classify this host galaxy as an early-type.
SDSS 170046.95+622056.4 (Fig. 11.56) — This object appears to be a merging system. The host galaxy is fit with a pseudo-bulge () component and a disk. We simultaneously fit the neighboring companion. Cales et al. (2011) also conclude that the host is a disk-dominated galaxy.
SDSS 210200.42+000501.8 (Fig. 11.57) — This object is a merging system. The host galaxy model consists a pseudo-bulge and a disk with spiral arms. While our model finds that the host is disk dominated (), Cales et al. (2011) argue that it is more likely to be bulge dominated ().
SDSS 212843.42+002435.6 (Fig. 11.57) — The object resides in merging system, possibly associated with 3 companion galaxies. We fit the host galaxy with a single Sérsic profile (19.72 mag; ). Cales et al. (2011) also find that the host is an early-type galaxy.
SDSS 230614.18010024.4 (Fig. 11.57) — The host galaxy has a bulge with a small Sérsic index () and a disk with spiral arms. However, the ratio is relatively large (). Cales et al. (2011) conclude also that the host galaxy is bulge-dominated ().
SDSS 234403.55+154214.0 (Fig. 11.57) — We fit the host galaxy with a pseudo-bulge component () and a disk with spiral arms.
TOL 1059+105 (Fig. 11.58) — The image is slightly saturated at the center. There is a neighboring galaxy whose association with the host galaxy is unclear. The host is fit with a bulge and a disk component. Crenshaw et al. (2003) classify the host as an S0 galaxy.
TOL 1347+023 (Fig. 11.58) — The image is saturated in the center. The fit consists a bulge and two disk components.
TOL 2327027 (Fig. 11.58) — The fit uses a WFPC2 mosaic image. The host galaxy model consists a bulge, a bar, an inner disk, and an outer disk with spiral arms. We use the hybrid method to merge the bar and two disk components. There are dust lanes in the center.
UGC 3223 (Fig. 11.58) — The WFPC2 mosaic image is saturated at the center. Model fitting finds that the host galaxy has a bulge, a bar, and a disk with spiral arms. The host is classified as a barred spiral galaxy (SBa) from de Vaucouleurs et al. (1991).
UGC 10683B (Fig. 11.59) — The WFPC2 mosaic image is saturated at the center. While it is not present in the HST image, there is a companion galaxy located 1 kpc away from UGC 10683B. The host galaxy is fit with a bulge, an inner disk, and another outer disk component with spiral arms. Although the host appears to be a disk-dominated galaxy () the bulge has a relatively large Sérsic index ().
WAS 45 (Fig. 11.59) — The WFPC2 mosaic image is saturated in the galaxy center, which is located on the WF4 chip. The host galaxy is fit with a pseudo-bulge () and two disks components with spiral arm.