NuSTAR hard X-ray observation of the gamma-ray binary candidate HESS J1832-093
Abstract
We present a hard X-ray observation of the TeV gamma-ray binary candidate HESS J1832093 coincident with supernova remnant (SNR) G22.70.2 using the Nuclear Spectroscopic Telescope Array (NuSTAR). Non-thermal X-ray emission from XMMU J1832450921539, the X-ray source associated with HESS J1832093, is detected up to keV and is well-described by an absorbed power-law model with the best-fit photon index . A re-analysis of archival Chandra and XMM-Newton data finds that the long-term X-ray flux increase of XMMU J1832450921539 is % (90% C.L.), much less than previously reported. A search for a pulsar spin period or binary orbit modulation yields no significant signal to a pulse fraction limit of % in the range 4 ms ks. No red noise is detected in the FFT power spectrum to suggest active accretion from a binary system. While further evidence is required, we argue that the X-ray and gamma-ray properties of XMMU J1832450921539 are most consistent with a non-accreting binary generating synchrotron X-rays from particle acceleration in the shock formed as a result of the pulsar and stellar wind collision. We also report on three nearby hard X-ray sources, one of which may be associated with diffuse emission from a fast-moving supernova fragment interacting with a dense molecular cloud.
1. Introduction
High energy gamma-ray surveys using ground-based Cherenkov telescopes (e.g., MAGIC, H.E.S.S, and VERITAS) have uncovered a rare subclass of TeV binary systems (Dubus, 2013, 2015). Whereas the majority of the identified Galactic TeV sources are associated with either pulsar wind nebulae (PWNe) or supernova remnants (SNRs), six gamma-ray binaries have been detected above GeV. These include, PSR B1259-63, LS 5039, LS I61 303, HESS J0632057, 1FGL J1018.65856 and, most recently, PSR J20324127 (Aharonian et al., 2005, 2006; Albert et al., 2009; Aharonian et al., 2007; H. E. S. S. Collaboration et al., 2015; Lyne et al., 2015). These sources are all identified as non-accreting binaries harboring an O or B main sequence star and a compact object, with a wide range of orbital periods from 3.9 days to years. With the exception of PSR B125963 and PSR J20324127, both of which are known to have radio pulsars, the nature of the compact object, whether a neutron star (NS) or black hole (BH), remains unknown.
Gamma-ray emission from TeV binaries are generally thought to originate from particle acceleration in the shock formed between the stellar wind and the pulsar wind (Tavani et al., 1994; Sierpowska-Bartosik & Torres, 2008; Dubus, 2013). Both X-ray and gamma-rays result from synchrotron and inverse Compton scattering in the interaction region, respectively, and show a strong dependence on orbital phase. Other scenarios such as the microquasar model (Romero et al., 2003; Bosch-Ramon & Paredes, 2004) are less plausible since the spectral and timing properties are similar in all TeV gamma-ray binaries, including the two containing radio pulsars (Dubus, 2013). Multi-wavelength monitoring of the gamma-ray binaries in the X-ray, GeV and TeV bands revealed the complex emission mechanisms and geometry (Kaspi et al., 1995; Chernyakova et al., 2006a, 2009; Uchiyama et al., 2009; Chernyakova et al., 2006b; Takahashi et al., 2009; Kishishita et al., 2009; Rea & Torres, 2011; Aliu et al., 2014; Li et al., 2011; An et al., 2013, 2015; Ho et al., 2017). A number of theoretical models, including numerical hydrodynamics simulations, have been developed to account for the orbital dependence of the X-ray and gamma-ray spectra via anisotropic radiation processes, relativistic Doppler boosting and inhomogeneous stellar winds (Dubus et al., 2015; Takata et al., 2017; de la Cita et al., 2017). Studying these rare gamma-ray binaries not only probes the unique environment of the pulsar and stellar winds interaction but also sheds light on the (short) X-ray binary evolution stage before they become “regular” accretion powered high-mass X-ray binaries (HMXBs) (Dubus, 2013).
The unresolved TeV point source HESS J1832093 was discovered in the vicinity of SNR G22.70.2 suggesting a possible association (Abramowski et al., 2015). However, follow-up X-ray observations favored a binary origin for the TeV emission (Eger et al., 2016). The bright X-ray source XMMU J1832450921539 (XMMJ183245 herein) lies within the gamma-ray error circle (Abramowski et al., 2015) and is associated with a Chandra point source (Eger et al., 2016). The latter authors reported a large, factor of 4, increase in the Chandra flux relative to the earlier XMM-Newton measurement that seemed to rule out the PWN or SNR scenario for the X-rays. Instead, the coincidence of a bright IR source at the Chandra coordinates, a plausible counterpart, suggests a binary scenario for powering the gamma-ray emission (Eger et al., 2016).
In this paper, we present a NuSTAR X-ray observation of the field containing HESS J1832093, along with a re-analysis of the archival XMM-Newton and Chandra data. Observational details of these data sets are given in §2. Spectroscopy and timing results on XMMJ183245 are reported in §3 and §4, respectively. Our analysis of archival Chandra data refute reports in previous work of large flux variations. Nevertheless, we find sufficient evidence to prefer the TeV gamma-ray binary scenario for HESS J1832093. A timing analysis detailed in §4 places upper limits on any probable pulsar or binary signal. We also present the analysis, in §5, of three nearby hard X-ray sources. We discuss the nature of HESS J1832093 and the hard sources in §6. Finally, we summarize our results in §7.
2. NuSTAR observation and data reduction
An 87 ks NuSTAR observation of the field containing HESS J1832093 was obtained on 2016 March 21 as part of the NuSTAR TeV survey project. NuSTAR consists of two co-aligned X-ray telescopes, with corresponding focal plane modules FPMA and FPMB that provide FWHM imaging resolution over a 3–79 keV X-ray band, with a characteristic spectral resolution of 400 eV FWHM at 10 keV (Harrison et al., 2013). The reconstructed NuSTAR coordinates are accurate to at the 90% confidence level. The nominal timing accuracy of NuSTAR is 2 ms rms, after correcting for drift of the on-board clock, with the absolute timescale shown to be better than ms (Mori et al., 2014; Madsen et al., 2015).
The data was processed and analysed using the FTOOLS 09May2016_V6.19 software package including (NUSTARDAS 14Apr16_V1.6.0) with NuSTAR Calibration Database (CALDB) files of 2016 July 6. No flares were evident during the observation, resulting a total of 86.9 ks of net usable exposure times spanning 171.5 ks. For all following spectral analysis, extracted spectra, grouped into appropriate channels, were fitted using the XSPEC (v12.8.2) package (Arnaud, 1996). These fits make use of the TBabs absorption model in XSPEC with the wilm Solar abundances (Wilms et al., 2000) and the vern photoionization cross-section (Verner et al., 1996). statistics were used to evaluate the spectral fits. All errors quoted herein are for 90% confidence level (C.L.).
The NuSTAR background contamination is highly variable across the focal plane of the two FPM detectors. We use the nuskybgd software (Wik et al., 2014) to help model the spatial and energy dependent cosmic X-ray and a detector background. This allows us to generate, for each detector, a model energy-resolved background map for image analysis and background spectra at the source location for our spectral analysis. The background model components are normalized by simultaneously fitting NuSTAR spectra in three source-free regions. The nuskybgd model fit to the source-free spectra yields (1472 dof) without apparent Fe lines at E 6-7 keV which is indicative of the Galactic ridge X-ray emission (Mori et al., 2015). In addition, as shown in §3, NuSTAR module A and B spectra of the brightest X-ray source in the FOV (XMMU J1832450921539) jointly fit by an absorbed power-law model show their relative flux normalization is 2%. The 2% flux discrepancy between the two module spectra is not only below the statistical errors (3%) but also it indicates that any additional background component unaccounted for by the nuskybgd model has a negligible contribution of less than 2% in the 3-30 keV band where all our imaging and spectral analysis are performed.
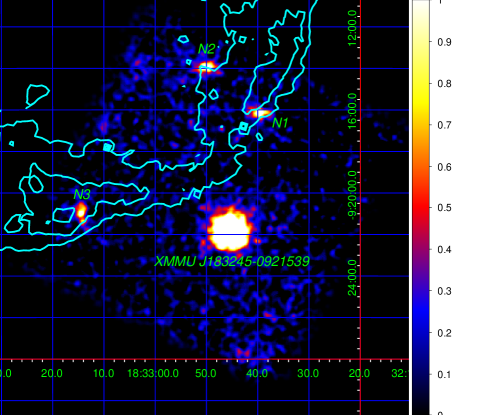
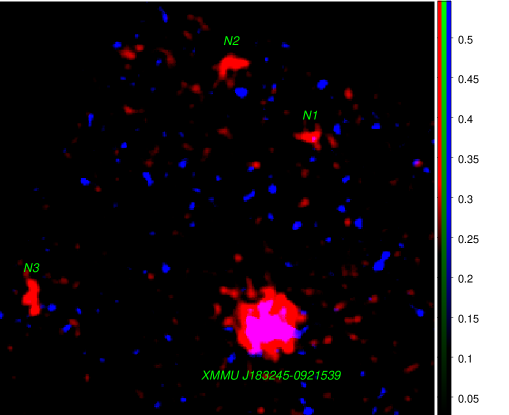
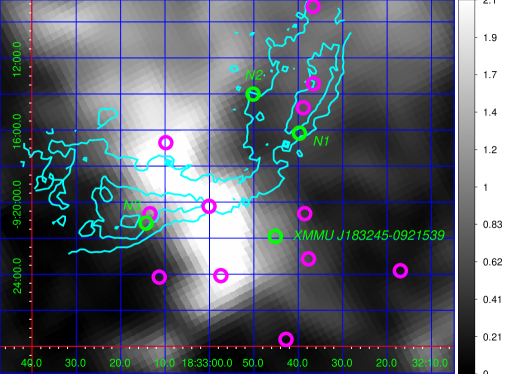
Figure 1 presents the combining background-subtracted, exposure-corrected smoothed NuSTAR images from the two detector modules, in the 330 keV energy band. Using wavdetect, we detected four sources, including the X-ray counterpart XMMJ183245 to HESS J1832093. Interestingly, the other three NuSTAR sources (N1, N2 and N3 hereafter), all of which have XMM-Newton counterparts, overlap with the radio shell of SNR G22.70.2 (see Figure 1, cyan contours). Above 20 keV, only XMMJ183245 is visible in the NuSTAR images (see Figure 2 for two-color NuSTAR images in 10-20 and 20-30 keV bands). Based on the 3XMM source catalog (Rosen et al., 2016), we found that the four NuSTAR sources are the brightest among about a dozen XMM-Newton point sources in the NuSTAR field of view.
We also analyzed archival XMM-Newton and Chandra observations of the HESS J1832093 field. A 17 ks XMM-Newton exposure (ObsID #0654480101) was obtained on 2011 March 13 and an 18 ks Chandra pointing (ObsID #16737) was acquired on 2015 July 6. Details of these observations and their analysis can be found in Abramowski et al. (2015) and Eger et al. (2016), respectively. Although Swift observations overlap with the vicinity, their short exposures result in few photons (15-26 cts) to measure a flux accurately. As reported in Eger et al. (2016), these data suggest no evidence of large flux variability among 4 data sets spanning 2008 Feb 28 to 2015 Sep 26.
| Data Set | FluxaaAbsorbed flux for the 210 keV band in units of erg cm-2 s-1. Uncertainties are estimated using the XSPEC flux command for the 90% confidence level | FluxaaAbsorbed flux for the 210 keV band in units of erg cm-2 s-1. Uncertainties are estimated using the XSPEC flux command for the 90% confidence level | FluxaaAbsorbed flux for the 210 keV band in units of erg cm-2 s-1. Uncertainties are estimated using the XSPEC flux command for the 90% confidence level | (dof) | ||
|---|---|---|---|---|---|---|
| (Fitted Band, Observation date) | ( cm-2) | XMM-Newton | Chandra | NuSTAR | ||
| (EPIC pn) | (ACIS) | (FPMA) | ||||
| (EPIC MOS) | (FPMB) | |||||
| XMM-Newton (28 keV, 2011 March 13) | bbColumn density is fixed to the best-fit value obtained from a simultanous spectral fit to the combined XMM-Newton + Chandra + NuSTAR data. Errors are given for 2 interesting parameters at the 90% C.L. | 6.6(5.6-7.2) | … | … | 0.97(41) | |
| 6.4(5.4-7.1) | … | … | ||||
| Chandra (28 keV, 2015 July 6) | bbColumn density is fixed to the best-fit value obtained from a simultanous spectral fit to the combined XMM-Newton + Chandra + NuSTAR data. Errors are given for 2 interesting parameters at the 90% C.L. | … | 7.7(6.1-8.5) | … | 0.81(16) | |
| NuSTAR (330 keV, 2016 March 21) | bbColumn density is fixed to the best-fit value obtained from a simultanous spectral fit to the combined XMM-Newton + Chandra + NuSTAR data. Errors are given for 2 interesting parameters at the 90% C.L. | … | … | 9.6(9.1-10.0) | 1.0(151) | |
| 9.7(9.3-10.1) | ||||||
| Chandra + XMM-Newton (28 keV)ccWe linked column density and photon index between the different spectra. | 6.2(2.6-6.7) | 8.9(3.8-9.5) | … | 1.0(57) | ||
| 5.9(2.6-6.4) | ||||||
| XMM-Newton + Chandra + NuSTAR (230 keV)ccWe linked column density and photon index between the different spectra. | 9.4(9.0-9.8) | 1.0(112) | ||||
| 9.6(9.1-10.0) |
3. Spectral analysis of XMMU J1832450921539
We extracted NuSTAR spectra of XMMJ183245 from a ′′ region and generated NuSTAR response matrix and ancillary response files using nuproducts. We created a model background spectrum for each of the source regions using the nuskybgd tool. As a result, the flux normalization for spectra extracted from the two modules match within 2% of each other. These spectra are grouped with at least 30 counts in each fitted channel bin.
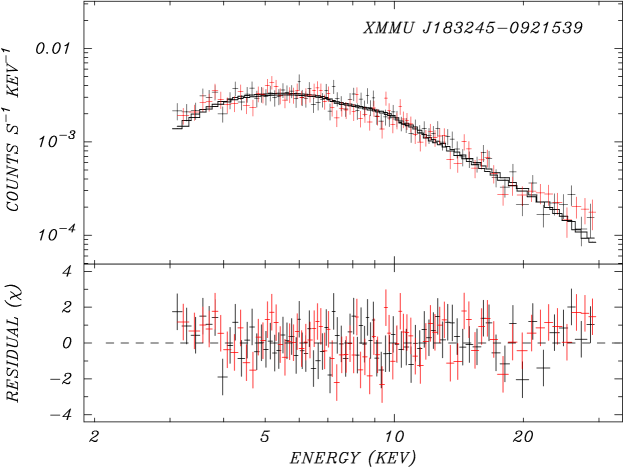
The NuSTAR spectra of XMMJ183245 extend up to 30 keV, above which the background dominates, and is well-fit to an absorbed power-law model. However, the column density derived from these data is found to be unconstrained, with 100% uncertainties. This is also the case for individual fits to the Chandra and NuSTAR data on XMMJ183245. Instead, for all subsequent spectral fits to individual data sets, we hold the column density fixed to cm-2. This value results from a simultaneous fit to the NuSTAR, XMM-Newton, and Chandra spectra, as described in the next section. For this nominal column density we obtain a best-fit photon index of for the NuSTAR spectra, with a fit statistic of =1.0 (151 dof). This yields an absorbed 210 keV flux of erg cm-2 s-1 for the FPMA spectrum and similar result for other module. No significant spectral break or cutoff was detected. A summary of all the spectral results for XMMJ183245 obtained herein is given in Table 1.
To explore flux and spectral variations of XMMJ183245 on short timescales ( hour), we repeated our spectral fits to NuSTAR data extracted from four equally-divided intervals of the light curve (20 ks each) in the 330 keV energy range. However, no significant change is found in the flux or photon index during the observation. A similar result is obtained for spectra in the 1030 keV bands, where any effects of low energy absorption is expected to be negligible. We conclude that there was no spectral variation during the NuSTAR observation to the limit of measurement uncertainties.

To quantify the long-term flux and spectral variability of XMMJ183245 we compare result of our NuSTAR observations with the archival XMM-Newton and Chandra data sets spanning a total of 5 years. For each mission, we follow the standard reduction and analysis procedures. For Chandra, we used the specextract script to extract ACIS source counts from a region file and to generate the spectrum and its response files for the point source. We fit the resulting spectrum to the absorbed power-law model with the column density fixed to the nominal value and obtain best-fit photon index of and a 210 keV flux of erg cm-2 s-1. The magnitude of this flux falls within of the value obtained a year later using NuSTAR data (see Table 1) but notably times less than that reported in Eger et al. (2016)111We note that we obtain a similar number of extracted counts (409 cts, keV) for our spectrum as recorded by Eger et al. (2016) in their Table 1 (416 cts). As a check, we entered the derived counts rate and spectral parameters into PIMMS222http://cxc.harvard.edu/toolkit/pimms.jsp, allowing for the 4.9% deadtime in the ACIS 1/8 subarray observing mode. This verified the flux result presented here.
For the XMM-Newton analysis, we extracted EPIC pn and MOS spectra using a ′′ aperture around XMMJ183245. Background spectra were extracted from an annulus region around the source. A joint fit to the PN and merged MOS spectra in the 28 keV band with the nominal absorbed power-law model yielded a photon index of and a 210 keV flux erg cm-2 s-1 for the EPIC pn spectra and similar for the MOS fits, with a fit statistic of for 41 DoF, confirming the results of Abramowski et al. (2015).
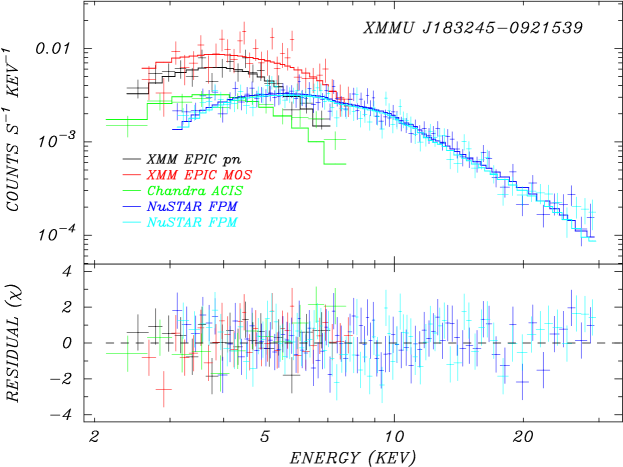
We use the 2016 NuSTAR flux measurements, along with the corrected 2015 Chandra results and the 2011 XMM-Newton data to quantify the source variability of XMMJ183245. Figure 4 summarized its flux and spectral history. The most extreme change is between the initial and lastest data sets, representing a fractional increase in flux, significant at the level. The power-law photon indices are found to be consistent between observations to within the measured errors.
4. Timing analysis of XMMU J1832450921539
We searched for temporal evidence of a binary orbit for XMMJ183245 using the XMM-Newton, Chandra, and NuSTAR data sets. Photon arrival times obtained from each mission were first corrected to the Solar System barycenter using the JPL DE200 planetary ephemeris and the Chandra derived coordinates of R.A. 18:32:45.158, Decl. 09:21:54.78 (J2000). Initial analysis shows no signature characteristic of an accreting system; the light curves are stable on all timescales and their fast Fourier transforms (FFTs) power spectra shows no evidence of red noise. To search for a coherent pulsed signal we used both the FFT method and the unbinned test, for , and the H-test, to be sensitive to both broad and narrow pulse profiles.
From the Chandra data we extracted counts in a radius aperture, containing essentially no background contamination ( count). We performed a Nyquist limited FFT search in the 0.310 keV energy band and find no significant signal for periods between 1.68 s and 10.4 ks, with a upper limit on a sinusoidal pulse fraction of for trials. For the XMM-Newton observation we obtained 576 cts and 830 cts from the merged MOS and the pn data sets, respectively, extracted using a source aperture in the 0.310 keV energy range. A element FFT search of the MOS data yields no significant signal, with upper limit of for s. Similarly, from the pn data, we obtain an between ms and ks using a element FFT. These upper limits take into account the estimated background contamination in the source aperture. We find no evidence for a binary orbit signature in any of these searches.
The high time resolution NuSTAR data allows a search for coherent pulsations, as suggested by the X-ray spectrum of XMMJ183245, typical of a young, rapidly rotating pulsar, possibly association with a HESS source. From the merged FPM data we extracted cts contained within a radius source aperture in the full NuSTAR energy band. For a element FFT we obtain an upper limit on the pulse fraction to between ms and ks, after allowing for the source aperture background. We also searched for a signal over a restricted energy range of keV and 2079 keV, however, none was detected. We repeated all our searches using the method and H-test which produce consistent results.
For the long time span (171 ks) of the NuSTAR observation we performed an additional test using an accelerated FFT search to sample a range of frequency derivatives typical of a energetic pulsar. In no case did we detect a significant pulsar or orbital signal. On the other hand, unlike for the Chandra and XMM-Newton data, the strong signature in the power spectrum at the 97 min NuSTAR spacecraft orbital period and its many harmonics can mask an adjacent binary signal in the frequency domain. The non-detection of X-ray pulsation is common for gamma-ray binaries with upper limits on the pulsed fraction from % to 35% since the unpulsed wind emission may be dominant (Hirayama et al., 1999; Martocchia et al., 2005; Rea et al., 2010, 2011; Rea & Torres, 2011).
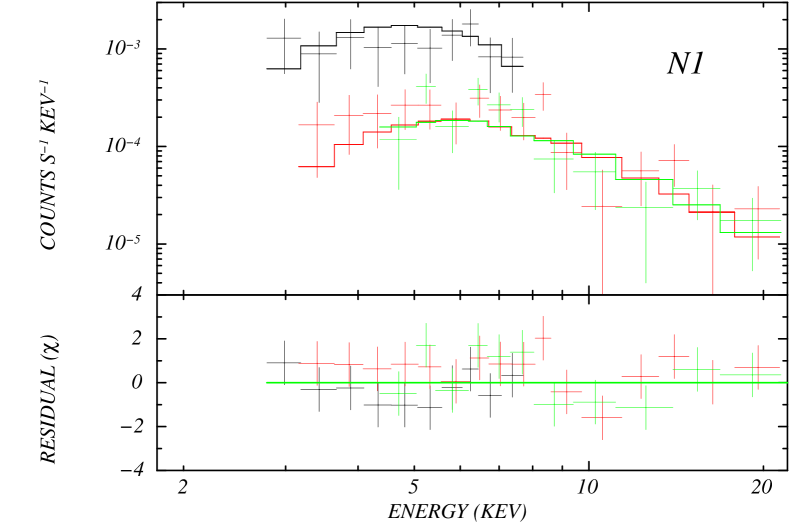
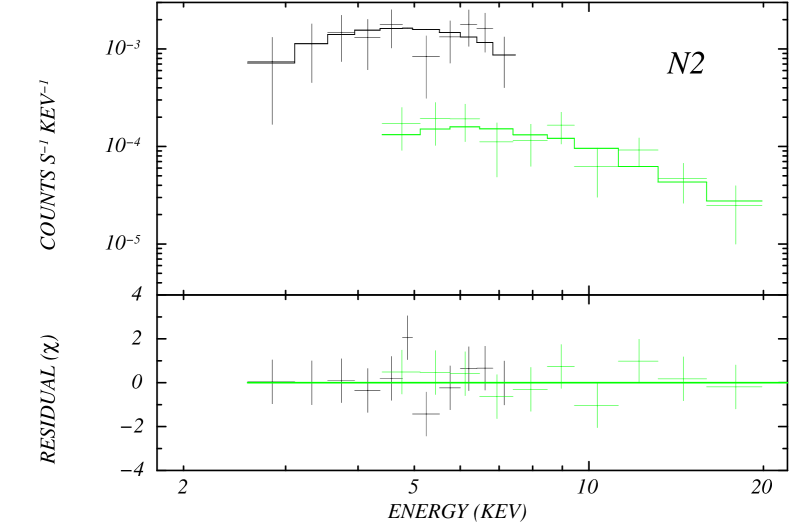
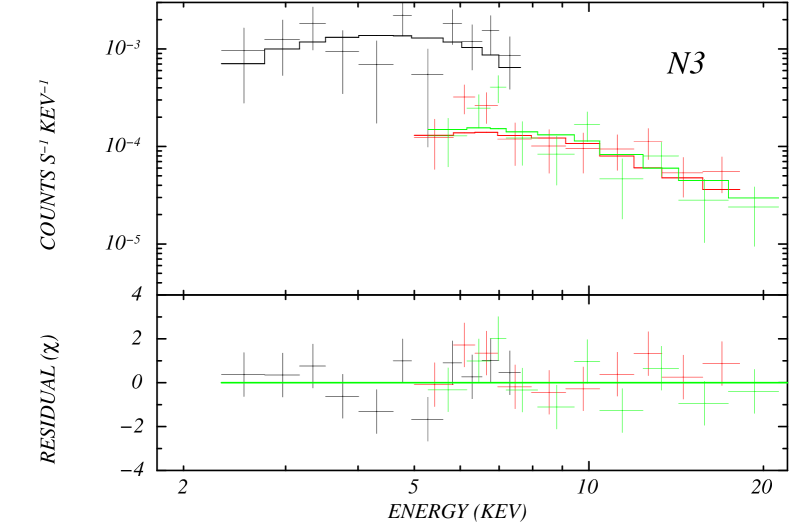
5. Spectral analysis of N1, N2, N3
To determine the possible nature of the three X-ray sources detected in the hard band, N1, N2 and N3, we extracted NuSTAR and XMM-Newton spectra, using a ′′ aperture. The Chandra observation of XMMJ183245 was operated in the 1/8 sub-array mode and did not overlap any of these sources in its restricted field-of-view. Due to the lack of sufficient counts in the MOS spectra for spectroscopy, after background subtraction, we only fit the EPIC pn data. The NuSTAR FPMA data for N2 is heavily contaminated by additional stray-light background photons from a nearby bright source, and is excluded from the analysis. We again generated NuSTAR background spectra for each source using the nuskybgd model. The previous XMM-Newton background spectra proved adequate for their spectral analysis. After rebinning the spectra with at least 20 counts per bin, spectral fitting was performed from 3 keV to 20 keV where the background is not significant.
Given that we find no significant flux deviation between the XMM-Newton and NuSTAR observations for the three hard X-ray sources, we jointly fit the XMM-Newton and NuSTAR spectra for each. The fit results obtained for an absorbed power-law model are summarized in Table 2 and Figure 5. In addition, we fit an absorbed, optically-thin thermal plasma model (tbabs*apec). We fixed the abundance to solar since it is poorly constrained due to the absence of apparent Fe lines.
A power-law model fit to the NuSTAR + XMM-Newton spectra of N1 yields cm-2 and a photon index . An absorbed optically-thin thermal plasma model (tbabs*apec) fits the spectra equally well with with a best-fit column density and temperature of cm-2 and [keV]. In contrast, NuSTAR + XMM-Newton spectra of N2 and N3 fit to a power-law model with harder power-law photon indices and , respectively. An absorbed APEC model fit yields keV () and keV () for N2 and N3, respectively 333The upper bound of plasma temperature is set by the maximum value ( keV) allowed in the APEC model.. We also added a partial-covering absorption model (pcfabs) in order to account for X-ray reflection from the white dwarf surface or absorption in the accretion curtain for intermediate polars (Hailey et al., 2016). A tbabs*pcfabs*apec model fit did not constrain the parameters well for N2. The same model fit to the NuSTAR + XMM-Newton spectra of N3 () yields a lower temperature keV, partial covering column density cm-2 and covering factor .
| Parameters | N1 | N2 | N3 |
|---|---|---|---|
| XMM-Newton counterpart | J183239.7091610 | J183250.1091401 | J183314.2092109 |
| cm-2] | |||
| Flux (2-20 keV)aaunabsorbed flux [ erg cm-2 s-1]. | |||
| (dof) | 0.97 (34) | 0.62 (18) | 0.97 (28) |
6. Discussion
6.1. X-ray emission from gamma-ray binary candidate HESS J1832093
The X-ray spectral and timing signatures of HESS J1832093 i.e., (1) a single power-law spectrum up to 30 keV, (2) with a photon index , (3) evidence for X-ray flux variation over time and (4) a flat power density spectrum without red noise - are consistent with the class of known TeV gamma-ray binaries (Dubus, 2013), suggesting that it is a non-accreting NS binary system. Between a neutron star and its high mass companion star, high energy emission originates from the shocked region where the stellar and pulsar winds collide with each other (Dubus et al., 2015). In this scenario, X-rays stem from synchrotron radiation from accelerated electrons, while inverse Compton scattering of UV photons from a massive star are responsible for gamma-rays up to the TeV band. The non-detection of a spectral break is consistent with this picture where the synchrotron cutoff is expected to be at much higher energy keV for typical ranges of the magnetic field strength in the pulsar wind () and the binary separation () (Dubus, 2013). On the other hand, accreting NS-HMXBs normally show a spectral break at -20 keV (Coburn et al., 2002).
The 210 keV luminosity ( erg s-1), assuming that the source is associated with the GLIMPSE9 stellar cluster and SNR G22.70.2 at 4 kpc (Messineo et al., 2010; Su et al., 2014), is similar to HESS J0632+057 ( erg s-1), while other gamma-ray binaries are brighter in the X-ray band by an order of magnitude. As Eger et al. (2016) pointed out, HESS J1832093 and HESS J0632057 possess similar characteristics such as the faint X-ray emission, the lack of Fermi GeV gamma-ray detection and the spectral energy distribution over the X-ray and TeV gamma-ray band. Further comparison with HESS J0632057 as well as various emission models is not viable until an orbital period is discovered and the high energy emission is fully characterized in different orbital phases. As a TeV binary, HESS J1832093 can be expected to exhibit X-ray flares similar to other gamma-ray binaries. For example, HESS J0632+057 displays X-ray flux enhancement within month (Bongiorno et al., 2011). Swift monitoring of XMMJ183245 over a year may have a good chance of detecting its orbital period.
6.2. IR counterpart of XMMU J1832450921539
In all TeV gamma-ray binaries, the IR and optical emission is predominantly from their massive companion stars (Dubus, 2013). In the case of HESS J1832093, the IR source 2MASS J18324516-0921545 with the magnitudes , and coincides with the Chandra position of XMMJ183245 (Cutri et al., 2003; Eger et al., 2016). According to the VizieR catalog, other IR surveys detected remarkably similar IR magnitudes: UKIDSS (, and ) and DENIS ( and ) (Lucas et al., 2008). The weak variability of IR magnitudes such as , and is a common signature of HXMBs (Reig & Fabregat, 2015). The GLIMPSE survey detected mid-IR emission (G022.476800.1539) at magnitudes (3.6 m), (4.5 m), (5.8 m) and (8.0 m). Both the large mid-IR brightness and colors suggest that the IR source is not an AGN (Stern et al., 2005; Mendez et al., 2013).
Given the IR magnitudes measured by 2MASS, we attempt to speculate the stellar type. Galactic hydrogen column density ( cm-2) to XMMJ183245 estimated by radio surveys (Willingale et al., 2013) leads to the optical extinction using the relation cm-2 (Güver & Özel, 2009). The higher hydrogen column density ( cm-2) derived from fitting X-ray spectra indicates that this value is a lower limit of the optical extinction since there may be additional dust absorption from a surrounding molecular cloud. Using the extinction ratios from Fitzpatrick & Massa (2009), we correct the IR magnitudes to and . Assuming the source distance of 4.4 kpc, we derive absolute magnitudes of and leading to the spectral types B8V and B1.5V, respectively (Pecaut & Mamajek, 2013). The mismatch in the stellar types derived from the J and K magnitudes may be due to an infrared excess primarily in the K band (thus it may account for the detection of mid-IR emission) from warm dust or bremsstrahlung from the stellar winds. If the optical extinction is higher than due to local dust absorption, the IR magnitudes will be larger thus it suggests a more massive O star. However, as demonstrated for identifying hard X-ray sources discovered by INTEGRAL (Nespoli et al., 2008; Coleiro et al., 2013), IR spectroscopy is required to determine the exact type of a companion star associated with XMMJ183245.
6.3. The nature of the field sources N1, N2, N3
Hard X-ray detection of the three X-ray sources (N1, N2 and N3) points towards X-ray binaries harboring neutron star or black hole, magnetic CVs or pulsars as demonstrated by NuSTAR studies of Galactic point sources (Hong et al., 2016; Fornasini et al., 2017) and serendipitous hard X-ray sources (Tomsick et al., 2017). The XMM-Newton counterparts of the three hard X-ray sources are consistent with point sources and their spatial extents are constrained to ′′. In addition, there are about a dozen unidentified XMM-Newton sources in the region. Nearby H II regions and young stellar cluster GLIMPSE9 (Messineo et al., 2010) may account for a large number of X-ray sources. Alternatively, some of these X-ray sources may represent point-like diffuse X-ray emission since they are located at the southern boundary of the G22.70.2 radio shell interacting with the molecular clouds (Su et al., 2014) (see Figure 6). Fast-moving supernova fragments in a dense molecular cloud can produce compact diffuse X-ray emission features as observed in SNR IC 443 (Bykov et al., 2005).
The three hard X-ray sources N1, N2 and N3 exhibit rather distinct NuSTAR spectra (Table 1). They have 2–10 keV fluxes erg cm-2 s-1 (unabsorbed) corresponding to the X-ray luminosity erg s-1 assuming that these sources are associated with the SNR G22.70.2, H II region and GLIMPSE9 stellar cluster whose distances are 4.2–4.4 kpc (Messineo et al., 2010; Su et al., 2014). Below we discuss potential identification of the three NuSTAR sources largely based on the NuSTAR results.
Source N1 (XMMU J183239.7091610) — Among the three NuSTAR sources, N1 exhibits the softest X-ray spectra with a power-law photon index . Spectral fitting with thermal APEC model yields keV. Lack of bright IR counterparts () within the XMM-Newton position error circle indicates that N1 is either a LMXB or magnetic CV if it is a binary system. Another possibility is a pulsar in which case we expect no X-ray variability over time. However, given the large X-ray flux errors from the previous X-ray observations, it is unclear whether this source is variable or not.
Source N2 (XMMU J183250.1091401) — The hard X-ray spectrum with favors a NS-HMXB since NS-HMXBs generally have hard X-ray spectra with . The presence of the gamma-ray binary HESS J1832093 and the nearby star cluster GLIMPSE9 is suggestive that some of the X-ray sources in the region may be HMXBs. Alternatively, N2 may be an intermediate polar since the best-fit plasma temperature is higher than keV. There is an IR source with located within 1.3′′ from the XMM-Newton position. Following the corrections on IR magnitudes applied to XMMJ183245 ($6.2), this IR source is likely a B9V star or a more massive star. A better X-ray source localization with Chandra is crucial to determine its IR counterpart, then follow-up IR spectroscopy can identify the companion star type.
Source N3 (XMMU J183314.2092109) — The NuSTAR source N3 may represent compact diffuse X-ray emission from the SNR-cloud interaction since it is located at the southern region of the G22.70.2 shell intersecting with molecular cloud G22.60.2 and its NuSTAR spectrum fits to a hard power-law spectrum (). At the NuSTAR position of N3, there are two XMM-Newton sources separated by ′′. It is unclear whether N3 is an extended source overlapping the two XMM-Newton sources or truly a point source. There are several XMM-Newton sources overlapping with the strong 13CO line emission region. Such X-ray morphology is similar to that of another middle-aged SNR IC 443 ( years) harboring a prominent SNR-cloud interaction site with a dozen X-ray sources (Bocchino & Bykov, 2003).
In IC 443, Chandra resolved one of the X-ray sources with a hard power-law spectrum () to an extent of ′′, and it was interpreted as a SN ejecta fragment interacting with dense clouds (Bykov et al., 2005). Alternatively, shocked molecular clumps can emit X-rays with hard spectrum at a SNR-cloud interaction site such as Cygni (Uchiyama et al., 2002). However, this scenario is unlikely since it predicts a more extended X-ray emission ( a few arcmin) than the size (′′ or less) of the hard X-ray emission observed in IC 443 and N3 (Bocchino & Bykov, 2003).
If N3 is a SN ejecta fragment similar to that in IC 443, its X-ray luminosity ( erg s-1) indicates that the ejecta mass is likely (Bykov et al., 2005). Given the radius (18 pc) and age ( years) of the SNR (Su et al., 2014), the estimated velocity ( km s-1) of a SN fragment at the SNR shell is large enough to produce the observed X-ray flux similar to the diffuse X-ray features observed in IC 443 (Bykov et al., 2005). The angular size of such a SN fragment is expected to be 10′′ at the distance of G22.70.2 or less extended if the ejecta mass is smaller. Follow-up Chandra observation is warranted to resolve such small scale features. Further XMM-Newton observations, improving photon statistics, may detect Fe emission line from metal-rich SN ejecta as predicted by Bykov (2002). On the other hand, if N3 is indeed a point source, its hard X-ray spectra with keV (APEC model) and keV (partially covered APEC model) suggest an intermediate polar.
7. Summary
-
(1)
A 87 ksec NuSTAR observation obtained high-quality X-ray spectra and timing data on XMMU J1832450921539, the likely counterpart to a new gamma-ray binary candidate HESS J1832093.
-
(2)
The non-thermal X-ray spectrum of HESS J1832093 extends up to at least keV with a power-law index of . No spectral break was observed. We found that the NuSTAR 2-10 keV flux is higher than that of the 2011 XMM-Newton observation by a factor of (90% c.l).
-
(3)
No rapid X-ray pulsation indicative of a pulsar or slow modulation from a binary system were detected from XMMU J1832450921539. The flat power density spectrum shows no evidence for accretion.
-
(4)
NuSTAR hard X-ray emission is detected from three XMM-Newton sources located within the radio shell of SNR G22.70.2. Broadband X-ray spectroscopy with NuSTAR and XMM-Newton data suggests that one of these hard sources may be a supernova ejecta fragment interacting with a dense cloud, while the other two sources are likely X-ray binaries or magnetic CVs. A follow-up Chandra observation is required to identify their IR counterparts and resolve their spatial extents to smaller than ′′ size.
In conclusion, the X-ray spectral and timing properties of HESS J1832093 are similar to other gamma-ray binaries, especially HESS J0632-057. Detection of its orbital period as well as simultaneous observations in the X-ray and gamma-ray band are the next steps to understanding the emission mechanism and geometry.
References
- Abramowski et al. (2015) Abramowski, A., Acero, F., Aharonian, F., et al. 2015, MNRAS, 446, 1163
- Aharonian et al. (2005) Aharonian, F., Akhperjanian, A. G., Aye, K.-M., et al. 2005, A&A, 442, 1
- Aharonian et al. (2006) Aharonian, F., Akhperjanian, A. G., Bazer-Bachi, A. R., et al. 2006, A&A, 460, 743
- Aharonian et al. (2007) Aharonian, F. A., Akhperjanian, A. G., Bazer-Bachi, A. R., et al. 2007, A&A, 469, L1
- Albert et al. (2009) Albert, J., Aliu, E., Anderhub, H., et al. 2009, ApJ, 693, 303
- Aliu et al. (2014) Aliu, E., Archambault, S., Aune, T., et al. 2014, ApJ, 780, 168
- An et al. (2013) An, H., Dufour, F., Kaspi, V. M., & Harrison, F. A. 2013, ApJ, 775, 135
- An et al. (2015) An, H., Bellm, E., Bhalerao, V., et al. 2015, ApJ, 806, 166
- Arnaud (1996) Arnaud, K. A. 1996, in Astronomical Society of the Pacific Conference Series, Vol. 101, Astronomical Data Analysis Software and Systems V, ed. G. H. Jacoby & J. Barnes, 17
- Bocchino & Bykov (2003) Bocchino, F., & Bykov, A. M. 2003, A&A, 400, 203
- Bongiorno et al. (2011) Bongiorno, S. D., Falcone, A. D., Stroh, M., et al. 2011, ApJ, 737, L11
- Bosch-Ramon & Paredes (2004) Bosch-Ramon, V., & Paredes, J. M. 2004, A&A, 417, 1075
- Bykov (2002) Bykov, A. M. 2002, A&A, 390, 327
- Bykov et al. (2005) Bykov, A. M., Bocchino, F., & Pavlov, G. G. 2005, ApJ, 624, L41
- Chernyakova et al. (2009) Chernyakova, M., Neronov, A., Aharonian, F., Uchiyama, Y., & Takahashi, T. 2009, MNRAS, 397, 2123
- Chernyakova et al. (2006a) Chernyakova, M., Neronov, A., Lutovinov, A., Rodriguez, J., & Johnston, S. 2006a, MNRAS, 367, 1201
- Chernyakova et al. (2006b) Chernyakova, M., Neronov, A., & Walter, R. 2006b, MNRAS, 372, 1585
- Coburn et al. (2002) Coburn, W., Heindl, W. A., Rothschild, R. E., et al. 2002, ApJ, 580, 394
- Coleiro et al. (2013) Coleiro, A., Chaty, S., Zurita Heras, J. A., Rahoui, F., & Tomsick, J. A. 2013, A&A, 560, A108
- Cutri et al. (2003) Cutri, R. M., Skrutskie, M. F., van Dyk, S., et al. 2003, VizieR Online Data Catalog, 2246
- de la Cita et al. (2017) de la Cita, V. M., Bosch-Ramon, V., Paredes-Fortuny, X., Khangulyan, D., & Perucho, M. 2017, A&A, 598, A13
- Dubus (2013) Dubus, G. 2013, A&A Rev., 21, 64
- Dubus (2015) —. 2015, Comptes Rendus Physique, 16, 661
- Dubus et al. (2015) Dubus, G., Lamberts, A., & Fromang, S. 2015, A&A, 581, A27
- Eger et al. (2016) Eger, P., Laffon, H., Bordas, P., et al. 2016, MNRAS, 457, 1753
- Fitzpatrick & Massa (2009) Fitzpatrick, E. L., & Massa, D. 2009, ApJ, 699, 1209
- Fornasini et al. (2017) Fornasini, F. M., Tomsick, J. A., Hong, J., et al. 2017, ArXiv e-prints, arXiv:1703.00021
- Güver & Özel (2009) Güver, T., & Özel, F. 2009, MNRAS, 400, 2050
- H. E. S. S. Collaboration et al. (2015) H. E. S. S. Collaboration, Abramowski, A., Aharonian, F., et al. 2015, A&A, 577, A131
- Hailey et al. (2016) Hailey, C. J., Mori, K., Perez, K., et al. 2016, ApJ, 826, 160
- Harrison et al. (2013) Harrison, F. A., Craig, W. W., Christensen, F. E., et al. 2013, ApJ, 770, 103
- Helfand et al. (2006) Helfand, D. J., Becker, R. H., White, R. L., Fallon, A., & Tuttle, S. 2006, AJ, 131, 2525
- Hirayama et al. (1999) Hirayama, M., Cominsky, L. R., Kaspi, V. M., et al. 1999, ApJ, 521, 718
- Ho et al. (2017) Ho, W. C. G., Ng, C.-Y., Lyne, A. G., et al. 2017, MNRAS, 464, 1211
- Hong et al. (2016) Hong, J., Mori, K., Hailey, C. J., et al. 2016, ApJ, 825, 132
- Kaspi et al. (1995) Kaspi, V. M., Tavani, M., Nagase, F., et al. 1995, ApJ, 453, 424
- Kishishita et al. (2009) Kishishita, T., Tanaka, T., Uchiyama, Y., & Takahashi, T. 2009, ApJ, 697, L1
- Li et al. (2011) Li, J., Torres, D. F., Chen, Y., et al. 2011, ApJ, 738, L31
- Lucas et al. (2008) Lucas, P. W., Hoare, M. G., Longmore, A., et al. 2008, MNRAS, 391, 136
- Lyne et al. (2015) Lyne, A. G., Stappers, B. W., Keith, M. J., et al. 2015, MNRAS, 451, 581
- Madsen et al. (2015) Madsen, K. K., Harrison, F. A., Markwardt, C. B., et al. 2015, ApJS, 220, 8
- Martocchia et al. (2005) Martocchia, A., Motch, C., & Negueruela, I. 2005, A&A, 430, 245
- Mendez et al. (2013) Mendez, A. J., Coil, A. L., Aird, J., et al. 2013, ApJ, 770, 40
- Messineo et al. (2010) Messineo, M., Figer, D. F., Davies, B., et al. 2010, ApJ, 708, 1241
- Mori et al. (2014) Mori, K., Gotthelf, E. V., Dufour, F., et al. 2014, ApJ, 793, 88
- Mori et al. (2015) Mori, K., Hailey, C. J., Krivonos, R., et al. 2015, ApJ, 814, 94
- Nespoli et al. (2008) Nespoli, E., Fabregat, J., & Mennickent, R. E. 2008, A&A, 486, 911
- Pecaut & Mamajek (2013) Pecaut, M. J., & Mamajek, E. E. 2013, ApJS, 208, 9
- Rea & Torres (2011) Rea, N., & Torres, D. F. 2011, ApJ, 737, L12
- Rea et al. (2011) Rea, N., Torres, D. F., Caliandro, G. A., et al. 2011, MNRAS, 416, 1514
- Rea et al. (2010) Rea, N., Torres, D. F., van der Klis, M., et al. 2010, MNRAS, 405, 2206
- Reig & Fabregat (2015) Reig, P., & Fabregat, J. 2015, A&A, 574, A33
- Romero et al. (2003) Romero, G. E., Torres, D. F., Kaufman Bernadó, M. M., & Mirabel, I. F. 2003, A&A, 410, L1
- Rosen et al. (2016) Rosen, S. R., Webb, N. A., Watson, M. G., et al. 2016, A&A, 590, A1
- Sierpowska-Bartosik & Torres (2008) Sierpowska-Bartosik, A., & Torres, D. F. 2008, Astroparticle Physics, 30, 239
- Stern et al. (2005) Stern, D., Eisenhardt, P., Gorjian, V., et al. 2005, ApJ, 631, 163
- Su et al. (2014) Su, Y., Yang, J., Zhou, X., Zhou, P., & Chen, Y. 2014, ApJ, 796, 122
- Takahashi et al. (2009) Takahashi, T., Kishishita, T., Uchiyama, Y., et al. 2009, ApJ, 697, 592
- Takata et al. (2017) Takata, J., Tam, P. H. T., Ng, C. W., et al. 2017, ApJ, 836, 241
- Tavani et al. (1994) Tavani, M., Arons, J., & Kaspi, V. M. 1994, ApJ, 433, L37
- Tomsick et al. (2017) Tomsick, J. A., Lansbury, G. B., Rahoui, F., Clavel, M., & Fornasini, F. M. 2017, submitted to ApJ
- Uchiyama et al. (2002) Uchiyama, Y., Takahashi, T., Aharonian, F. A., & Mattox, J. R. 2002, ApJ, 571, 866
- Uchiyama et al. (2009) Uchiyama, Y., Tanaka, T., Takahashi, T., Mori, K., & Nakazawa, K. 2009, ApJ, 698, 911
- Verner et al. (1996) Verner, D. A., Ferland, G. J., Korista, K. T., & Yakovlev, D. G. 1996, ApJ, 465, 487
- Wik et al. (2014) Wik, D. R., Hornstrup, A., Molendi, S., et al. 2014, ApJ, 792, 48
- Willingale et al. (2013) Willingale, R., Starling, R. L. C., Beardmore, A. P., Tanvir, N. R., & O’Brien, P. T. 2013, MNRAS, 431, 394
- Wilms et al. (2000) Wilms, J., Allen, A., & McCray, R. 2000, ApJ, 542, 914