11email: agata@camk.edu.pl 22institutetext: Warsaw University of Technology, Plac Politechniki 1, 00-661 Warszawa, Poland 33institutetext: Astronomical Observatory, University of Warsaw, Al. Ujazdowskie 4, 00-478, Warszawa, Poland
Ultra Luminous X-ray sources - new distance indicators?
Abstract
Aims. In this paper we fit the NuSTAR and XMM-Newton data of three sources: NGC7793 P13, NGC5907 ULX1, and Circinus ULX5.
Methods. Our single model contains emission form non-spherical system: neutron star plus accretion disk directed towards observer.
Results. We obtained the very good fit with the reduced per degree of freedom equal 1.08 for P13, 1.01 for ULX1, and 1.14 for ULX5. The normalization of our model constrains the distance to the source. The resulting distances are , and Mpc for P13, ULX1 and ULX5 respectively. The distances to P13 and ULX5 are in perfect agreement with previous distance measurements to their host galaxies.
Conclusions. Our results confirm that P13, ULX1 and ULX5 may contain central hot neutron star. When the outgoing emission is computed by integration over the emitting surface and successfully fitted to the data, then the resulting model normalization is the direct distance indicator.
Key Words.:
accretion,accretion disks — stars:neutron — X-rays:general1 Introduction
Recent observations suggest that some Ultra Luminous X-ray (ULX) sources contain neutron star in their centers, since a typical coherent pulsation from magnetized pulsar was detected in case of: M82X-2 (Bachetti et al. 2014), NGC5907 ULX1 (Israel et al. 2017a), and NGC7793 P13 (Fürst et al. 2016; Israel et al. 2017b). The fact that mass of the central object may equal 1.4 solar masses implies that the accretion disk has to be highly super Eddington. Such a consequence directly results from the large values of the observed X-ray luminosities from those systems, which always exceed the theoretical maximum for spherical infall onto a stellar-mass black hole (Roberts 2007; Liu et al. 2013). The broad-band spectra of those sources obtained simultaneously by XMM-Newton and NuSTAR X-ray satellites, in most cases are inadequately describe by only one multi-temperature disk component. The second spectral component as thermal Comptonization or black body from the neutron star surface is needed to fully explain the spectral shape (Walton et al. 2013, 2017).
Theoretical explanation for the broad spectral shape was given by Różańska et al. (2017) in the case of low mass X-ray binaries (LMXB), where we presented spectral shape from non-spherical system which contains neutron star with an accretion disk. Our single model component contains emission from both regions with the effects of mutual occultation which gives the proper model normalization. Final spectrum depends on the viewing angle in the whole energy range and for the assumed emitting surface it is proportional to the inverse square distance.
In this paper, we reduce archival broad-band data of three sources: NGC7793 P13, NGC5907 ULX1, and Circinus ULX5 (hereafter P13, ULX1, and ULX5). First two systems are two of the three neutron star ULXs known at present. The observations were taken on with XMM-Newton (Jansen et al. 2001) and NuSTAR (Harrison et al. 2013) telescopes simultaneously. Spectral analysis were recently done by Walton et al. (2017) for P13, by Israel et al. (2017b) for ULX1, and by Walton et al. (2013) for ULX5, where their final models contained several components. In this paper we show, that our single model of non-spherical emission from a neutron star with the multi-color black body emission from an accretion disk fits the broad-band spectra of P13, ULX1 and ULX5 perfectly. The normalization of our model constrains the distance to the source. In case of P13, the resulted distance perfectly agrees with the distance determination based on the Cepheid method to the hosting galaxy NGC7793 (Pietrzyński et al. 2010). Furthermore, the distance to ULX5 from our method also agrees with the distance found with radial velocity method to Circinus galaxy (Koribalski et al. 2004).
2 Single model of emission and parameters
We assume that ULX source is a non-spherical system containing neutron star with the accretion disk around it. The global disk model is not specified here, and the total disk emission is parametrized by multi-color black body shape. This approach is correct, since we do not know exact accretion efficiency and we deal with objects where standard accretions does not account for their high luminosity. For such object geometry, the infinitesimal energy measured by a distant observer is defined as: , where is a solid angle in steradian [sr] (Mihalas 1978). This formula is applicable for the flat space, as we assume in this paper. In case when the emitter is located close to black hole, both general and special relativistic corrections should be taken into account as in Fabian et al. (1989, Eq. A4). Integrating the above formula over the solid angle subtended by the source, we obtained energy dependent intensity: as seen by the observer. This quantity diminishes with the increasing distance and it is not an intrinsic property of the source. In case of non-spherical systems the observed intensity should be integrated over emitting region individually depending on the source geometry. In this paper, we consider emitting region with cylindrical symmetry.

In the case of emission from the whole system i.e. neutron star with the accretion disk around it, we have the contribution from different emitting parts (for details see: Różańska et al. 2017) and the final observed energy dependent intensity directed to the observer is computed analytically as:
| (1) | |||||
where is the neutron star radius, - the distance to the system, and - the specific intensity emitted from the source surface towards the observer. Other variables denote respectively: , where is the angle between direction of the light beam and the normal to the neutron star surface, is viewing angle related to the disk inclination as (see Fig. 3 in Różańska et al. (2017)), and is the variable of integration.
First two parts of above equation correspond to the emission from the neutron star surface taking into account the occultation by the disk, while second two parts describe the multi-color black body disk emission with eventual occultation by the neutron star. Due to mutual occultation one part of the disk is integrated over radius from the innermost stable orbit all the way up to the outer radius , while the second part of the disk - from up to the outer radius . the radius up to which neutron star covers the inner disk. The above formula was derived analytically by Różańska et al. (2017), where we have demonstrated that the broad-band emitted spectrum from a non-spherical system depends on the viewing angle, since both: multi-color black body disk emission and neutron star emission change with angle.
We assume, that the neutron star radiation equals the black body intensity at the given effective temperature . Furthermore, we assume that the emission at different disk radii equals to the local Planck function , with the effective temperature given by a standard multi-color black body formula: , where is the inner disk temperature and exponent equals 3/4 for the standard disk. Following earlier approach to the spectral fitting of ULXs (Walton et al. 2013; Bachetti et al. 2014; Fürst et al. 2016; Israel et al. 2017b; Walton et al. 2017), we do not connect here the inner disk temperature with an accretion rate, since this relation strongly depends on the assumed global disk model and the accretion efficiency. Since the latter quantity is not well known and since we expect super Eddington accretion in ULXs, we continue disk parametrization by the inner disk temperature. Nevertheless, we note here, that our model is useful for systems where the angle dependent specific intensity is given as the results of the radiative transfer calculations (Madej 1989, 1991; Hubeny et al. 2001; Davis et al. 2005; Różańska et al. 2011). We plan to implement atmospheric models in the future work.
For the purpose to compare our model to the observed X-ray spectrum of ULX source P13, we constructed the grid of models for arbitrarily assumed parameters. The non-rotating neutron star has a canonical mass 1.4 M⊙, radius 12 km, and 11 various effective temperatures, ranging from K up to K. The disk local multi-color emission was computed assuming 11 inner disk temperatures ranging from up to K. The grid of angles spans from up to . The lowest value of this angle corresponds to the almost “edge on” disk, whereas the highest value to “face on” disk.
For each disk model, we calculated multi-black body spectrum from to in the range 3-1000 , where the . The inner disk radius, and therefore the inner disk temperature, can change due to the: large value of magnetic field, strong boundary layer, and when the relativistic corrections are taken into account. We plan to include them in the future paper together with full ray tracing procedure.
Our model normalized by the distance of kpc, was prepared as a table model in the FITS (Flexible Image Transport System) format (Wells et al. 1981), and for the purpose of this paper we named it nsmcbb (neutron star multi-color black body). Final table of total emission from the system is parametrized by four parameters which will be determined during fitting procedure: neutron star effective temperature, , inner disk temperature , viewing angle , and normalization . Since the normalization of our model is proportional to , the value of this normalization which comes out from the fitting procedure is the direct indicator of the distance to the system, which equals kpc. Below we show that in case of P13 the distance derived from our fitting is in excellent agreement with independent distance measurement.
3 P13, ULX1, ULX5 and their X-ray observations
P13 is a variable ULX source, that has been proposed to harbour a stellar black hole of a mass less than 15 M⊙ (Motch et al. 2014). However, recent studies by Fürst et al. (2016); Israel et al. (2017b) have discovered that P13 hosts an accreting neutron star with the spin period of 0.42 s. The source is a part of the binary system, where it circulates around B91a star of 18-23 M⊙, with the period of 64 days (Motch et al. 2014). Previously, P13 has been reported to reach luminosities from detected in 1979 by Einstein satellite up to erg s-1 reported recently with join XMM-Newton and NuSTAR data by Walton et al. (2017). The source is rather unobscured with galactic warm absorption value: cm-2 (Israel et al. 2017b). On the other hand Walton et al. (2017) in their paper divided this absorption between galactic absorption with the value of neutral hydrogen estimated towards the object on cm-2 (Kalberla et al. 2005), and intrinsic source absorption resulting from the fit : cm-2. P13 is located in NGC7793 galaxy which is a part of Sculptor Group. The first distance measurement to the source was done by Karachentsev et al. (2003) as a distance to the galaxy itself and was estimated to be Mpc. Further distance derivation was done within ARAUCARIA project (Gieren et al. 2005) where for the first time Cepheid Variables were detected in the Sculptor Group. Cepheids distance to the galaxy NGC7793 was found to be Mpc (Pietrzyński et al. 2010).
ULX1 located in NGC5907 galaxy is a part of binary system, with its period being 78 days. Recent studies by Israel et al. (2017b) have discovered that ULX1 harbours a neutron star at its center, with spin period ranging from 1.13s to 1.43s. First estimations of the distance from Earth amounted to 13 Mpc (Tully et al. 2009). However, later studies discovered that ULX1 may be located even further form Earth, with its distance totaling 17 Mpc (Tully et al. 2016). Such a high distance results in peak luminosities reaching values up to erg s-1 as for 13 Mpc (Fürst et al. 2017), which is many times higher then a luminosity for a standard neutron star. The typical values of galactic warm absorption toward the ULX1 given by those authors equal from 5.7 to cm-2.
ULX5 is located in the outskirts of the Circinus galaxy, with its distance estimated to be 2.78 Mpc (Koribalski et al. 2004) (distance to the galaxy from radial velocity method). The first observations of ULX5 at hard X-ray have been made and analyzed by Walton et al. (2013). Depending on the fitted model, the values of galactic warm absorption toward the source were from 1 to cm-2. Its peak luminosity was calculated to reach value erg s-1. This luminosity was calculated for higher distance of 4 Mpc measured with Tully-Fisher method when Circinus galaxy was discovered (Freeman et al. 1977).
In this work we made use of coordinated NuSTAR (OBSID: 80201010002, 80001042002, 60002039002) and XMM-Newton (OBSID: 0781800101, 0729561301, 0701981001) observations of three sources: P13, ULX1 and ULX5. The observations were taken on 2016-05-20, 2014-07-09, and 2013-02-03, respectively. Their exposure times were for P13: 118 ks for NuSTAR and 22/46 ks for EPIC-pn/EPIC-MOS cameras on the board of XMM-Newton X-ray telescope, for ULX1: 65ks and 38ks/43ks, and for ULX5: 54ks and 24ks/47ks, for the same instruments.
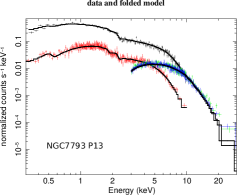
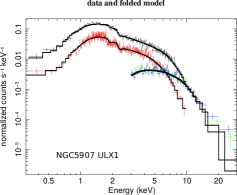
We reduced the NuSTAR data from both focal plane modules, FPMA and FPMB, by using NuSTAR Data Analysis Software in accordance to guidelines provided in the NuSTAR Data Analysis Software Guide (v1.9.2)111https://heasarc.gsfc.nasa.gov/docs/nustar/analysis/nustar_swguide.pdf. Calibration files were taken from the actual database CALDB v20170817 throughout the whole process. NUPIPELINE tool was used in order to produce filtered event files, with standard filtering applied. We utilized NUPRODUCTS tool to extract source products and instrumental response files form circular regions of radii for P13, for ULX1, and for ULX5. Background products were obtained from four times larger regions located on the same detector chip as sources. Besides the basic so called science data we also included spacecraft science data following the guideline outlined in NuSTAR Data Analysis Software Guide (see also Walton et al. 2016). Therefore we were able to increase our exposure time by approximately 10% and maximazie the signal-to-noise (S/N) ratio. Additional data obtained by this action were merged with standard scientific data by running FTOOLS task ADDASCASPEC. Since we intend to fit broad-band data, small errors in responses generated by this tool do not affect our results significantly. Final spectra, averaged over exposure time, were binned to at least 20 counts per bin for data fitting process. The extracted normalized counts are presented in Fig. 1.
| Src. | Model | Parameter | Value | Unit |
|---|---|---|---|---|
| P13 | tbnew | cm-2 | ||
| nsmcbb | K | |||
| nsmcbb | K | |||
| nsmcbb | deg | |||
| nsmcbb | – | |||
| ULX1 | tbnew | cm-2 | ||
| nsmcbb | K | |||
| nsmcbb | K | |||
| nsmcbb | deg | |||
| nsmcbb | – | |||
| ULX5 | tbnew | cm-2 | ||
| nsmcbb | K | |||
| nsmcbb | K | |||
| nsmcbb | deg | |||
| nsmcbb | – |
The XMM-Newton data were reduced with the XMM-Newton Science Analysis System (SAS) v16.0.0222https://www.cosmos.esa.int/web/xmm-newton/sas, following standard guidelines outlined in the science analysis threads. We generated the calibrated and concatenated event lists by running EPCHAIN task for EPIC-pn and EMCHAIN task for both EPIC-MOS modules. Next, we created an event file and then subjected it to filtering for background flaring with the help of SAS tasks evselect and tabgtigen. To produce final event files with spectrum, the source products were extracted from circular regions of radii: for P13, 36”/45” for ULX1 (PN/MOS), and 22.5”/27” for ULX5 (PN/MOS), and background products were extracted from nine times larger regions on the same CCD chip. All regions were extracted in the way to avoid the CCD borders. In evselect, we used the filters FLAG PATTERN for EPIC-pn and FLAG PATTERN for the EPIC-MOS cameras. The appropriate response files and ancillary files were generated using the SAS commands rmfgen and arfgen respectively. Lastly, we combined the spectra form both EPIC-MOS detectors by running FTOOLS task ADDASCASPEC. Final EPIC-pn spectrum was be binned to at least 10 counts per energy bin, while spectra from both MOS cameras were binned to at least 20 counts per energy bin for data fitting process. The extracted normalized counts are presented in Fig. 1.
4 Spectral analysis
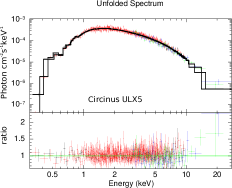
We performed spectral fitting of P13, ULX1 and ULX5 data with a single model of emission nsmcbb, presented in Sec 2 with the use of xspec fitting package, version 12.9.0333https://heasarc.gsfc.nasa.gov/xanadu/xspec/. In case of each source, all sets of data were fitted simultaneously with nsmcbb model multiplied by galactic absorption model tbnew. All values of metal abundances in tbnew model were frozen beside hydrogen column density. Tab. 2 presents all fitted parameters and uncertainties given at the 90% of confidence level.
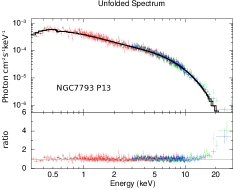
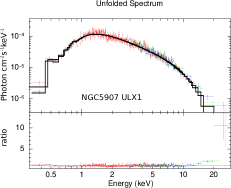
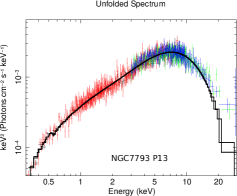
The quality of fits is excellent since the data are very good giving 1245, 859, and 762 degrees of freedom () for each source respectively. The reduced statistics are: for P13, 1.01 for ULX1 and 1.14 for ULX5, indicating that our single model of emission from the non-spherical system perfectly agrees with data of each source, which we illustrate at Fig. 2. Unfolded spectra from all detectors are broad and correctly agree with the models up to 20 keV. There is a small deviation for higher energies resulting in the value of ratio (data/model) reaching 4, but this feature is always present in ULX sources broad-band spectral analysis. Even in the case of multi-component spectral fitting of P13 by Walton et al. (2017), this ratio is between 2 and 3.5. This fact may suggest that the hard energy tail is still not well detected by us and furthermore not well modeled.
| Src. | Parameter | Value | Unit |
|---|---|---|---|
| P13 | 1344/1245 | – | |
| (2-10 keV) | 4.36 | erg s-1 cm-2 | |
| (0.3-30 keV) | 6.83 | erg s-1 cm-2 | |
| 3.41 | Mpc | ||
| (0.3-30 keV) | 9.59 | erg s-1 | |
| ULX1 | 867/859 | – | |
| (2-10 keV) | erg s-1 cm-2 | ||
| (0.3-30 keV) | erg s-1 cm-2 | ||
| Mpc | |||
| (0.3-30 keV) | erg s-1 | ||
| ULX5 | 872/762 | – | |
| (2-10 keV) | erg s-1 cm-2 | ||
| (0.3-30 keV) | erg s-1 cm-2 | ||
| Mpc | |||
| (0.3-30 keV) | erg s-1 |
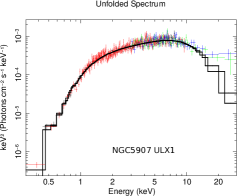
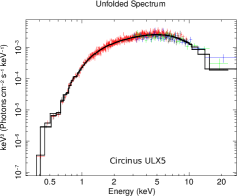
The fitted values of galactic absorption are consistent with previous estimations given in Sec. 3, and since those values are quite low they do not affect other parameters. The neutron star effective temperatures are high, giving rise to the hard energy bump in the observed spectrum. It is clearly seen in the unfolded energy spectrum plotted in versus at Fig. 3. In case of P13 and ULX5, the resulting inclination angles suggest that the whole systems are observed edge on, and the neutron star is strongly covered by the accretion disk. Different case is ULX1, where orientation is almost face on, and therefore occultation is not very strong. For all sources considered in this paper, the integration over such emitting area fully explains the shape of X-ray observed spectrum.
Since the emission from non-spherical region fits observations, we can calculate distances to all sources from the model normalization. In case of ULX1, the previous distance estimations are uncertain, giving two values 13 and 17 Mpc. Distance to ULX1 resulting from our modeling is a factor of two lower Mpc.
In case of ULX5, the situation is much better since the distance to the source obtained by our method Mpc agrees with 2.78 Mpc obtained from radial velocity method by Koribalski et al. (2004) (assuming Hubble constant km s-1 Mpc). However, the best agreement we achieved in case of P13, where the obtained value Mpc from our modeling fully agrees with two earlier distance estimations to the Sculptor Group being Mpc (Karachentsev et al. 2003), and to the host galaxy NGC7793 from Cepheid method – Mpc (Pietrzyński et al. 2010). It shows that our model is correct and the proper emission from several regions with mutual occultation should be taken account during broad-band data analysis of accreting systems.
5 Discussion
In this paper we showed, that the broad-band spectra of ULX sources: P13 in NGC7793, ULX1 in NGC5907, and ULX5 in Circinus galaxy are well fitted by a single model component. The fit statistics is excellent: for P13, 1.01 for ULX1 and 1.14 for ULX5. The model results from integration over non-spherical and non-uniform emitting region. The best fitted model indicates that all ULXs have the hot neutron star in their centers, with the disk with high inner temperatures. In case of each source inclination of the whole system was determined. Our model does not exclude the presence of hot regions, as hot corona, in the center since we can observe weak deviation of the model from the data at 20 keV. Nevertheless, we aimed to show the effect of non-spherical emission in the simplest way, and we claim that it fully works for ULXs analyzed in this paper.
Our results clearly show that the integration over true intensity emitted by a given surface should be applied to explain emission from non-spherical systems. When this is done, we obtain a new possibility to explain broad-band spectra by a single model component. Next, we can derive the distance to the source from the model normalization. We derived the distance to P13, Mpc, which is in very good agreement with the Cepheids distance Mpc (Pietrzyński et al. 2010). In case of ULX1, the distance resulting from our modeling is Mpc, a factor of two lower than previous estimates (Tully et al. 2009, 2016). But both previous estimations were reporting two different numbers of 13 and 17 Mpc distance to this source. The distance to ULX5 obtained by our method Mpc is in agreement with 2.78 Mpc given by Koribalski et al. (2004) with radial velocity measurements.
There exists a more general result of our analysis. Any additional soft X-ray bump, which is very often observed in X-ray spectra of accreting objects is usually fitted by separate model components, either disk or black-body. Here, we have proven that this problem can be solved, when we integrate emission over the disk with hot inner source. Such central hot source may be for instance a neutron star or a hot corona and may be partially attenuated by the disk.
Acknowledgments
This research was supported by Polish National Science Center grants No. 2015/17/B/ST9/03422, 2015/18/M/ST9/00541, and 2016/21/N/ST9/03311. This research has made use of data obtained with NuSTAR, a project led by Caltech, funded by NASA and managed by NASA/JPL, and has utilized the NUSTARDAS software package, jointly developed by the ASDC (Italy) and Caltech (USA). This work has also made use of data obtained with XMM-Newton directly funded by ESA Member States.
References
- Bachetti et al. (2014) Bachetti, M., Harrison, F. A., Walton, D. J., et al. 2014, Nature, 514, 202
- Davis et al. (2005) Davis, S. W., Blaes, O. M., Hubeny, I., & Turner, N. J. 2005, ApJ, 621, 372
- Fabian et al. (1989) Fabian, A. C., Rees, M. J., Stella, L., & White, N. E. 1989, MNRAS, 238, 729
- Freeman et al. (1977) Freeman, K. C., Karlsson, B., Lynga, G., et al. 1977, A&A, 55, 445
- Fürst et al. (2016) Fürst, F., Walton, D. J., Harrison, F. A., et al. 2016, ApJ, 831, L14
- Fürst et al. (2017) Fürst, F., Walton, D. J., Stern, D., et al. 2017, ApJ, 834, 77
- Gieren et al. (2005) Gieren, W., Pietrzynski, G., Bresolin, F., et al. 2005, The Messenger, 121, 23
- Harrison et al. (2013) Harrison, F. A., Craig, W. W., Christensen, F. E., et al. 2013, ApJ, 770, 103
- Hubeny et al. (2001) Hubeny, I., Blaes, O., Krolik, J. H., & Agol, E. 2001, ApJ, 559, 680
- Israel et al. (2017a) Israel, G. L., Belfiore, A., Stella, L., et al. 2017a, Science, 355, 817
- Israel et al. (2017b) Israel, G. L., Papitto, A., Esposito, P., et al. 2017b, MNRAS, 466, L48
- Jansen et al. (2001) Jansen, F., Lumb, D., Altieri, B., et al. 2001, A&A, 365, L1
- Kalberla et al. (2005) Kalberla, P. M. W., Burton, W. B., Hartmann, D., et al. 2005, A&A, 440, 775
- Karachentsev et al. (2003) Karachentsev, I. D., Grebel, E. K., Sharina, M. E., et al. 2003, A&A, 404, 93
- Koribalski et al. (2004) Koribalski, B. S., Staveley-Smith, L., Kilborn, V. A., et al. 2004, AJ, 128, 16
- Liu et al. (2013) Liu, J.-F., Bregman, J. N., Bai, Y., Justham, S., & Crowther, P. 2013, Nature, 503, 500
- Madej (1989) Madej, J. 1989, ApJ, 339, 386
- Madej (1991) Madej, J. 1991, ApJ, 376, 161
- Mihalas (1978) Mihalas, D. 1978, Stellar atmospheres /2nd edition/ (San Francisco, W. H. Freeman and Co., p. 650)
- Motch et al. (2014) Motch, C., Pakull, M. W., Soria, R., Grisé, F., & Pietrzyński, G. 2014, Nature, 514, 198
- Pietrzyński et al. (2010) Pietrzyński, G., Gieren, W., Hamuy, M., et al. 2010, AJ, 140, 1475
- Roberts (2007) Roberts, T. P. 2007, Ap&SS, 311, 203
- Różańska et al. (2017) Różańska, A., Bełdycki, B., Madej, J., Adhikari, T. P., & You, B. 2017, Acta Astron., 67, 51
- Różańska et al. (2011) Różańska, A., Madej, J., Konorski, P., & Sa̧dowski, A. 2011, A&A, 527, A47
- Tully et al. (2016) Tully, R. B., Courtois, H. M., & Sorce, J. G. 2016, AJ, 152, 50
- Tully et al. (2009) Tully, R. B., Rizzi, L., Shaya, E. J., et al. 2009, AJ, 138, 323
- Walton et al. (2013) Walton, D. J., Fuerst, F., Harrison, F., et al. 2013, ApJ, 779, 148
- Walton et al. (2017) Walton, D. J., Fuerst, F., Harrison, F. A., et al. 2017, ArXiv e-prints [arXiv:1705.10297]
- Walton et al. (2016) Walton, D. J., Tomsick, J. A., Madsen, K. K., et al. 2016, ApJ, 826, 87
- Wells et al. (1981) Wells, D. C., Greisen, E. W., & Harten, R. H. 1981, A&AS, 44, 363