Determining Impact of Social Media Badges through
Joint Clustering of Temporal Traces and User Features
Abstract
Badges are a common, and sometimes the only, method of incentivizing users to perform certain actions on online sites. However, due to many competing factors influencing user temporal dynamics, it is difficult to determine whether the badge had (or will have) the intended effect or not.
In this paper, we introduce two complementary approaches for determining badge influence on users. In the first one, we cluster users’ temporal traces (represented with point processes) and apply covariates (user features) to regularize results. In the second approach, we first classify users’ temporal traces with a novel statistical framework, and then we refine the classification results with a semi-supervised clustering of covariates.
Outcomes obtained from an evaluation on synthetic datasets and experiments on two badges from a popular Q&A platform confirm that it is possible to validate, characterize and to some extent predict users affected by the badge.
1 Introduction
Awarding a digital badge after a user performs certain actions is a common mechanism to motivate users on online sites, be it social networking sites like Foursquare111https://foursquare.com, education sites like Khan Academy222https://www.khanacademy.org/, or crowdlearning Q&A sites like Stack Overflow333https://stackoverflow.com. Previously, there have been several attempts at modeling the badges’ effect on online communities and at recommending how the badge systems should be designed. However, there are no previous studies actually verifying whether the badges have any impact on individual users or not; it has been taken for granted that badges affect targeted users in a desired way. In contrast, in this paper we take a closer look at this assumption, and present the first work that addresses the problems of validation, characterization and prediction of users attracted to badges.


It is a challenging task to answer the question whether a user was (is) in any way motivated by the badge. Users tend to evolve over time, and apart from badges there are usually many competing factors influencing their dynamics. Furthermore, neither ground truth nor counterfactual data showing behavior of users not influenced by badges are available.
In this paper, we focus on the most popular type of badges, i.e., threshold badges, that are awarded after a user performs a certain number of desired actions. The above challenges in this context can be addressed by simultaneously looking at users’ temporal traces and their general characteristics. In particular, we identified the following useful patterns:
-
–
attracted users change their mean behavior around the badge awarding time
-
–
influenceable users are similar
As an example, Figure 1 illustrates how user action rate changes due to the badge, and also shows the associated user features and statistics. In this paper, we propose two complementary solutions to the user badge influence problem exploiting the above observations. In both we apply users’ temporal traces (modeled as non-homogeneous Poisson processes) as a main source of the badge effect information and use associated covariates (user features and statistics) to regularize classification results.
Summary of Contributions. This paper makes the following contributions:
-
–
introduction and formalization of the user badge influence problem
-
–
validation and prediction of the influence of badges on individual users with two novel methods:
-
I.
a model-based algorithm to cluster (problem-specific) counting processes with covariates used to encode priors
-
II.
a statistical test complemented with a way of calibrating it by means of virtual badges bootstrapping and an adaptation of the EM clustering algorithm that refines the results of this test
-
I.
-
–
empirical evaluation using synthetic data
-
–
case studies of two badges from a popular Q&A platform
In the rest of the paper we’ll give an overview of related work, formalize the problem, provide a detailed description of our proposed solutions, and demonstrate their effectiveness on synthetic and real datasets.
2 Related Works
Our work extends previous studies on motivational mechanisms in social media [9, 12, 16] and in particular on understanding and modeling the effects of badges [2, 10, 21].
Previously, [14, 8, 21] worked on optimal badges design from a game-theoretic perspective. They relied on strong theoretical assumptions not necessarily satisfied in real data, including the assumption that badges always work. In this paper, we challenge this presumption. Early studies suggesting that may not always be the case appeared first in the educational context [1]. In the context of social media the problem of badges effectiveness was noticed very recently [5, 15, 11]. In these works researchers assumed badges effect to be binary, i.e., either a badge changes community functioning or not, and (apart from [15] who on the other hand worked with simpler single-action badges) focused on site-global statistics (total number of views, edits, etc.), whereas we take a user-level perspective and try to understand badge influence on individuals. This places our study closer to works trying to characterize susceptible users in social media, for example [3], and modeling user behavior in presence of badges [2, 18]. The latter two rely on a goal-gradient hypothesis (users become more active closer to badge) that we found hard to observe in individual users traces. In contrast, we focused on mean changes in user behavior around the time of badge awarding.
3 Problem Formulation
In this section, we present the problem of determination of badge influence on a user in a formal way, and introduce a point process model of user behavior in context of a badge.
Notation: Badges and Users. A digital threshold badge can be represented with a tuple:
where is the badge introduction time (= the time when the badge started being awarded), is an assigned action type, and is the badge threshold (= the number of type actions that need to be performed by a user in order to be awarded the badge).
User in context of the badge can be represented by a tuple:
where and designate user activeness interval (time span in which we test the badge effect), is a vector of badge covariates (e.g., user characteristics), is a set of timestamps of desired (=type ) actions, is the time when user received badge (=achieved level of actions). If the user has not received the badge yet (i.e., ), we set . Finally, the binary variable informs if the user is/was attracted by the badge reward perspective or not (the fact that user received a badge does not necessary imply that she had any interest in that – it could be just a side-effect of her normal activity).
Additionally, to simplify some of the later formulations, we define: , , , , , .
Influenced Users Validation and Prediction. We distinguish users influenced by the badge from those not attracted via the binary variable . Unfortunately, the variable is usually hidden. Its value recovery can be done in two practical settings:
-
I.
Validation: user received the badge () and we verify if it did not happen just by chance.
-
II.
Prediction: user has not received the badge yet () and we try to forecast if she may be interested in receiving it.
For neither of the tasks we know the truth. Therefore, we rely only on our assumptions relating badge influence with temporal traces () and users’ general characteristics (encoded in ).
Temporal Traces Model. It might be hard to observe if users attracted by the badge change their behavior when they receive it. However, temporal fluctuations and impact of competing factors can be reduced with averaging over time. In particular, we assume the following model of underlying temporal traces, where user ’s action times are drawn from the point process [7] controlled by the intensity that takes one of the two forms: or , depending on the latent variable :
-
–
(user not attracted by the badge): intensity is a constant (user does not change her behavior over time)
-
–
(user attracted by the badge): actions mean intensity changes when the badge is awarded at
However the our approach was inspired by the ideas from [15], we model every individual user with a separate non-homogeneous Poisson process whereas what they proposed is a survival process of all users considered together.
Formally, the model is expressed as follows:
| (1) | ||||
4 Learning Attracted Users via Poisson Processes Clustering
In this section, we introduce a novel model-based algorithm to cluster Poisson processes, that we use to identify users influenced by the badge. Its extended version employs covariates to regularize clusters assignment priors and allows for new users prediction.
Basic Model. We assume that the fraction of users attracted by the badge (having ) is , and the intensities (expressed in Eq. 3) come from the shared prior gamma distributions:
| (2) | ||||
The full model then has seven hyperparameters: , steering the behavior of users with respectively and , and controlling the fraction of users attracted by the badge. Latent variables are and action intensities and .
The model can be factorized thanks to independence between user probabilities and independence between Poisson processes on non-overlapping intervals, and then simplified via marginalization of latent intensities. The procedure leads to the following conditional user probabilities:
| (3) | ||||
The model collapses to a mixture-model with two clusters determined by and and controlled by hyperparameters and , and with mixing factor . Cluster assignments and hyperparameters in this class of models are typically inferred with an EM-like procedure that consists of two alternating steps taking in our case the following form:
-
I.
Maximization: hyperparameters are updated:
where the complete-data likelihood per user relies on per-cluster user likelihoods expressed in Eq. 4:
A closed-form solution to the optimization problem does not exist. Instead, we first find cluster probabilities:
(4) and then resort to numerical optimization with positivity constraints to find and
-
II.
Expectation: posterior cluster responsibilities are found in the usual way:
Including Covariates. Badges attract users of similar characteristics and therefore user influence covariates can be applied for clustering improvement as a form of regularization. We incorporate them in the our hierarchical model similar to [17] by replacing the constant cluster membership prior with user personalized ones, i.e., that we furthermore posit to have a functional form:
| (5) |
where are parameters of the function . In general, can be any function (for example neural network) but due to its simplicity we choose logistic regression, i.e., .
Conditional independence between the priors for cluster memberships and clusters’ parameters implies that the inference procedure described above can be adjusted in a simple way by replacing the updates in Eq. 4 with the following optimization of vector :
Prediction. For a new user without temporal trace we predict badge attraction only relying on her features and statistics:
5 Learning Attracted Users with NHST and Covariates Clustering
In this section, we propose a two-phase procedure validating badge influence on users. In the first phase, we approximately identify users influenced by the badge with a robust Null Hypothesis Significance Testing (NHST) procedure. In the second phase, we refine assignments with a semi-supervised clustering of covariates.
5.1 Robust Validation of Attracted Users
Behavior Change Testing. The alternative that a user was or was not attracted by the badge can be expressed in terms of the null and the alternative hypotheses:
Under the model in Eq 3 we can restate it in the following way:
Test Statistic. We use a standard log-likelihood ratio between likelihoods corresponding to and as a test statistic [13] which in our case takes the following form:
where we plug-in MLE estimates for respective intensities: , , and assume that .
Robust Estimation of the Test Statistic Distribution. Asymptotically the test statistic for nested models has an approximate chi-square distribution [20] with the number of degrees of freedom equal to difference between compared models, e.g., in our case . The test statistic transformation to p-value is then given by: where is a chi-square CDF.
The standard procedure can detect a change in user behavior happening around , but is not able to differentiate between the badge causal effect and other competing factors. Instead, we design and apply the calibration procedure (similar to [15]) that accounts for them by simulating a counter-factual world where the badge was never awarded and measuring the strength of observed changes there. In practice the test statistic empirical distribution is estimated with the following virtual badges bootstrapping procedure:
-
1.
Sample virtual badges where is some small margin.
-
2.
Remove the true badge effect by putting it outside the updated activeness limits:
-
3.
Evaluate with simulated and adequately updated .
-
4.
Approximate empirical p-value:
5.2 Assignment Refining via Semi-supervised Clustering of Covariates
NHST Assignments Misclassification. The above testing procedure applied to each user splits the population into two groups: positives for whom we managed to reject at significance level and negatives for whom we failed to reject . Although this can be used as a first approximation to , both groups contain many misclassified cases. In particular, the false positives rate (FPR) and the false negatives rate (FNR) depend on the statistical test power and prevalence of the positives over negatives, that both are unknown. For example, [19, 6] estimate FPR to be at least around 25% when the prior probability of a real effect is and . This means that at least of users initially assigned actually have . For , the fraction of misclassified cases would be even higher.
Semi-Supervised Clustering with Group Priors. We achieve the reduction of the above classification error employing a novel semi-supervised extension to the standard EM algorithm for gaussian mixtures [4] The extended algorithm works (=clusters users) in covariates space but additionally employs the information transferred from the first (=NHST) phase. In particular, initial user assignments and our beliefs about misclassification rates we encode in priors to cluster assignments (=mixing coefficients).
NHST classification splits users into two groups, where and are respectively users initially classified as positives and negatives. For each group we propose to use separate mixing coefficients with Dirichlet hyperpriors, i.e., , where is a standard parameter controlling the number of clusters (in contrast to Poisson processes clustering, in covariates space we can have arbitrary number of clusters). In order to be able to interpret clustering results, for each cluster we assign either (clusters denoted as ) or (clusters denoted as ). Finally, we can initialize the algorithm as follows:
Values of encode beliefs of how many users from group should end up in cluster according to our trust in the initial classification based on NHST. Parameter balances between classification and clustering impact and informs how sure we are about the values of FPR and FNR. For example, we use , and .
The model fitting is performed in a standard way via EM, apart from two differences: (1) when calculating expectations new priors are used, and (2) in the maximization step are updated per group:
where are posterior cluster responsibilities.
Prediction. Prediction of new users can be performed via co-clustering. Specifically, users for which we could not perform the statistical test we include into the clustering as a new group with uninformative priors, for example . The rest of the method remains unaltered.
Co-clustering of users with badge and without badge can improve classification results in both validation and prediction, but the data distributions must be similar in terms of groupping attracted and not-attracted users. This assumption may be hard to ensure for real data. Therefore, to improve robustness and prediction quality, we propose to first cluster users with badge using the above procedure and then employ clustering results to train a standard classifier with better generalization properties, for example logistic regression.
6 Synthetic Data Evaluation
In this section, we compare with the help of synthetically generated data the effectiveness of the proposed approaches for validation and prediction of users attracted by the badge.
Poisson clustering
NHST bootstrap
2-phase bootstrap
Validation


Prediction

Basic Setting. We simulate the behavior of users: users with both temporal dynamics and covariates , and users with only covariates , that imitate new users. For each user we assign a latent variable : with probability : and with probability : .
The users’ temporal traces we sample according to intensities expressed in Eq. 3. The intensities and we draw according to Eq. 4 where we fix variances and means , , and intensity we fix respectively to . The parameter controls the strength of the simulated badge effect. In the basic setting, randomness in individual user temporal trace appears due to point processes sampling procedure.
Users are independent, and therefore without loss of generality we can assume start times for all users . Furthermore, we set badge awarding time to for users with , and for users with . User end times we set to ().
We sample user features from bivariate (=two features per user) normal distributions:
where covariance matrix , is the largest singular value of corresponding to eigenvector , and controls discrepancy between features of users from different groups.
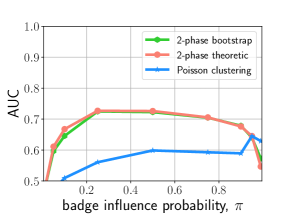
Disturbed Data Setting. We study the robustness of our methods by simulating disturbed data, e.g., temporal fluctuations in user intensities. In particular, we add (typical for real data) temporal trend, i.e., becomes , where controls the extent of the simulated fluctuation.
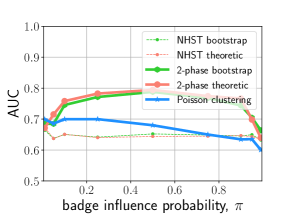
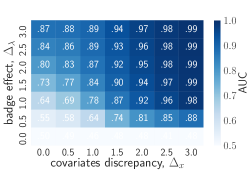
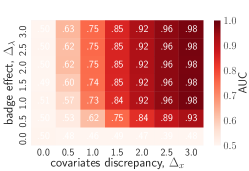
Evaluation. In contrast to what is the case for real data, for synthetic data we know user attitude towards the badge () and therefore we can evaluate prediction results against it. Specifically, we employ Area Under Curve (AUC) that accounts for uncertainty in our methods predictions. We measure AUC separately for users with full information (user validation problem) and for users with limited data (user prediction problem). Every experiment we repeat times and then average results.
Results. Figure 2 summarizes the simulation results in the basic setting for varying badge effects () and clusterization levels (). The methods based on our 2-phase procedure (we show results only for bootstrap variant; results for theoretic variant in the basic setting are identical) improve over the basic NHST classification and have a superior performance over Poisson (processes) clustering. Poisson clustering fails when intensity differences between user classes are small (e.g., ). We found that the method in the considered variant (with logistic regression in Eq. 5) does not benefit sufficiently from differences between users’ covariates () and as a result underestimates the probabilities of badges having effect.
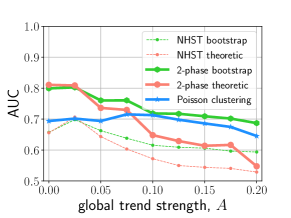
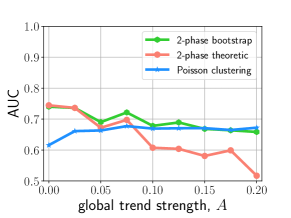
Fluctuations in the temporal data lead to performance degradation. For example, Figure 3 shows how AUC is decreasing when divergence from the models (controlled by trend ) is increasing. The most affected method is 2-phase theoretic (2-phase procedure with theoretic estimation of the test statistic distribution). The intermediate results (NHST theoretic) confirm that the method tend to overestimate badge influence when fluctuations are strong. However the least affected is Poisson processes clustering, it never outperforms 2-phase bootstrap - the robust variant of the our 2-phase procedure.
Finally, we investigate our methods in terms of sensitivity to class imbalance (Figure 4). Class imbalance has a low impact on validation performance. It happens because the main indicator of the badge influence on user is a change in individual user dynamics around the badge awarding time and covariates are only ‘regularizers’. On the other hand, the prediction relies entirely on covariates and if one class is underrepresented covariates distributions are poorly fitted and prediction fails, e.g., AUC approaches for both very small and large .
7 Real Data Experiments
In this section, we investigate the effectiveness of our methods when applied to real data, i.e., two sample badges from a popular Q&A platform.
Data Description and Preprocessing. In the real-data experiments we used a Stack Overflow dataset 444https://archive.org/details/stackexchange, that contains timestamped events from between July 2008 and September 2014 and some basic information about users. In particular, we used the following user features and statistics as badge covariates:
-
–
user age and location
-
–
total number of user page views, posted comments, upvotes and downvotes
From location we extracted city and state names that we independently embedded using a pre-trained word2vec model555https://code.google.com/archive/p/word2vec/. Embeddings were clustered separately into 5+5 clusters using k-means and distances to cluster centers were subsequently used as covariates: 5 for city and 5 for state. We transformed user statistics by applying the following transformation: . We also filtered out users with incomplete records.
We demonstrate the effectiveness of the proposed approaches for two sample threshold badges666https://meta.stackexchange.com/questions/67397/:
-
–
Research Assistant: awarded to users who edited at least wiki sites describing tags (wiki tag edits). Users with reputation777https://stackoverflow.com/help/whats-reputation or higher can perform these actions.
-
–
Copy Editor: awarded to users who performed a total of post (e.g., question or answer) edits. Users with reputation or higher can perform these actions.
Results. Figure 5 illustrates validation results from Poisson processes clustering and 2-phase bootstrap alongside with intermediate results from NHST bootstrap. The classification results from different methods agree (=badge effect probability either larger than or smaller than in both cases) to a high degree. For example, for Research Assistant we observe 70% agreement between Poisson clustering and 2-phase bootstrap. With we can reject the hypothesis that it happens by chance. Similarly, for Copy Editor we report .
Poisson clustering
NHST bootstrap
2-phase bootstrap
Research Assistant
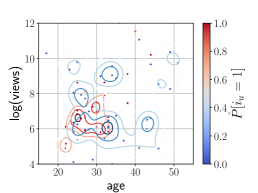
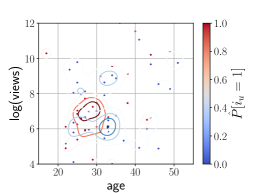
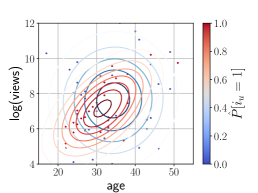
Copy Editor


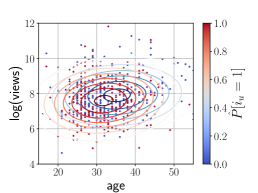
The validation results suggest that only about half (i.e., 58% for Research Assistant and 47% for Copy Editor according to 2-phase bootstrap) of the users intentionally performed actions needed to receive the badge. Prediction results are less conclusive. However, in 2-phase bootstrap classification for Research Assistant and for Copy Editor we got respectively 53% and 39% of users potentially attracted to the badge (only users with sufficient reputation included), Poisson processes clustering classified all new users as unlikely interested in the badges. We presume that this can happen due to differences between data distributions of users with and without badge that are handled differently by the methods.
Examination of fitted models can give deeper insights into how user characteristics relate to badges influence. In particular, we ranked covariates according to Kullback–Leibler divergence between both user classes () and reported means of the respective distributions. We observed that features derived from location best discriminate between classes. For example, we discovered that users located in the USA were getting badges more often by chance – due to their natural high activeness. On the other hand, users from East Europe and India were more mercenary – their behavior was more often driven by the perspective of a badge reward. Similarly, we found out that younger users on average were more goal-oriented than older ones.
8 Conclusions
Badges are a popular motivational mechanism used in social media sites. However, due to complexity of these environments, the belief that they really work, i.e., are incentivizing users to perform certain actions, is hard to verify and until recently there were no tools for that. To address this problem we designed and evaluated two approaches to verify individual users attraction towards badges. The proposed methods applied to real data from Stack Overflow let us to gain interesting insights about users who earn badges. In particular, in contradiction to previous beliefs we discovered that many of them receive badges by chance, having no prior intention of it.
Our work can be extended in many ways. For example, it would be interesting to see how more advanced features, like temporal features covering user evolution on early stage, can improve the performance of our methods. Furthermore, we focused our research on threshold badges (that are the most popular ones) but there are many other interesting designs (for example badges associated to limited resources) for which the problem of influence validation remains open. Finally, we believe that our results should affect how badges are designed and help in making them more effective.
Acknowledgements
We thank Manuel Gomez-Rodriguez for inspiring us to perform this research, Eliezer de Souza da Silva for useful discussions, and both of them along with Sean Chester for critical review of the publication.
References
- [1] S. Abramovich, C. Schunn, and R. M. Higashi. Are badges useful in education?: It depends upon the type of badge and expertise of learner. Educational Technology Research and Development, 61(2):217–232, 2013.
- [2] A. Anderson, D. Huttenlocher, J. Kleinberg, and J. Leskovec. Steering user behavior with badges. In Proceedings of the 22nd international conference on World Wide Web, 2013.
- [3] S. Aral and D. Walker. Identifying influential and susceptible members of social networks. Science, 337(6092):337–341, 2012.
- [4] C. M. Bishop. Pattern Recognition and Machine Learning (Information Science and Statistics). Springer-Verlag New York, Inc., Secaucus, NJ, USA, 2006.
- [5] B. Bornfeld and S. Rafaeli. Gamifying with badges: A big data natural experiment on stack exchange. First Monday, 22(6), 2017.
- [6] D. Colquhoun. An investigation of the false discovery rate and the misinterpretation of p-values. Royal Society Open Science, 1(3), 2014.
- [7] D. Daley and D. Vere-Jones. An Introduction to the Theory of Point Processes: Volume I: Elementary Theory and Methods. Probability and Its Applications. Springer, 2002.
- [8] D. Easley and A. Ghosh. Incentives, gamification, and game theory: an economic approach to badge design. ACM Transactions on Economics and Computation, 4(3):16, 2016.
- [9] A. Ghosh and P. McAfee. Incentivizing high-quality user-generated content. In Proceedings of the 20th international conference on World wide web, pages 137–146, 2011.
- [10] D. Gibson, N. Ostashewski, K. Flintoff, S. Grant, and E. Knight. Digital badges in education. Education and Information Technologies, 20(2):403–410, 2015.
- [11] J. Hamari. Do badges increase user activity? a field experiment on the effects of gamification. Computers in Human Behavior, 71:469 – 478, 2017.
- [12] J. Hamari, J. Koivisto, and H. Sarsa. Does gamification work?–a literature review of empirical studies on gamification. In System Sciences (HICSS), 2014 47th Hawaii International Conference on, pages 3025–3034. IEEE, 2014.
- [13] R. V. Hogg and A. T. Craig. Introduction to mathematical statistics. Prentice Hall, 1995.
- [14] N. Immorlica, G. Stoddard, and V. Syrgkanis. Social status and badge design. In Proceedings of the 24th international conference on World Wide Web, 2015.
- [15] T. Kusmierczyk and M. Gomez-Rodriguez. Harnessing natural experiments to quantify the causal effect of badges. arXiv:1707.08160., 2017.
- [16] M. Lewis. The influence of loyalty programs and short-term promotions on customer retention. Journal of marketing research, 41(3):281–292, 2004.
- [17] D. Liang, L. Charlin, J. McInerney, and D. M. Blei. Modeling user exposure in recommendation. In Proceedings of the 25th International Conference on World Wide Web, WWW 2016, Montreal, Canada, April 11 - 15, 2016, pages 951–961, 2016.
- [18] T. Mutter and D. Kundisch. Behavioral mechanisms prompted by badges: The goal-gradient hypothesis. In Proceedings of the 35th International Conference on Information Systems, 2014.
- [19] T. Sellke, M. J. Bayarri, and J. O. Berger. Calibration of values for testing precise null hypotheses. The American Statistician, 55(1):62–71, 2001.
- [20] S. S. Wilks. The large-sample distribution of the likelihood ratio for testing composite hypotheses. The Annals of Mathematical Statistics, 9(1):60–62, 1938.
- [21] J. Zhang, X. Kong, and P. S. Yu. Badge System Analysis and Design. In Proceedings of the 2016 IEEE/ACM International Conference on Advances in Social Networks Analysis and Mining, 2016.