Exclusion of multifold solutions of the CKM Unitarity Triangle by a time-dependent Dalitz plot analysis of B¯0D()0h0superscript¯𝐵0superscript𝐷0superscript0\overline{B}^{0}\rightarrow D^{(*)0}h^{0} with D0KS0π+πsuperscript𝐷0subscriptsuperscript𝐾0𝑆superscript𝜋superscript𝜋D^{0}\rightarrow K^{0}_{S}\pi^{+}\pi^{-} decays combining BABAR and Belle data


Gerald Eigen (for the B AB AR Collaboration)
Department of Physics and Technology
Universisy of Bergen
-5007 Bergen, NORWAY


Talk presented at the APS Division of Particles and Fields Meeting (DPF 2017), July 31-August 4, 2017, Fermilab. C170731.

Abstract

We present results of a new analysis campaign, which combines the final data samples collected by the B factory experiments B AB AR and Belle in single physics analyses to achieve a unique sensitivity in time-dependent CP𝐶𝑃C\!P violation measurements. The data samples contain (471±3)×106BB¯plus-or-minus4713superscript106𝐵¯𝐵(471\pm 3)\times 10^{6}~{}B\overline{B} pairs recorded by the B AB AR detector and (772±11)×106BB¯plus-or-minus77211superscript106𝐵¯𝐵(772\pm 11)\times 10^{6}~{}B\overline{B} pairs recorded by the Belle detector in e+esuperscript𝑒superscript𝑒e^{+}e^{-} collisions at the center-of-mass energies corresponding to the mass of the Υ(4S)Υ4𝑆\Upsilon(4S) resonance at the asymmetric-energy B𝐵B factories PEP-II at SLAC and KEKB at KEK, respectively. We present a measurement of sin2β2𝛽\sin 2\beta and cos2β2𝛽\cos 2\beta by a time-dependent Dalitz plot analysis of B0D()h0superscript𝐵0superscript𝐷superscript0B^{0}\rightarrow D^{(*)}h^{0} with DKS0π+π𝐷subscriptsuperscript𝐾0𝑆superscript𝜋superscript𝜋D\rightarrow K^{0}_{S}\pi^{+}\pi^{-} decays. A first evidence for cos2β>02𝛽0\cos 2\beta>0, the exclusion of trigonometric multifold solutions of the Unitarity Triangle and an observation of CP𝐶𝑃C\!P violation are reported.

1 Introduction

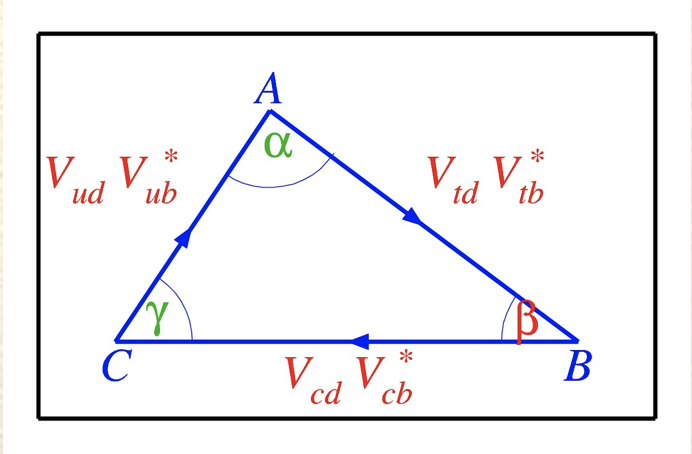
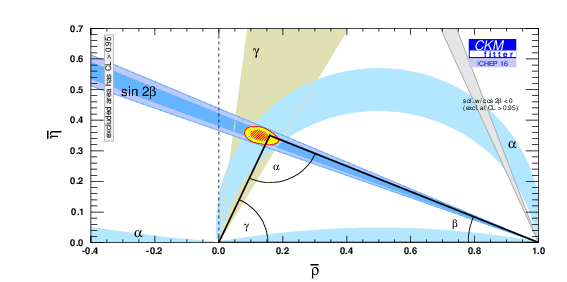
In the Standard Model, CP𝐶𝑃C\!P violation originates from the phase of the CKM matrix [1]. The unitarity relation VubVud+VcbVcd+VtbVtd=0superscriptsubscript𝑉𝑢𝑏subscript𝑉𝑢𝑑superscriptsubscript𝑉𝑐𝑏subscript𝑉𝑐𝑑superscriptsubscript𝑉𝑡𝑏subscript𝑉𝑡𝑑0V_{ub}^{*}V_{ud}+V_{cb}^{*}V_{cd}+V_{tb}^{*}V_{td}=0 represents the so-called Unitarity Triangle (UT) illustrated in Fig. 1 (left). Sides VubVudsuperscriptsubscript𝑉𝑢𝑏subscript𝑉𝑢𝑑V_{ub}^{*}V_{ud}, VcbVcdsuperscriptsubscript𝑉𝑐𝑏subscript𝑉𝑐𝑑V_{cb}^{*}V_{cd}, VtbVtdsuperscriptsubscript𝑉𝑡𝑏subscript𝑉𝑡𝑑V_{tb}^{*}V_{td} and angles α,β,γ𝛼𝛽𝛾\alpha,\beta,\gamma are extracted from many measurements in the B𝐵B and K𝐾K systems. At the B𝐵B factories, sin2β2𝛽\sin 2\beta is measured in time-dependent CP𝐶𝑃C\!P asymmetries of B0K0cc¯superscript𝐵0superscript𝐾0𝑐¯𝑐B^{0}\rightarrow K^{0}c\overline{c} decays in which the cc¯𝑐¯𝑐c\overline{c} forms a charmonium resonance [2]. The determination of β𝛽\beta from sin2β2𝛽\sin 2\beta measurements leads to a two-fold ambiguity on 2β2𝛽2\beta for η<90𝜂superscript90\eta<90^{\circ}, yielding β=21.9𝛽superscript21.9\beta=21.9^{\circ} and β=π/221.9=68.1𝛽𝜋2superscript21.9superscript68.1\beta=\pi/2-21.9^{\circ}=68.1^{\circ} as shown in Fig. 1 (right) [3]. To lift this ambiguity, a measurement of cos2β2𝛽\cos 2\beta is necessary.

Refer to caption
Refer to caption
Figure 1: Graphical representation of the Unitarity Triangle defining the sides VubVudsuperscriptsubscript𝑉𝑢𝑏subscript𝑉𝑢𝑑V_{ub}^{*}V_{ud}, VcbVcdsuperscriptsubscript𝑉𝑐𝑏subscript𝑉𝑐𝑑V_{cb}^{*}V_{cd}, VtbVtdsuperscriptsubscript𝑉𝑡𝑏subscript𝑉𝑡𝑑V_{tb}^{*}V_{td} and angles α,β,γ𝛼𝛽𝛾\alpha,\beta,\gamma (left). Present status of the Unitarity Triangle showing the two solutions of β=21.9𝛽superscript21.9\beta=21.9^{\circ} and β=68.1𝛽superscript68.1\beta=68.1^{\circ} (right).

2 Analysis Methodology

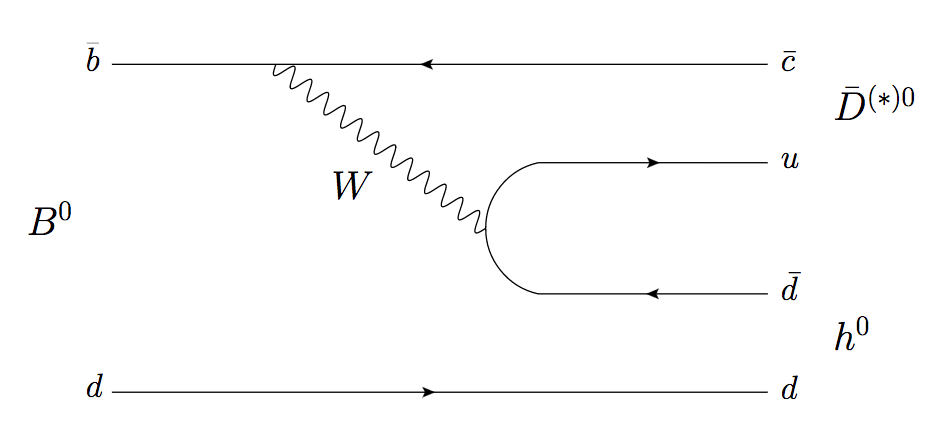
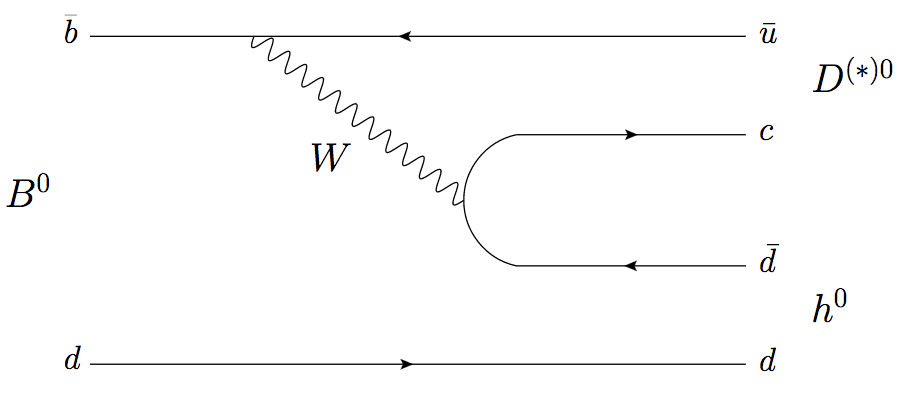
We perform a time-dependent Dalitz plot analysis of B¯0D()0h0superscript¯𝐵0superscript𝐷0superscript0\overline{B}^{0}\rightarrow D^{(*)0}h^{0} with D0KS0π+πsuperscript𝐷0subscriptsuperscript𝐾0𝑆superscript𝜋superscript𝜋D^{0}\rightarrow K^{0}_{S}\pi^{+}\pi^{-} decays and where h0superscript0h^{0} represents a π0γγsuperscript𝜋0𝛾𝛾\pi^{0}\rightarrow\gamma\gamma, ηγγ,π+ππ0𝜂𝛾𝛾superscript𝜋superscript𝜋superscript𝜋0\eta\rightarrow\gamma\gamma,\pi^{+}\pi^{-}\pi^{0} or ωπ+ππ0𝜔superscript𝜋superscript𝜋superscript𝜋0\omega\rightarrow\pi^{+}\pi^{-}\pi^{0}. Figure 2 shows the lowest-order Feynman diagrams. The bcu¯d𝑏𝑐¯𝑢𝑑b\rightarrow c\overline{u}d tree dominates whereas the contribution from the doubly-CKM suppressed tree buc¯d𝑏𝑢¯𝑐𝑑b\rightarrow u\overline{c}d is small. The tree amplitudes interferes with the amplitude of corresponding B¯0¯𝐵0\overline{B}0 decay that is produced via B0B¯0superscript𝐵0superscript¯𝐵0B^{0}\overline{B}^{0} mixing. Thus, the absolute amplitudes squared for B0superscript𝐵0B^{0} and B¯0superscript¯𝐵0\overline{B}^{0} decay are [4]

|MB0(Δt)|2superscriptsubscript𝑀superscript𝐵0Δ𝑡2\displaystyle|M_{B^{0}}(\Delta t)|^{2} =\displaystyle= |𝒜D¯0×cos(12ΔmΔt)ie+2iβ×𝒜D0×sin(12ΔmΔt)|2superscriptsubscript𝒜superscript¯𝐷012Δ𝑚Δ𝑡𝑖superscript𝑒2𝑖𝛽subscript𝒜superscript𝐷012Δ𝑚Δ𝑡2\displaystyle|{\cal A}_{\overline{D}^{0}}\times\cos(\frac{1}{2}\Delta m\Delta t)-ie^{+2i\beta}\times{\cal A}_{D^{0}}\times\sin(\frac{1}{2}\Delta m\Delta t)|^{2} (1)
|MB¯0(Δt)|2superscriptsubscript𝑀superscript¯𝐵0Δ𝑡2\displaystyle|M_{\overline{B}^{0}}(\Delta t)|^{2} =\displaystyle= |𝒜D0×cos(12ΔmΔt)ie2iβׯAD0×sin(12ΔmΔt)|2,superscriptsubscript𝒜superscript𝐷012Δ𝑚Δ𝑡𝑖superscript𝑒2𝑖𝛽¯absentsubscript𝐴superscript𝐷012Δ𝑚Δ𝑡2\displaystyle|{\cal A}_{D^{0}}\times\cos(\frac{1}{2}\Delta m\Delta t)-ie^{-2i\beta}\times{\overline{\cal}A}_{D^{0}}\times\sin(\frac{1}{2}\Delta m\Delta t)|^{2},

where 𝒜D¯0subscript𝒜superscript¯𝐷0{\cal A}_{\overline{D}^{0}} and 𝒜D0subscript𝒜superscript𝐷0{\cal A}_{D^{0}} are the amplitudes of the D¯0KS0π+πsuperscript¯𝐷0subscriptsuperscript𝐾0𝑆superscript𝜋superscript𝜋\overline{D}^{0}\rightarrow K^{0}_{S}\pi^{+}\pi^{-} and D0KS0π+πsuperscript𝐷0subscriptsuperscript𝐾0𝑆superscript𝜋superscript𝜋D^{0}\rightarrow K^{0}_{S}\pi^{+}\pi^{-} decays. The interference of the D¯0superscript¯𝐷0\overline{D}^{0} and the D0superscript𝐷0D^{0} in the Dalitz plot introduce a dependence on cos2β2𝛽\cos 2\beta. Belle previously measured cos2β=1.05±0.330.15+0.212𝛽plus-or-minus1.05subscriptsuperscript0.330.210.15\cos 2\beta=1.05\pm 0.33^{+0.21}_{-0.15} [5]. By combining B AB AR and Belle data consisting of a total luminosity of 1.1ab11.1superscriptab11.1~{}\rm ab^{-1}, the sensitivity to cos2β2𝛽\cos 2\beta is greatly improved. The first step is to develop a Dalitz plot model for D0KS0π+πsuperscript𝐷0subscriptsuperscript𝐾0𝑆superscript𝜋superscript𝜋D^{0}\rightarrow K^{0}_{S}\pi^{+}\pi^{-} decay followed by the extraction of the B¯0D()0h0superscript¯𝐵0superscript𝐷0superscript0\overline{B}^{0}\rightarrow D^{(*)0}h^{0} signal for which a time-dependent CP𝐶𝑃C\!P analysis is performed.

Refer to caption
Refer to caption
Figure 2: Lowest-order tree diagram (left) and doubly-CKM-suppressed tree diagram (right) for B¯0D()0h0superscript¯𝐵0superscript𝐷0superscript0\overline{B}^{0}\rightarrow D^{(*)0}h^{0} with D0KS0π+πsuperscript𝐷0subscriptsuperscript𝐾0𝑆superscript𝜋superscript𝜋D^{0}\rightarrow K^{0}_{S}\pi^{+}\pi^{-} decays.

2.1 D0KS0π+πsuperscript𝐷0subscriptsuperscript𝐾0𝑆superscript𝜋superscript𝜋D^{0}\rightarrow K^{0}_{S}\pi^{+}\pi^{-} Dalitz Plot Amplitude Model

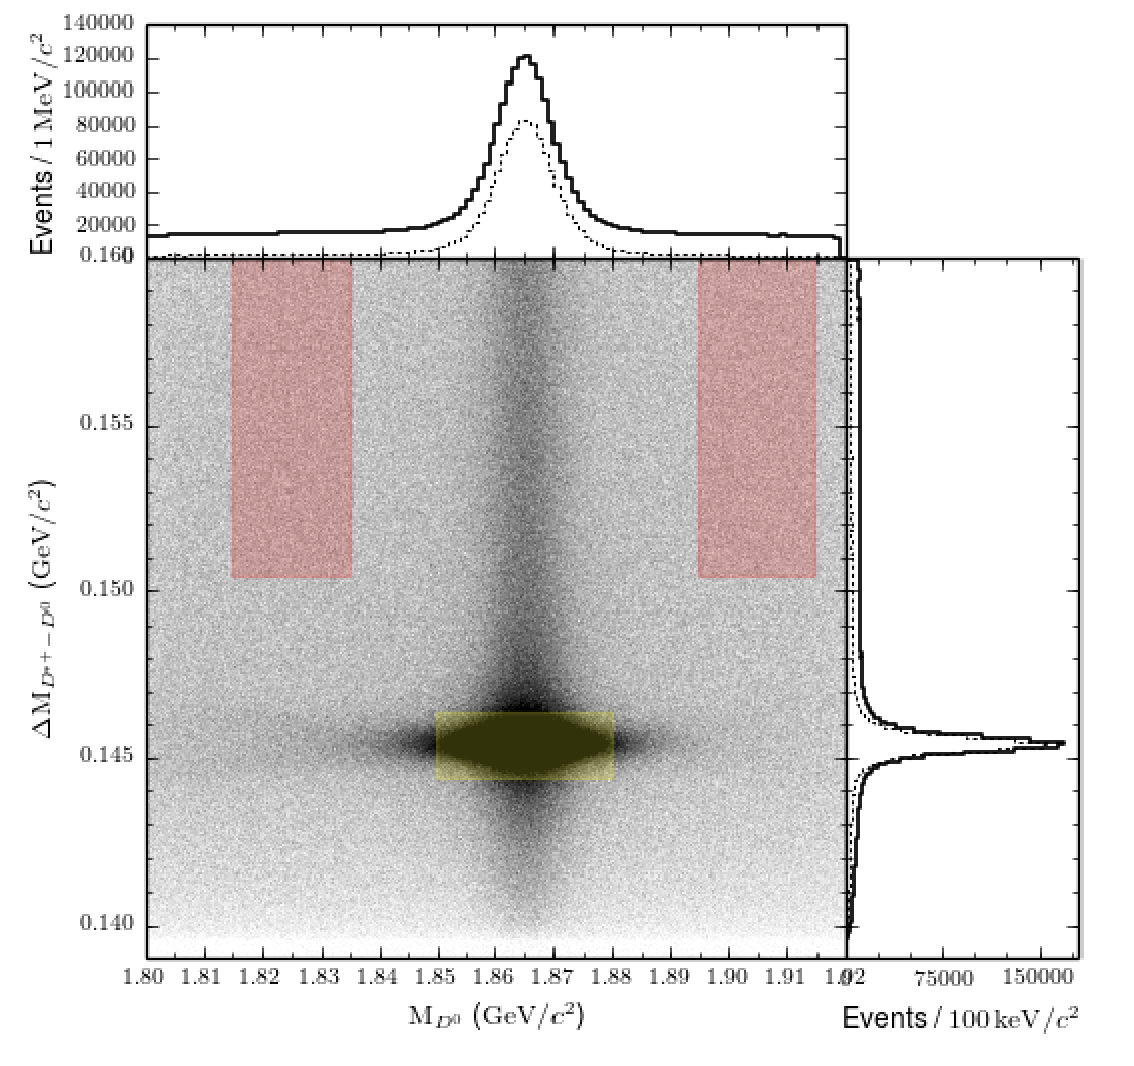
The D0KS0π+πsuperscript𝐷0subscriptsuperscript𝐾0𝑆superscript𝜋superscript𝜋D^{0}\rightarrow K^{0}_{S}\pi^{+}\pi^{-} Dalitz plot model was built using Belle e+ecc¯superscript𝑒superscript𝑒𝑐¯𝑐e^{+}e^{-}\rightarrow c\overline{c} data. The D0superscript𝐷0D^{0} is produced in the decay D+D0πs+superscript𝐷absentsuperscript𝐷0subscriptsuperscript𝜋𝑠D^{*+}\rightarrow D^{0}\pi^{+}_{s}. The charge of the slow πs+subscriptsuperscript𝜋𝑠\pi^{+}_{s} determines the flavor of the D0superscript𝐷0D^{0}. To remove background from B𝐵B decays, we require the candidate momentum for decays in the Υ(4S)Υ4𝑆\Upsilon(4S) (Υ(5S)Υ5𝑆\Upsilon(5S)) center-of-mass systems to satisfy p(D+)>2.5(3.1)GeVsuperscript𝑝superscript𝐷absent2.53.1GeVp^{*}(D^{*+})>2.5~{}(3.1)~{}\rm GeV. We determine D+superscript𝐷absentD^{*+} decay vertex with a kinematic fit for the D0superscript𝐷0D^{0} daughter with the constraint to originate from the e+esuperscript𝑒superscript𝑒e^{+}e^{-} interaction region. Furthermore, we require that the slow πs+subscriptsuperscript𝜋𝑠\pi^{+}_{s} originates from the D+superscript𝐷absentD^{*+} decay vertex to improve the resolution of the D+D0superscript𝐷absentsuperscript𝐷0D^{*+}-D^{0} mass difference. We then extract D+D0πs+superscript𝐷absentsuperscript𝐷0subscriptsuperscript𝜋𝑠D^{*+}\rightarrow D^{0}\pi^{+}_{s} yield from a two-dimensional fit to the D0superscript𝐷0D^{0} mass and D+D0superscript𝐷absentsuperscript𝐷0D^{*+}-D^{0} mass difference. Figure 3 shows the scatter plot of the D0superscript𝐷0D^{0} mass versus the D+D0superscript𝐷absentsuperscript𝐷0D^{*+}-D^{0} mass difference. We obtain a yield of of 1.22 million signal events in the region of 144.4<MDMD<146.4144.4subscript𝑀superscript𝐷subscript𝑀𝐷146.4144.4<M_{D^{*}}-M_{D}<146.4 MeV and 1850<MD0<18801850subscript𝑀superscript𝐷018801850<M_{D^{0}}<1880 MeV with a purity of 94%percent9494\%.

Refer to caption
Figure 3: Scatter plot of the D+D0superscript𝐷absentsuperscript𝐷0D^{*+}-D^{0} mass difference versus the D0superscript𝐷0D^{0} mass and its projections. The yellow and red bands show the signal and sideband regions, respectively. The dashed lines indicate the signal contributions.

We fit the D0KS0π+πsuperscript𝐷0subscriptsuperscript𝐾0𝑆superscript𝜋superscript𝜋D^{0}\rightarrow K^{0}_{S}\pi^{+}\pi^{-} Dalitz plot with isobars accounting for 13 intermediate two-body resonances and Kπ𝐾𝜋K\pi and ππ𝜋𝜋\pi\pi S-waves where the S-waves are modelled by the LASS [8] and K-matrix [7] parameterizations, respectively.

𝒜D0(m+2,m2)=r(Kπ,ππ)L=0areiϕr𝒜r(m+2,m2)+𝒜(kπ)L=0(s)+F1(s)subscript𝒜superscript𝐷0subscriptsuperscript𝑚2subscriptsuperscript𝑚2subscript𝑟subscript𝐾𝜋𝜋𝜋L0subscript𝑎𝑟superscript𝑒𝑖subscriptitalic-ϕ𝑟subscript𝒜𝑟subscriptsuperscript𝑚2subscriptsuperscript𝑚2subscript𝒜subscript𝑘𝜋L0𝑠subscript𝐹1𝑠{\cal A}_{D^{0}}(m^{2}_{+},m^{2}_{-})=\sum_{r\neq(K\pi,\pi\pi)_{\rm L=0}}a_{r}e^{i\phi_{r}}{\cal A}_{r}(m^{2}_{+},m^{2}_{-})+{\cal A}_{(k\pi)_{\rm L=0}}(s)+F_{1}(s) (2)

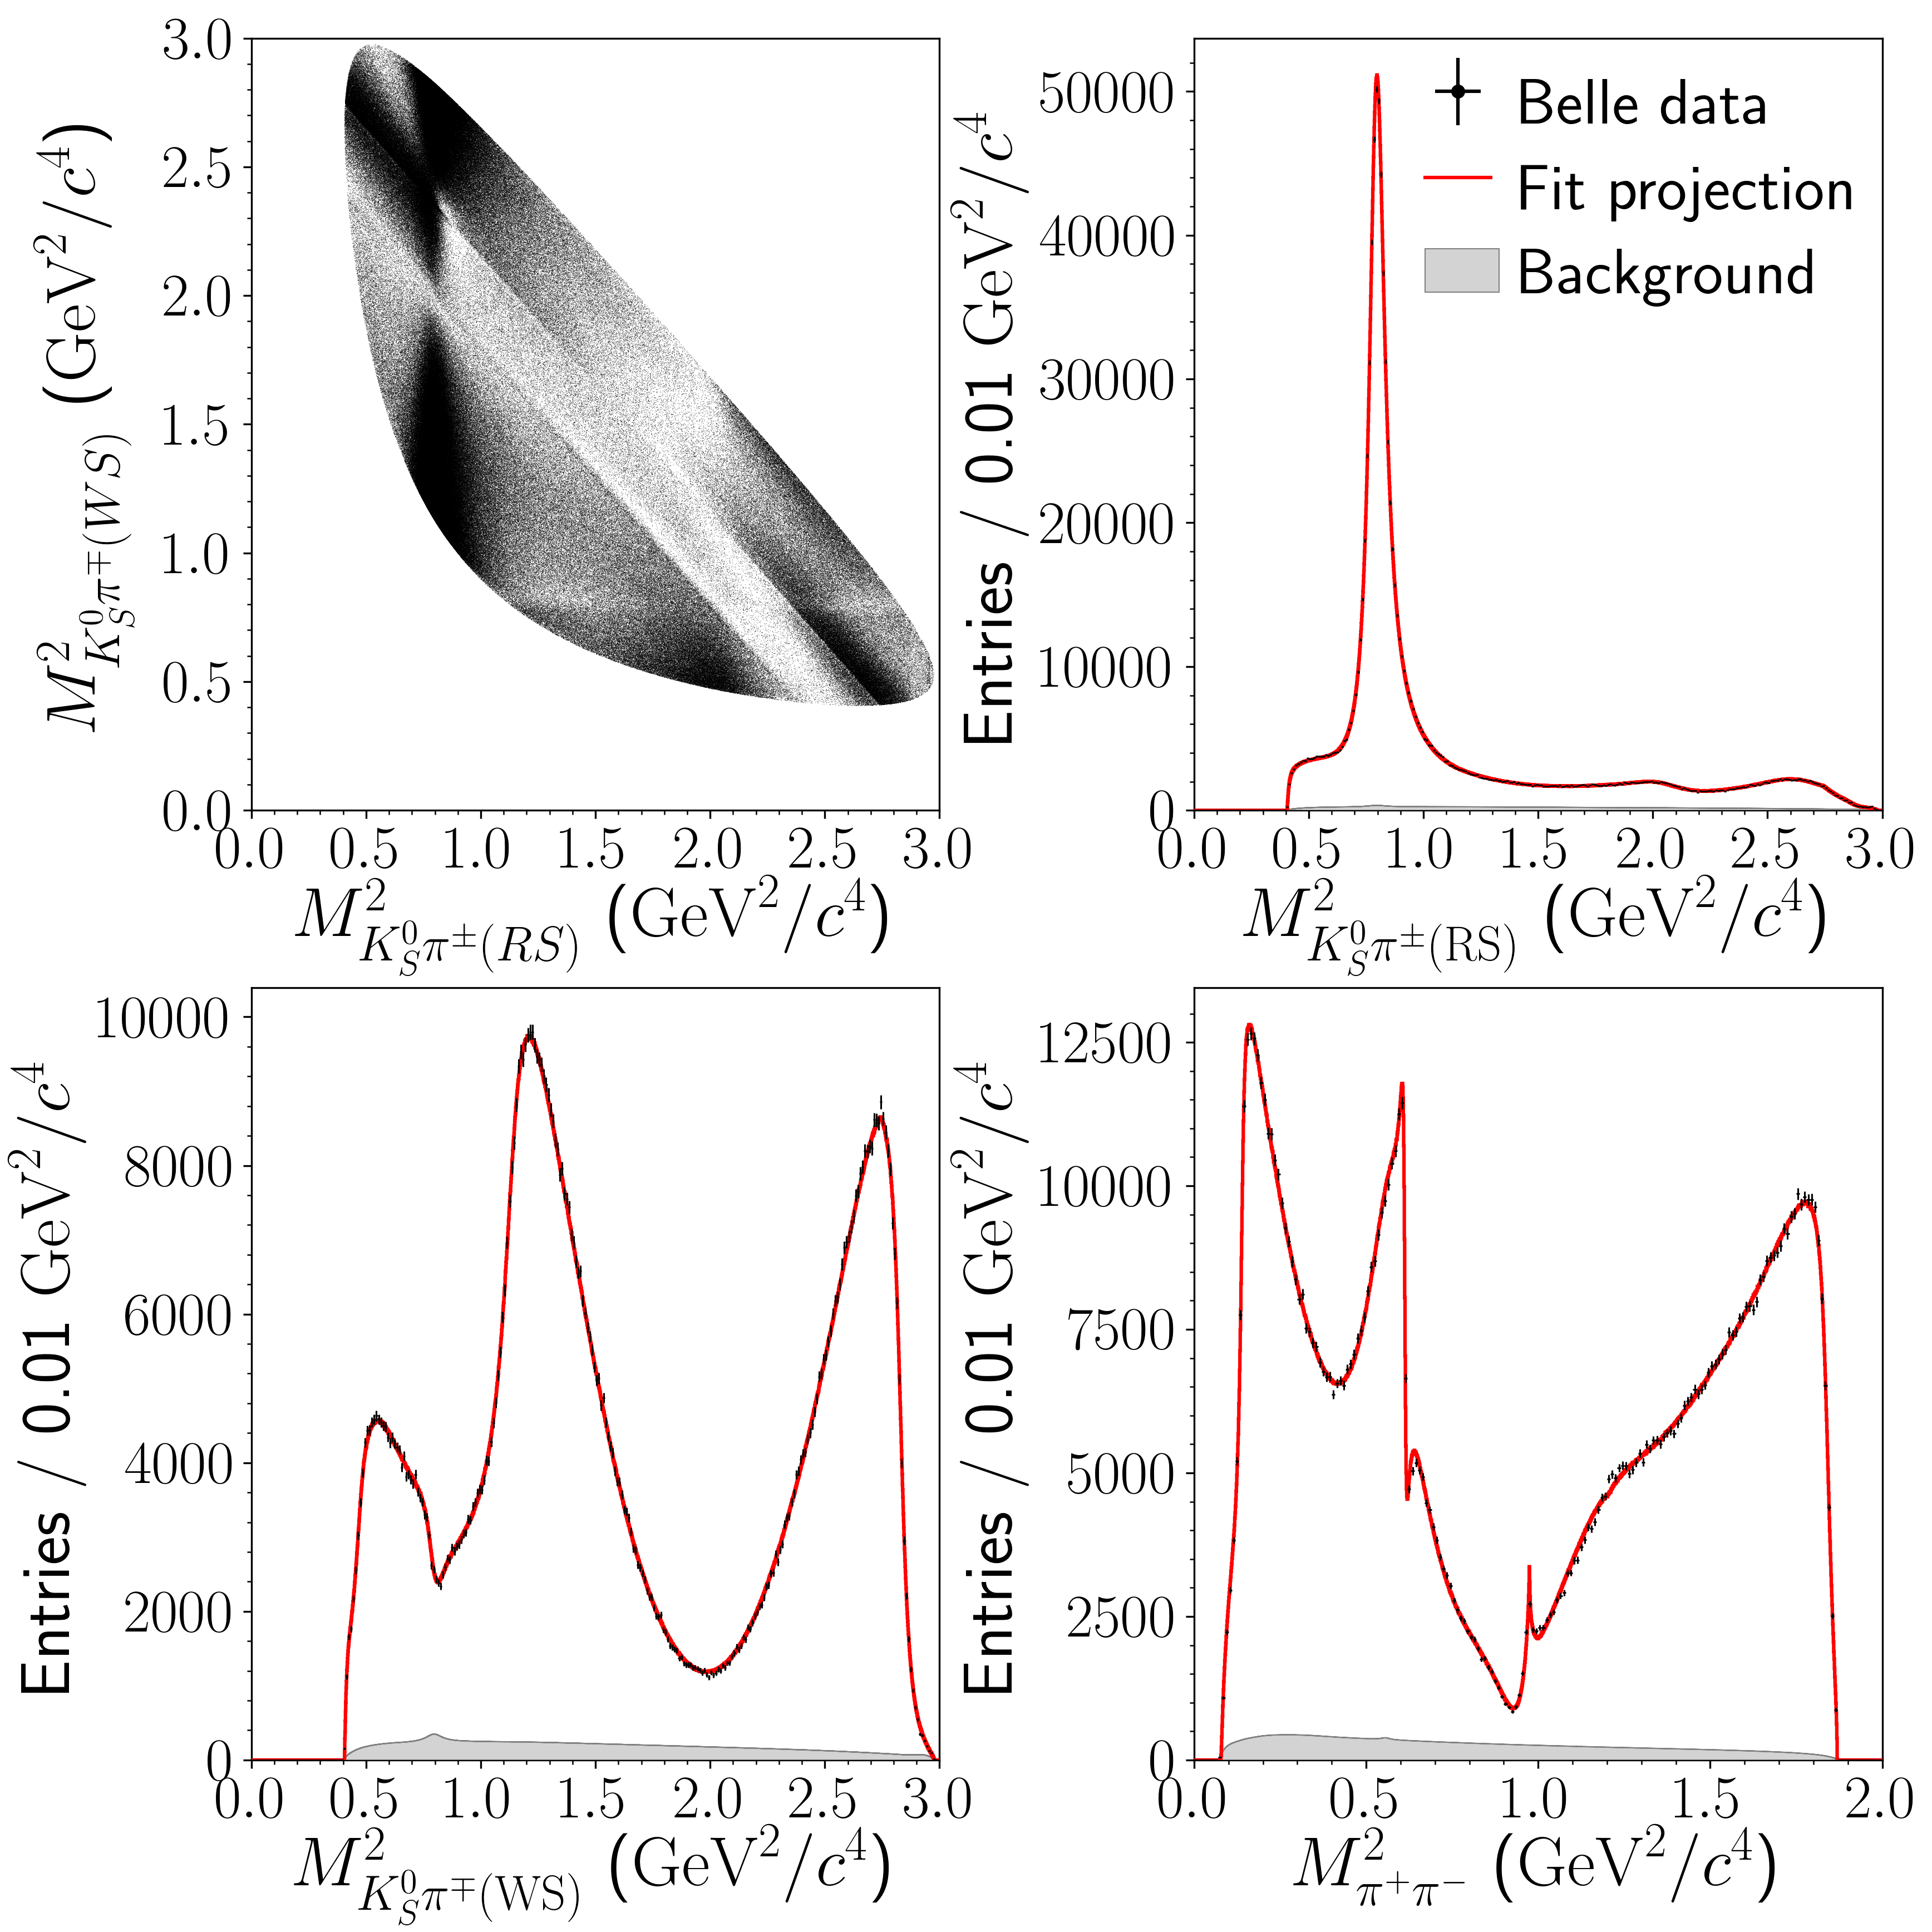
The intermediate resonances are parametrized in terms of manitude arsubscript𝑎𝑟a_{r}, phase ϕrsubscriptitalic-ϕ𝑟\phi_{r} and amplitude 𝒜r(m+2,m2)subscript𝒜𝑟subscriptsuperscript𝑚2subscriptsuperscript𝑚2{\cal A}_{r}(m^{2}_{+},m^{2}_{-}). The latter is factorized in terms of the Zemach tensor (ZL)subscript𝑍𝐿(Z_{L}) [9] describing the angular distribution of final state, Blatt-Weisskopf barrier penetration factors for the D𝐷D meson (FD)subscript𝐹𝐷(F_{D}) and the resonance (Fr)subscript𝐹𝑟(F_{r}) as well as a propagator (Tr)subscript𝑇𝑟(T_{r}) describing the decay dynamics of the resonances parameterized by Breit-Wigner functions. The isobar model includes Cabibbo-allowed two-body resonances (K(890)superscript𝐾superscript890K^{*}(890)^{-}, K0(1430)subscriptsuperscript𝐾0superscript1430K^{*}_{0}(1430)^{-}, K2(1430)subscriptsuperscript𝐾2superscript1430K^{*}_{2}(1430)^{-}, K(1680)superscript𝐾superscript1680K^{*}(1680)^{-} and K(1410)superscript𝐾superscript1410K^{*}(1410)^{-}), doubly-CKM-suppressed states (K(890)+,superscript𝐾superscript890K^{*}(890)^{+}, K0(1430)+subscriptsuperscript𝐾0superscript1430K^{*}_{0}(1430)^{+}, K2(1430)+subscriptsuperscript𝐾2superscript1430K^{*}_{2}(1430)^{+}, and K(1410)+superscript𝐾superscript1410K^{*}(1410)^{+}) as well as CP𝐶𝑃C\!P  eigenstates (ρ(770)𝜌770\rho(770), ω(782)𝜔782\omega(782), f2(1270)subscript𝑓21270f_{2}(1270) and ρ(1450))\rho(1450)). We perform a Dalitz plot fit for flavor-tagged events in the signal region with a correction for efficiency variations in Dalitz plot phase space. We take background from the D0superscript𝐷0D^{0} mass and D+D0superscript𝐷absentsuperscript𝐷0D^{*+}-D^{0} mass difference sidebands. The free parameters in the fit are arsubscript𝑎𝑟a_{r} and ϕrsubscriptitalic-ϕ𝑟\phi_{r} of each resonance relative to those of the ρ𝜌\rho (aρ=1subscript𝑎𝜌1a_{\rho}=1 and ϕr=0subscriptitalic-ϕ𝑟0\phi_{r}=0), the LASS and K𝐾K-matrix parameters plus masses and widths of the K(892)superscript𝐾892K^{*}(892) and K(1430)superscript𝐾1430K^{*}(1430). Figure 4 shows the Dalitz plot and its three projections for the Belle cc¯𝑐¯𝑐c\overline{c} sample with fit results overlaid. The K(892)superscript𝐾892K^{*}(892) is the dominant resonance. It is clearly visible in the Cabibbo-allowed Dalitz plot projection and appears as reflections at 1.2GeV21.2superscriptGeV21.2~{}\rm GeV^{2} and 2.5GeV22.5superscriptGeV22.5~{}\rm GeV^{2} in the doubly-CKM suppressed projection.
Refer to caption
Figure 4: The MKS0π±2subscriptsuperscript𝑀2subscriptsuperscript𝐾0𝑆superscript𝜋plus-or-minusM^{2}_{K^{0}_{S}\pi^{\pm}} versus MKS0π2subscriptsuperscript𝑀2subscriptsuperscript𝐾0𝑆superscript𝜋minus-or-plusM^{2}_{K^{0}_{S}\pi^{\mp}} Dalitz plot and the MKS0π±2subscriptsuperscript𝑀2subscriptsuperscript𝐾0𝑆superscript𝜋plus-or-minusM^{2}_{K^{0}_{S}\pi^{\pm}}, MKS0π2subscriptsuperscript𝑀2subscriptsuperscript𝐾0𝑆superscript𝜋minus-or-plusM^{2}_{K^{0}_{S}\pi^{\mp}} and Mπ+π2subscriptsuperscript𝑀2superscript𝜋superscript𝜋M^{2}_{\pi^{+}\pi^{-}} projections for Belle data with fits results overlaid. The residual 6%percent66\% cc¯𝑐¯𝑐c\overline{c} background is represented by the grey-shaded distribution.

2.2 Extraction of the B¯0D()0h0superscript¯𝐵0superscript𝐷0superscript0\overline{B}^{0}\rightarrow D^{(*)0}h^{0} signal yield

In total, we reconstruct five B¯0superscript¯𝐵0\overline{B}^{0} decay modes (D0π0,D0η,D0ω,D0π0(D^{0}\pi^{0},D^{0}\eta,D^{0}\omega,D^{*0}\pi^{0} and D0ηsuperscript𝐷absent0𝜂D^{*0}\eta) in which the D0superscript𝐷0D^{0}, D0superscript𝐷absent0D^{*0} and neutral hadron h0superscript0h^{0} are reconstructed in the decays D0KS0π+πsuperscript𝐷0subscriptsuperscript𝐾0𝑆superscript𝜋superscript𝜋D^{0}\rightarrow K^{0}_{S}\pi^{+}\pi^{-}, D0D0π0superscript𝐷absent0superscript𝐷0superscript𝜋0D^{*0}\rightarrow D^{0}\pi^{0}, and (η0γγ(\eta^{0}\rightarrow\gamma\gamma, ηγγ𝜂𝛾𝛾\eta\rightarrow\gamma\gamma or ηπ+ππ0𝜂superscript𝜋superscript𝜋superscript𝜋0\eta\rightarrow\pi^{+}\pi^{-}\pi^{0} and ωπ+ππ0𝜔superscript𝜋superscript𝜋superscript𝜋0\omega\rightarrow\pi^{+}\pi^{-}\pi^{0}). We introduce a transformed beam-constrained mass, Mbcsuperscriptsubscript𝑀bcM_{\rm bc}^{\prime}, to remove the correlation between the energy difference ΔE=EBEbeamΔ𝐸subscriptsuperscript𝐸𝐵subscriptsuperscript𝐸beam\Delta E=E^{*}_{B}-E^{*}_{\rm beam}111where Ebsuperscriptsubscript𝐸𝑏E_{b}^{*} is the B-meson energy and Ebeamsuperscriptsubscript𝐸beamE_{\rm beam}^{*} is the beam energy where an asterisk denotes that these observables are measured in the e+esuperscript𝑒superscript𝑒e^{+}e^{-} center-of-mass frame and Mbcsubscript𝑀bcM_{\rm bc}

Mbc=Ebeam2(pD()0+ph0|ph0|(EbeamED()0)2M2h0).M_{\rm bc}^{\prime}=\sqrt{E^{*2}_{\rm beam}-\big{(}\vec{p}^{*}_{D^{(*)0}}+\frac{\vec{p}^{*}_{h^{0}}}{|\vec{p}^{*}_{h^{0}}|}\sqrt{(E^{*}_{\rm beam}-E^{*}_{D^{(*)0})2-M^{2}_{h^{0}}}\big{)}}}. (3)

To separate signal from e+eqq¯superscript𝑒superscript𝑒𝑞¯𝑞e^{+}e^{-}\rightarrow q\overline{q} continuum background (with q=u,d,s,c𝑞𝑢𝑑𝑠𝑐q=u,~{}d,~{}s,~{}c quarks), we define a transferred neural network output variable

NNout=logNNoutNNoutminNNoutmaxNNout𝑁subscriptsuperscript𝑁out𝑁subscript𝑁out𝑁subscriptsuperscript𝑁𝑚𝑖𝑛out𝑁subscriptsuperscript𝑁𝑚𝑎𝑥out𝑁subscript𝑁outNN^{\prime}_{\rm out}=\log\frac{NN_{\rm out}-NN^{min}_{\rm out}}{NN^{max}_{\rm out}-NN_{\rm out}} (4)
Refer to caption
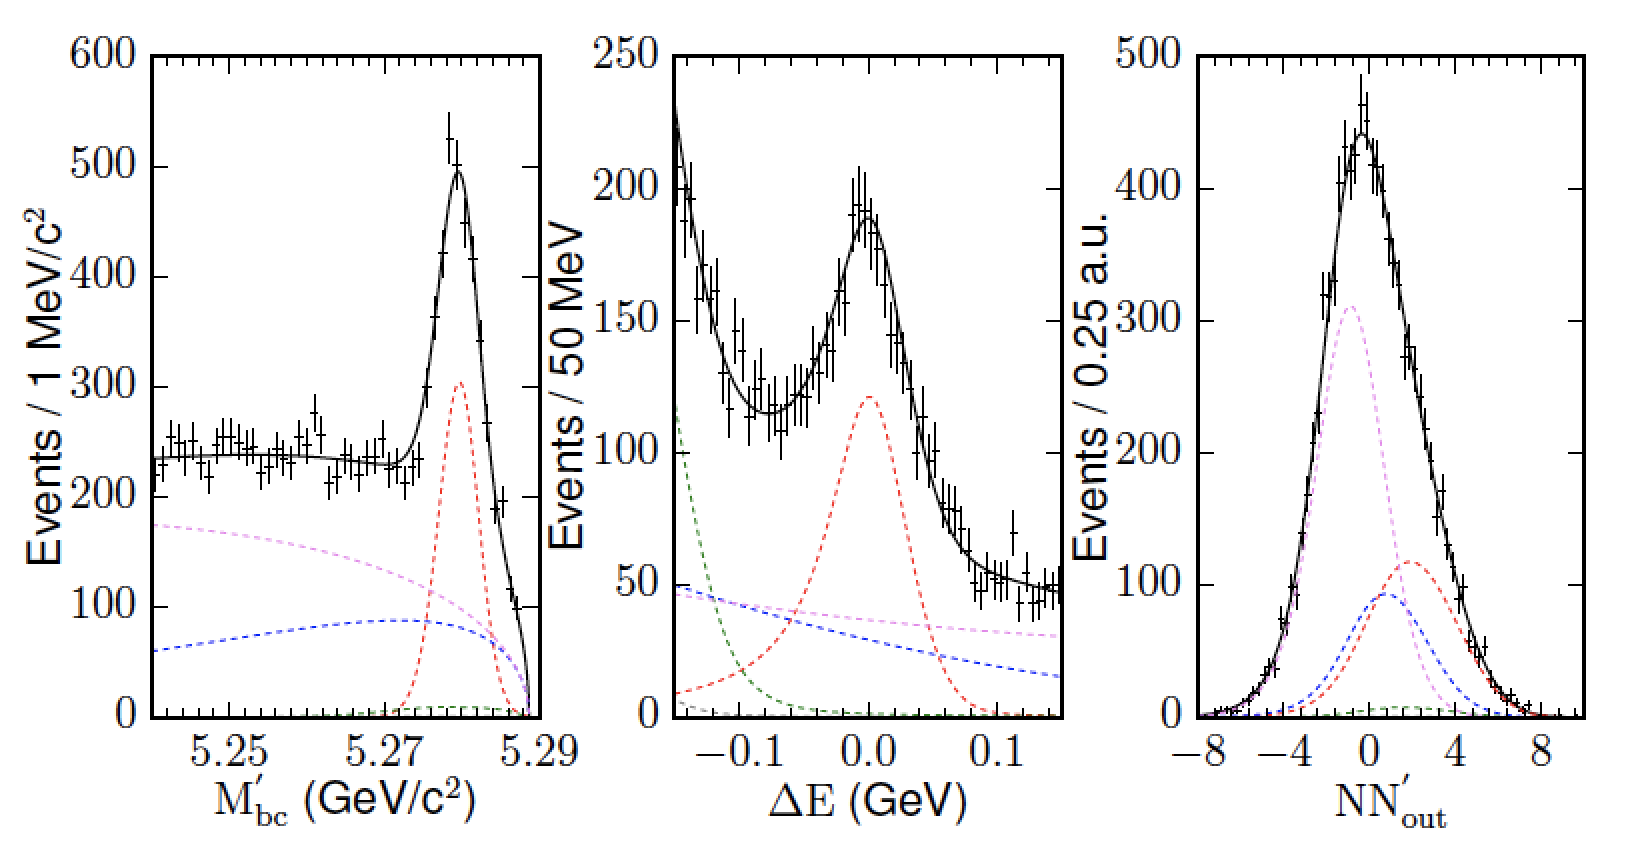
Figure 5: Distributions of Mbcsubscriptsuperscript𝑀bcM^{\prime}_{\rm bc} (left), ΔEΔ𝐸\Delta E (middle) and NNout𝑁subscriptsuperscript𝑁outNN^{\prime}_{\rm out} (right) showing data (points), total fit (black line), signal (red dashes), combinatorial background (blue dashes), continuum background (magenta dashes) and cross-feed (green dashes).

The neural network variable NNout𝑁subscript𝑁outNN_{\rm out} combines event shape information from 16 modified Fox-Wolfram moments. We perform a coherent analysis strategy, applying essentially the same selection criteria on B AB AR and Belle data. We extract signal yields from three-dimensional fits to Mbcsubscriptsuperscript𝑀bcM^{\prime}_{\rm bc}, ΔEΔ𝐸\Delta E and NNout𝑁subscriptsuperscript𝑁outNN^{\prime}_{\rm\rm out}. For each mode in each experiment we perform separate fits using the experiment-specific resolutions. Figure 5 shows the distributions for Mbcsubscriptsuperscript𝑀bcM^{\prime}_{\rm bc}, ΔEΔ𝐸\Delta E and NNout𝑁subscriptsuperscript𝑁outNN^{\prime}_{\rm out} with fit projections overlaid after combining all five modes for both experiments. The three-dimensional fits describe the data rather well. We obtain 1129±48plus-or-minus1129481129\pm 48 B AB AR  and 1567±56plus-or-minus1567561567\pm 56 Belle signal events. Table 1 lists the yields for the individual modes in the two experiments.

Decay mode B AB AR Belle
B¯0D0π0superscript¯𝐵0superscript𝐷0superscript𝜋0\overline{B}^{0}\rightarrow D^{0}\pi^{0} 469±31plus-or-minus46931469\pm 31 768±37plus-or-minus76837768\pm 37
B¯0D0ηsuperscript¯𝐵0superscript𝐷0𝜂\overline{B}^{0}\rightarrow D^{0}\eta 220±22plus-or-minus22022220\pm 22 238±23plus-or-minus23823238\pm 23
B¯0D0ωsuperscript¯𝐵0superscript𝐷0𝜔\overline{B}^{0}\rightarrow D^{0}\omega 219±21plus-or-minus21921219\pm 21 285±26plus-or-minus28526285\pm 26
B¯0Dπ0superscript¯𝐵0superscript𝐷superscript𝜋0\overline{B}^{0}\rightarrow D^{*}\pi^{0} 147±18plus-or-minus14718147\pm 18 182±19plus-or-minus18219182\pm 19
B¯0Dηsuperscript¯𝐵0superscript𝐷𝜂\overline{B}^{0}\rightarrow D^{*}\eta 74±11plus-or-minus741174\pm 11 94±13plus-or-minus941394\pm 13
Table 1: Individual signal yields per decay mode and experiment.

3 Time-dependent CP𝐶𝑃C\!P analysis

We fit the proper time interval distributions maximizing the log-likelihood function

ln𝒫=iln𝒫iBABAR+jln𝒫jBelle.𝒫subscript𝑖superscriptsubscript𝒫𝑖𝐵𝐴𝐵𝐴𝑅subscript𝑗superscriptsubscript𝒫𝑗𝐵𝑒𝑙𝑙𝑒\ln{\cal P}=\sum_{i}\ln{\cal P}_{i}^{BABAR}+\sum_{j}\ln{\cal P}_{j}^{Belle}. (5)

The physics probability density functions (pdf) 𝒫iBABARsuperscriptsubscript𝒫𝑖𝐵𝐴𝐵𝐴𝑅{\cal P}_{i}^{BABAR} and 𝒫jBellesuperscriptsubscript𝒫𝑗𝐵𝑒𝑙𝑙𝑒{\cal P}_{j}^{Belle} are convolved with experiment-specific resolution functions

𝒫exp=kfk[𝒫k(Δt)Rk(ΔtΔt)]𝑑Δt.subscript𝒫expsubscript𝑘subscript𝑓𝑘delimited-[]subscript𝒫𝑘Δ𝑡subscript𝑅𝑘Δ𝑡Δsuperscript𝑡differential-dΔsuperscript𝑡{\cal P}_{\rm exp}=\sum_{k}f_{k}\int[{\cal P}_{k}(\Delta t)R_{k}(\Delta t-\Delta t^{\prime})]d\Delta t^{\prime}. (6)

We apply the B AB AR- and Belle-specific flavor-tagging algorithms and a common signal model for both experiments. The signal pdf is obtained from eqn 1.

𝒫sigsubscript𝒫sig\displaystyle{\cal P}_{\rm sig} proportional-to\displaystyle\propto [|𝒜D¯0|2+|𝒜D0|2][|𝒜D¯0|2|𝒜D0|2]cos(ΔmΔt)minus-or-plusdelimited-[]superscriptsubscript𝒜superscript¯𝐷02superscriptsubscript𝒜superscript𝐷02delimited-[]superscriptsubscript𝒜superscript¯𝐷02superscriptsubscript𝒜superscript𝐷02Δ𝑚Δ𝑡\displaystyle[|{\cal A}_{\overline{D}^{0}}|^{2}+|{\cal A}_{D^{0}}|^{2}]\mp[|{\cal A}_{\overline{D}^{0}}|^{2}-|{\cal A}_{D^{0}}|^{2}]\cos(\Delta m\Delta t)
±plus-or-minus\displaystyle\pm 2ηh0(1)L[Im(𝒜D0𝒜D0)cos2βRe(𝒜D0𝒜D0)sin2β]sin(ΔmΔt)2subscript𝜂superscript0superscript1𝐿delimited-[]𝐼𝑚subscript𝒜superscript𝐷0subscriptsuperscript𝒜superscript𝐷02𝛽𝑅𝑒subscript𝒜superscript𝐷0subscriptsuperscript𝒜superscript𝐷02𝛽Δ𝑚Δ𝑡\displaystyle 2\eta_{h^{0}}(-1)^{L}[Im({\cal A}_{D^{0}}{\cal A}^{*}_{D^{0}})\cos 2\beta-Re({\cal A}_{D^{0}}{\cal A}^{*}_{D^{0}})\sin 2\beta]\sin(\Delta m\Delta t)

The B0superscript𝐵0B^{0} and B+superscript𝐵B^{+} lifetimes and the B0B¯0superscript𝐵0superscript¯𝐵0B^{0}\overline{B}^{0} mixing parameter ΔmdΔsubscript𝑚𝑑\Delta m_{d} are fixed to the world averages [12], while the Dalitz plot amplitude model parameters are fixed to the fit results of the D0KS0π+πsuperscript𝐷0subscriptsuperscript𝐾0𝑆superscript𝜋𝜋D^{0}\rightarrow K^{0}_{S}\pi^{+}\pi Dalitz plot analysis. The only free parameters in the fit are sin2β2𝛽\sin 2\beta and cos2β2𝛽\cos 2\beta.

4 Results

Using 1.1ab11.1superscriptab11.1~{}\rm ab^{-1} of B AB AR and Belle data we measure:

sin2β2𝛽\displaystyle\sin 2\beta =0.80±0.14stat±0.06sys±+0.03model\displaystyle=0.80\pm 0.14_{\rm stat}\pm 0.06_{\rm sys}\pm+0.03_{\rm model} (8)
cos2β2𝛽\displaystyle\cos 2\beta =0.91±0.22stat±0.09sys±+0.07model\displaystyle=0.91\pm 0.22_{\rm stat}\pm 0.09_{\rm sys}\pm+0.07_{\rm model} (9)
β𝛽\displaystyle\beta =(22.5±4.4stat±1.2sys±0.6model)absentsuperscriptplus-or-minus22.5subscript4.4statsubscript1.2syssubscript0.6model\displaystyle=(22.5\pm 4.4_{\rm stat}\pm 1.2_{\rm sys}\pm 0.6_{\rm model})^{\circ} (10)

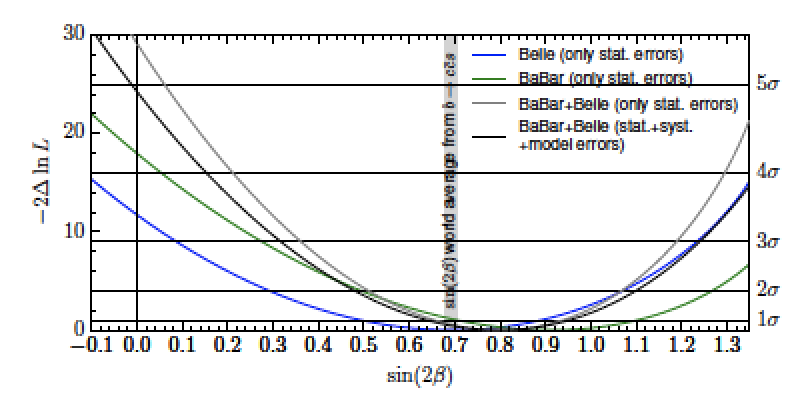
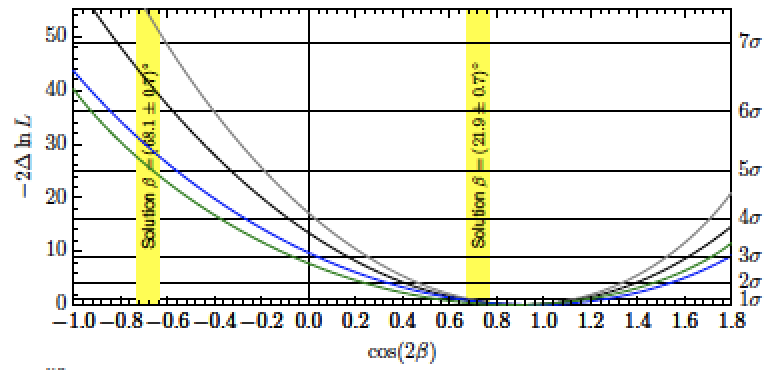
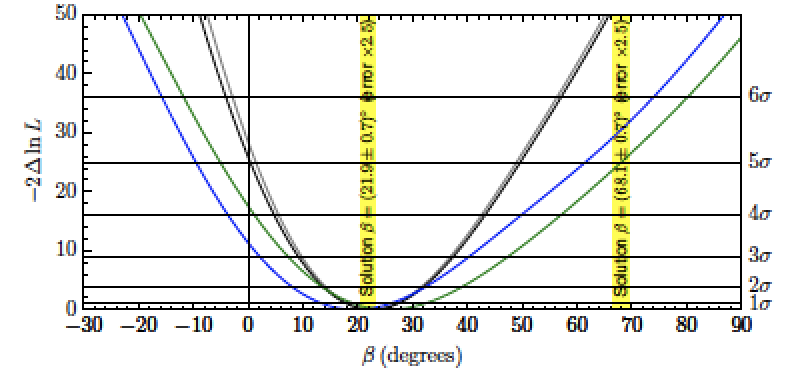
We observe CP𝐶𝑃C\!P violation in the decay B¯D()h0¯𝐵superscript𝐷superscript0\overline{B}\rightarrow D^{(*)}h^{0} in the time-dependent decay distributions as expected in the Standard Model. The value of sin2β2𝛽\sin 2\beta is in good agreement with the world average of 0.69±0.02plus-or-minus0.690.020.69\pm 0.02 [11]. Our results yield the first evidence for cos2β>02𝛽0\cos 2\beta>0 at 3.7 standard deviations. The second solution of β=(68.1±0.7)𝛽superscriptplus-or-minus68.10.7\beta=(68.1\pm 0.7)^{\circ} is excluded at 7.3 standard deviations thus removing the ambiguity in extracting β𝛽\beta from sin2β2𝛽\sin 2\beta. In addition, β=0𝛽0\beta=0 is excluded at 5.1 standard deviations. Figure 6 shows the 2ΔlnL2Δ𝐿2\Delta\ln L distributions as functions of sin2β2𝛽\sin 2\beta, cos2β2𝛽\cos 2\beta and β𝛽\beta.

Refer to caption
Refer to caption
Refer to caption
Figure 6: The 2ΔlnL2Δ𝐿2\Delta\ln L distributions as functions of sin2β2𝛽\sin 2\beta (top left), cos2β2𝛽\cos 2\beta (top right) and β𝛽\beta (bottom) for B AB AR data (green line), Belle data (blue line) and both experiments combined (grey line) using statistical errors only. The result for both experiments including systematic uncertainties are shown by the black solid curves.

5 Systematic uncertainties

Table  2 shows the experimental systematic uncertainties on the CP𝐶𝑃C\!P violation parameters. The largest systematic errors on cos2β2𝛽\cos 2\beta result from the uncertainties in the ΔtΔ𝑡\Delta t resolution functions (0.058), followed by those in the vertex reconstruction, possible fit bias and signal purity. Systematic uncertainties from the background ΔtΔ𝑡\Delta t pdfs are smaller while those from flavor tagging, physics parameters and Dalitz plot reconstruction efficiency corrections are negligible.

Source sin2β[×102]\sin 2\beta[\times 10^{2}] cos2β[×102]\cos 2\beta[\times 10^{2}] β[]\beta[^{\circ}]
ΔtΔ𝑡\Delta t resolution functions 2.84 5.75 0.41
Vertex reconstruction 3.16 4.79 0.53
Possible fit bias 3.67 3.90 0.79
Signal purity 2.13 3.39 0.53
Background ΔtΔ𝑡\Delta t pdfs 1.24 1.76 0.16
Flavor tagging 0.34 0.39 0.07
Dalitz plot reconstruction efficiency correction 0.01 0.17 0.02
Physics parameters 0.07 0.14 0.02
Total 6.14 9.27 1.18
Table 2: Summary of experimental systematic uncertainties on the CP𝐶𝑃C\!P violation parameters.

6 Conclusions

We have performed a time-dependent CP𝐶𝑃C\!P analysis of the decay mode B¯0D()0h0superscript¯𝐵0superscript𝐷0superscript0\overline{B}^{0}\rightarrow D^{(*)0}h^{0} where the D0superscript𝐷0D^{0} is reconstructed in the KS0π+πsubscriptsuperscript𝐾0𝑆superscript𝜋superscript𝜋K^{0}_{S}\pi^{+}\pi^{-} final state using 1.1ab11.1superscriptab11.1~{}\rm ab^{-1} of B AB AR and Belle data. We measure cos2β=0.91±0.22stat±0.09sys±0.07model2𝛽plus-or-minus0.91subscript0.22statsubscript0.09syssubscript0.07model\cos 2\beta=0.91\pm 0.22_{\rm stat}\pm 0.09_{\rm sys}\pm 0.07_{\rm model} from which we exclude the solution β=(68.1±0.7)𝛽superscriptplus-or-minus68.10.7\beta=(68.1\pm 0.7)^{\circ} at 7.3 standard deviations. Our measurement lifts the ambiguity in the determination of the angle β𝛽\beta in the Unitarity Triangle. Our result for β𝛽\beta agrees well with the world average which is shown in Fig. 7 in comparison to a previous measurement of β𝛽\beta in the decay mode B¯0DCPh0superscript¯𝐵0subscript𝐷𝐶𝑃superscript0\overline{B}^{0}\rightarrow D_{CP}h^{0} using combined B AB AR and Belle data.

Refer to caption
Figure 7: Compilation of sin2βeff2superscript𝛽𝑒𝑓𝑓\sin 2\beta^{eff} measurement in time dependent bcu¯d𝑏𝑐¯𝑢𝑑b\rightarrow c\overline{u}d analyses before the resent mmeasurement [6, 13, 14].

7 Acknowledgment

I would like to thank the B AB AR collaboration for the opportunity to present these results. In particular I would like to thank M. Röhrken, J. McKenna and F.C. Porter for useful discussion.

References

  • [1] N. Cabibbo, Phys. Rev. Lett. 10, 531 (1963); M. Kobayashi and T. Maskawa, Prog. Theor. Phys. 49, 652 (1973).
  • [2] The B AB AR  Collaboration (B. Aubert etal.𝑒𝑡𝑎𝑙et~{}al.), Phys.Rev.D79, 072009 (2009); the Belle Collaboration ( I.Adachi etal.𝑒𝑡𝑎𝑙et~{}al.), Phys. Rev. Lett. 108, 171802 (2012).
  • [3] CKMfitter Group (J.Charles etal.𝑒𝑡𝑎𝑙et~{}al.), http://ckmfitter.in2p3.fr/
  • [4] A. Bondar, T. Gershon, and P. Krokovny, Phys. Lett. B624, 1 (2005).
  • [5] The Belle Collaboration (V. Vorobyev etal.𝑒𝑡𝑎𝑙et~{}al.), Phys. Rev. D 94, 052004 (2016).
  • [6] The B AB AR and Belle Collaborations (A. Abdesselam, I. Adachi, A. Adametz etal.𝑒𝑡𝑎𝑙et~{}al.), Phys. Rev. Lett.115, 121604 (2015).
  • [7] S.U. Chung etal.𝑒𝑡𝑎𝑙et~{}al., Annalen der Physik, 507, 404 (1995); I. Aitchison, Nucl. Phys. A 189, 417 (1972).
  • [8] The LASS Collaboration (D. Aston etal.𝑒𝑡𝑎𝑙et~{}al.), Nucl. Phys. B 296, 493 (1988).
  • [9] C. Zemach, Phys. Rev., 140 B, 97 (1965).
  • [10] The B AB AR  Collaboration (B. Aubert etal.𝑒𝑡𝑎𝑙et~{}al.), Phys.Rev.D78, 034023 (2008).
  • [11] Heavy Flavor Averaging Group, http://www.slac.stanford.edu/xorg/hfag/.
  • [12] K.A. Olive et al. (Particle Data Group), Chin. Phys. C 38, 090001 (2014).
  • [13] The B AB AR  Collaboration (B. Aubert etal.𝑒𝑡𝑎𝑙et~{}al.), Phys. Rev. Lett. 99, 231802 (2007).
  • [14] The Belle Collaboration (P. Krokovny etal.𝑒𝑡𝑎𝑙et~{}al.), Phys. Rev. Lett. 97, 081801 (2006).