The barred inner Milky Way: dynamical models from surveys
Abstract
The Milky Way is a barred galaxy whose central bulge has a box/peanut shape and consists of multiple stellar populations with different orbit distributions. This review describes dynamical and chemo-dynamical equilibrium models for the Bulge, Bar, and inner Disk based on recent survey data. Some of the highlighted results include (i) stellar mass determinations for the different Galactic components, (ii) the need for a core in the dark matter distribution, (iii) a revised pattern speed putting corotation at , (iv) the strongly barred distribution of the metal-rich stars, and (v) the radially varying dynamics of the metal-poor stars which is that of a thick disk-bar outside , but changes into an inner centrally concentrated component with several possible origins. On-going and future surveys will refine this picture, making the Milky Way a unique case for studying how similar galaxies form and evolve.
keywords:
Galaxy: structure; kinematics and dynamics; stellar content, dark matter; galaxies: evolution; formation1 Overview: our barred Milky Way
Introduction. The stars in the Galactic bulge are mostly very old (), -enriched, and have a broad metallicity distribution (MDF), pointing to an early rapid formation. Yet starcounts have unambiguously established that the bulk of the bulge stars are part of a box/peanut (B/P) bulge, and must therefore have formed in the early Milky Way (MW) disk. The B/P bulge represents the inner 3D parts of the Galactic bar, transiting into the planar long bar at about from the centre. This confirms and corroborates long-standing evidence for a barred potential from NIR photometry, early star counts, and non-circular gas motions in the bulge region (see Rich, 2013; Bland-Hawthorn & Gerhard, 2016, hereafter BHG16).
Recently photometric and spectroscopic surveys have provided us with positions, velocities, and metallicities for unprecedented samples of bulge stars. These data have made it possible to construct detailed dynamical models for the Bulge/Bar and its stellar populations, providing new understanding of our MW, as will be discussed in this review. In the near future we expect great progress from the multiple surveys currently on-going or planned, such as Gaia, VVV/X, DES, APOGEE, 4MOST or MOONS.
Stellar masses and scale parameters The Galaxy is a luminous () barred spiral with a stellar mass of , an estimated circular velocity at the Sun , and a relatively short and uncertain disk scale-length, (BHG16). From the dynamical models discussed below, the corotation radius is (for ). The photometric stellar mass of the Bulge and Bar is , with the inner Disk adding () , both with uncertainty . The stellar mass fraction of the Bulge, Bar, and inner Disk together is thus , i.e., the major fraction of the MW’s stars are in the inner Galaxy.
Galactic bulge density from starcounts. The best structural information for the Bulge comes from large samples of red clump giant (RCG) stars, for which individual distances can be determined to . RCGs are representative for most of the bulge stars, tracing old stellar populations within except for low metallicities (Salaris & Girardi, 2002). In the ARGOS survey they are prominent in the range of metallicities [Fe/H] which contains of their sample (Ness et al., 2013a). RCGs have been used early-on as tracers of the bar asymmetry and have been important in the discovery of the bulge X-shape (McWilliam & Zoccali, 2010; Nataf et al., 2010). Using million RCGs from the VVV survey, Wegg & Gerhard (2013) measured the 3D bulge density distribution in a box-shaped volume of (hereafter, the VVV box). They found a strongly barred () and peanut-shaped density with bar angle . Along the bar axes, the central () density distributions were found to be nearly exponential; in particular the minor axis profile is exponential in the range , with short scale-length , and shows no indication of a central component as would be expected if the MW also hosted a substantial classical bulge.
Recently, large samples of Bulge RR Lyrae (RRL) stars have been identified in the OGLE and VVV surveys. RRL trace the very old, metal-poor population in the Bulge which is found not to follow the barred RCG bulge (Gran et al., 2016). From the number of RRL to RCG, of the stars in the Bulge are in this old, more spheroidal distribution, which also rotates less rapidly than the more metal-rich stars (Kunder et al., 2016).
The Milky Way long bar from starcounts. In N-body disk galaxy models, B/P bulges are the inner 3D parts of a longer, planar bar and form through buckling out of the galaxy plane and/or capture of stars by vertical resonances (e.g., Athanassoula, 2016). B/P bulges in external galaxies are also embedded in longer, thinner bars (Erwin & Debattista, 2013), and observational evidence for buckling has recenly been found by Erwin & Debattista (2016). The long bar in the Milky Way has been difficult to characterize because of intervening dust extinction and the superposition with the star-forming disk at low latitudes; see the summary in BHG16. Using a density model for RCGs from the combined 2MASS, UKIDDS and VVV surveys, Wegg et al. (2015) showed that the MW’s B/P bulge continuously transits outwards into a planar bar with half-length of and bar angle (for ), consistent with the B/P bulge. Near the bar end the RCG overdensity is dominated by a superthin component seen out to ; whereas the main, -scale-height bar component reaches out to . This region needs further study (e.g., Martinez-Valpuesta & Gerhard, 2011).
Bulge kinematics. Data from the BRAVA survey for M-giant stars showed that the B/P bulge rotates nearly cylindrically (Kunder et al., 2012), similar to B/P bulges in external galaxies (Molaeinezhad et al., 2016). The near-cylindrical rotation is seen for all metallicities up to in the ARGOS survey (Ness et al., 2013b), and was comfirmed also at low latitudes by APOGEE (Ness et al., 2016), and by GIBS (Zoccali et al., 2017). The overall velocity dispersion () profile decreases steeply with . Shen et al. (2010) showed that the cylindrical rotation of the Bulge could be fitted well by an N-body B/P bulge model, but could not be fitted well if the MW contained a slowly rotating classical bulge with more than 25% of the bulge mass.
2 Dynamical models for the Galactic bar
Need for dynamical equilibrium models. For interpreting star counts in the Bulge and Bar a density model is sufficient; however, interpreting the combined stellar positions and velocities requires a dynamical model. A dynamical model describes the distribution of stars over orbits in the gravitational potential. Even though the Galactic bar will be evolving slowly (e.g., by angular momentum transfer), we need to start with dynamical equilibrium models in order to determine from the data the current orbit distribution, and the current mass distribution and potential. Later we can perturb these models in order to study the evolution. In the bar region we have to model a rapidly rotating triaxial system, but much of the essence of these complex models is already contained in the simple spherical Jeans equation. This equation relates the density, velocity dispersion, and orbit anisotropy of a tracer population with the total dynamical mass and potential. In the rotating triaxial bar problem for the MW, we have a more complicated geometry and model kinematic data for individual stars, but by constructing a dynamical equilibrium model we again obtain relations between densities, velocity moments, orbits, and potential, and find the best models by matching to the data.
N-body model results. N-body models have been very useful for obtaining insight into the dynamics of B/P bulges and for illustrating possible origins of the MW bulge. E.g., Abbott et al. (2017) showed that the B/P bulge is maintained by a wide range of orbits, both resonant and non-resonant. Gardner et al. (2014) explained the different kinematics of stars on the near and far parts of the X in the Bulge. Martinez-Valpuesta & Gerhard (2013) showed that the Jacobi energies of stars are largely conserved and, consequently, population gradients in the prior disk maintained during the bar and buckling instabilities. Di Matteo et al. (2014); Fragkoudi et al. (2017) and Debattista et al. (2017) showed how stars on different orbits in the prior disk are mapped into the final B/P bulge. However, N-body models are not controllable and cannot quantitatively match the multiple data points provided by large surveys (already many 1000s but many more in future).
Made-to-measure (M2M) particle models. M2M models are well-suited for incorporating large numbers of data constraints. Their underlying principle is simple. A suitable N-body model is constructed which captures the essence of the galaxy to be modelled. The model is ’observed’ just like the real galaxy is observed, including survey selection functions (SSF). The model data are compared to the real data and the difference is quantified in terms of a profit function. Then the weights (masses) of the particles are modified such as to maximize the profit function with respect to the weights. The modified N-Body model is then forward-integrated in time, and the cycle is repeated until the model converges. For the models described below, the NMAGIC implementation of De Lorenzi et al. (2007, 2008) for observational constraints with errors is used with various upgrades, such as for rotating potentials, on-the-fly adaptation of the potential of the stars, and of the dark matter halo density, potential, and particle distribution (Portail et al., 2017a, herafter P17a). The modelling starts with controlled initial B/P bulge-bar-disk models adapted to specific shape and pattern speed, and uses as data constraints the 3D bulge density, the RCG magnitude distributions in the long bar, kinematics from the BRAVA, ARGOS, and OGLE surveys, as well as information on the Galactic rotation curve.
3 Bulge-Bar Dynamics: pattern speed, stellar, and dark matter mass distribution
Pattern speed. P17a constructed M2M models for different values of the bar pattern speed , the mass per RCG star, and the mass of the central nuclear stellar disk (NSD). The NSD influences in particular the central -profile and the vertical proper motions, which are constrained from the BRAVA and OGLE surveys, and from these data, its mass must be .
Good fits to the kinematic observables are obtained for a range of . Joint for the BRAVA and ARGOS data and a systematic error estimate gives . The pattern speed influences both the mean rotation and dispersion in the Bulge, while the mass in the bulge region influences only . Hence and the mass can both be determined by the bulge kinematics. In the future, kinematics in the long bar region is expected to yield an independent constraint on . The value found from the bulge stellar kinematics is in good agreement with recent analysis of MW gas dynamics (Sormani et al., 2015). With a bar half-length , the derived pattern speed corresponds to a corotation radius and , which is conventionally described as a fast bar.
The Hercules stream - stars on Lagrange orbits visit the Sun. The Hercules stream is a substantial kinematic subgroup in the solar neighbourhood (SNd) -distribution with negative (moving outward) and negative (slower than mean rotation) relative to the Sun. In its conventional interpretation, is is identified with outer Lindblad resonance (OLR) orbits of the bar (Dehnen, 2000; Antoja et al., 2014), whose corotation radius is then ( for given above). This would place corotation clearly within the bar. The OLR explanation is incompatible with the best models obtained by P17a from bulge-bar data which have OLR at radius.
Although not made for the SNd, these models however suggest an alternative explanation, without any additional fitting. Pérez-Villegas et al. (2017) found a kinematic subgroup much like Hercules in the favoured P17a model due to stars orbiting the Lagrange points of the bar and visiting the SNd. These orbits extend from inside corotation to just outside the solar radius, predicting naturally that the Hercules stream is more prominent inwards from the Sun and nearly absent further out, and that these stars might be older and more metal-rich than other stars near the Sun. This hypothesis can soon be tested with Gaia-DR2 data which will show us the combined effect of the bar and spiral arms on the kinematics in the SNd (the latter were not included by P17a).
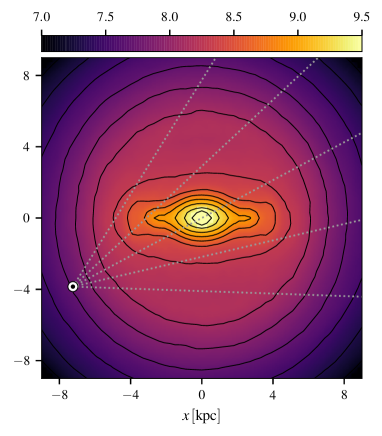
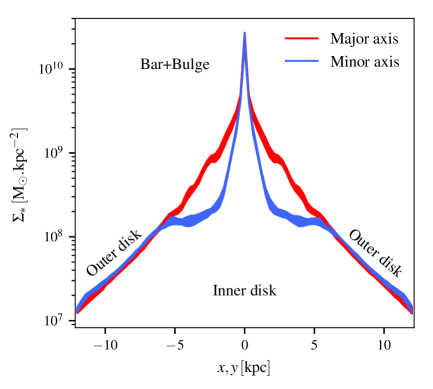
Stellar mass distribution. Figure 2 shows the face-on stellar mass distribution of the inner MW obtained from the P17a dynamical model. The bulge and long bar density are essentially determined by the starcounts. The inner disk around the Bar connects in a dynamically self-consistent way the stellar surface density rising inwards from the Sun with the steeply falling density on the minor axis of the Bulge; direct constraints by the data on the inner disk density are still weak. Figure 2 shows the surface density profiles along the bar major and minor axes obtained by the model. While along the bar major axis the inward exponential rise continues along the Bar into the Bulge, the disk surface density along the minor axis is essentially flat between the corotation radius and the Bulge. Such density structures are known from external galaxies, e.g., the bar-lens galaxy NGC 4314 (Laurikainen et al., 2014).
Stellar masses measured by the model for the photometric Bulge and Bar, the Bulge alone, and for the inner Disk () are , , and , respectively, with typical uncertainties . These values depend on the mass-to-RCG ratio, taken as /RCG star in P17a. This number was obtained from relating the stellar mass in an HST fields to the surface density of RCG counts nearby, analogous to the method of Valenti et al. (2016) but taking into account the variation of the red giant background with latitude. Wegg et al. (2017) show that the microlensing time-scale distribution fitted with a stellar mass function derived from a three-power law IMF is very similar to a Kroupa IMF, and results in /RCG. Indeed, the P17a model gives an excellent a posteriori fit also to the microlensing optical depth which is a measure of the integrated stellar surface density between the Sun and the source stars in the Bulge.
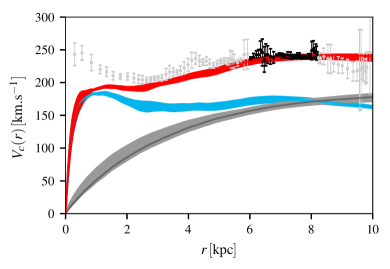
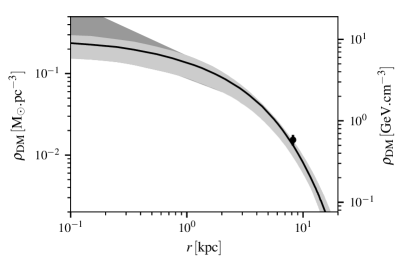
The core in the MW’s dark matter profile. The total dynamical mass in the VVV box (see above) is very well determined in these models, including systematic uncertainties from variations in data and model assumptions. Portail et al. (2015) had previously found , entirely compatible. Because also the stellar mass in the bulge region is well-determined, the dark matter mass in the VVV box cannot exceed . Figure 4 shows the MW rotation curve (RC), based on terminal velocities and . This fixes the dark matter mass at and its profile in the range. In order to match the low dark matter fraction in the bulge, the dark matter profiles must then flatten to a core or shallow cusp at ; see Figure 4.
4 Chemo-Dynamics: The multi-component bulge
Metallicity-dependent kinematics and MDF in the bulge. The near-cylindrical rotation of bulge stars is seen for all metallicities up to in the ARGOS survey, and was comfirmed by APOGEE and GIBS also at low . The ARGOS, GIBS, and GES (Rojas-Arriagada et al., 2017) surveys show distinct velocity dispersion properties between the metal-rich and metal-poor bulge stars. The metal-rich component has a steep gradient with while the metal-poor component has flatter dispersion profiles with both and . Both components have roughly equal at , and the metal-rich component has higher (lower) dispersion at lower (higher) latitudes.
While the GIBS and GES surveys find two components in their MDF, with different kinematics, ARGOS finds three main bulge and additional metal-poor components in the MDF which all differ in their kinematics. These differences are likely to be due at least in parts to the different SSF: while the ARGOS SSF gives high weight to the outer bulge (Freeman et al., 2013), the GIBS SSF includes mostly stars within around the peak density (Zoccali et al., 2014), and the GES SSF around (Rojas-Arriagada et al., 2017). However, survey cross-validation by observing/analysing the same stars would be important in order to check for non-SSF related differences in the MDF.
Chemo-dynamical equilibrium (CDE) models with M2M. Portail et al. (2017b, hereafter P17b) extended the M2M method to an augmented phase-space including metallicity, such that all particles carry information about , , and the MDF. The particle MDFs are parametrized by a multi-Gaussian expansion with individual Gaussians adjusted to the ARGOS metallicity bins. Particles are projected into observational space using isochrones and metallicity-dependent selection functions taking account of the survey SSF. Their metallicity weights are adjusted by comparing to the number, mean velocity, and LOS velocity dispersion of stars from the ARGOS and APOGEE surveys in bins of distance and metallicity, while following their orbits in the overall barred gravitational potential from P17a. When fitted to the data, the final CDE model returns an interpolation for the distribution of stars over orbits and metallicity, or over , , and metallicity. From this one can reconstruct the 3D density, kinematics, and orbital structure of stellar populations in different metallicity bins.
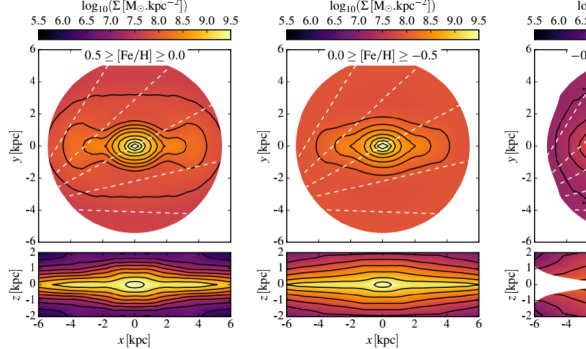
The metal-rich bar components. Figure 5 based on P17b shows face-on and edge-on surface densities for stars with (metal-rich bin A), (intermediate bin B), and (metal-poor bin C). In order of decreasing metallicity, the photometric selection of the ARGOS sample leads to of ARGOS stars in the bins (A, B, C), while the final SSF-corrected CDE model of the bar region has in bar-supporting and in not-bar supporting orbits in these bins, showing the importance of the SSF. Since estimated metallicity errors are dex (Ness et al., 2013a), much smaller than the total metallicity range, uncertainties in the MDF can only have small effects on the metallicity ordering. The figure illustrates that indeed stars in all metallicity bins are significantly barred. In terms of mass, most of the support to the bar is is provided by the metal-rich stars. Bin A stars contribute most to the Galactic bar and B/P bulge; they have dynamical properties consistent with a disk origin. Stars in bin B are hotter and rotate slightly faster than stars in A, they are more extended vertically, and contribute somewhat less to the bar and B/P shape. They are consistent with a disk origin formed from stars located initially at larger radii (Di Matteo et al., 2014).
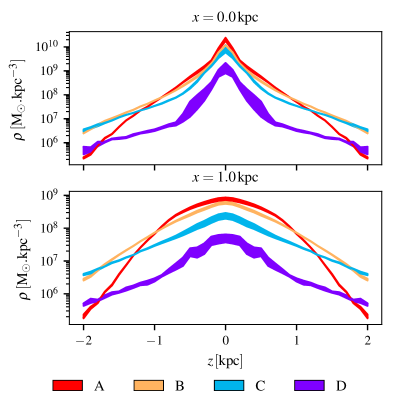
The metal-poor thick disk-like stars. Metal-poor stars in bin C () rotate slower and have higher dispersion than the more metal rich stars. As shown in Fig. 5, they contribute weaker support to the bar and do not support the B/P shape. Figure 7 shows that outside the central , these metal-poor stars are found to have the density distribution of a thick disk bar; in these regions their vertical profile is exponential with scale height pc. These stars also show cylindrical rotation (Ness et al., 2013b, P17b), further confirming their thick disk nature.
However, in the inner (, ) of the Bulge, Fig. 5 shows evidence for an extra component of these metal-poor stars with short scale height rising towards the Galactic center; this component is seen also for stars in the even more metal-poor bin D. See also Pietrukowicz et al. (2015) for RR Lyrae stars and Zoccali et al. (2017) for stars in GIBS. This component could consist of thick disk stars on orbits compressed by the deep gravitational potential of the nuclear disk, stars from the inner halo-bulge, or stars from a (so far unconfirmed) classical bulge formed by early mergers.
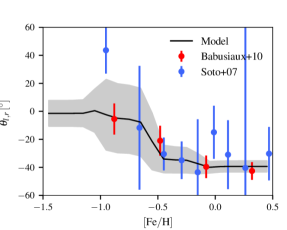
The combined orbit distributions of all metallicities in the model of P17b naturally reproduce the observed vertex deviations in Baade’s window, see Figure 7. The absence of a significant vertex deviation for stars in this plot with [Fe/H] has been interpreted as a signature of an old classical bulge by, e.g., Soto et al. (2007). However, the stars with [Fe/H] in Baade’s Window are predominantly from the thick disk-bar component of bin C; the lack of significant vertex deviation for these metal-poor stars is caused by this thick disk-bar distribution and does not imply a large classical bulge component.
5 Conclusions and outlook
Conclusions. We live in a strongly barred galaxy with a predominant B/P bulge. The bar region contains 2/3 of the MW’s stellar mass. The rotation curve and the low dark matter fraction in the bulge require a core in the Galaxy’s dark matter halo. Different stellar populations in the bulge have clearly different orbit distributions. This must be exemplary for most other bulge-like stellar systems, and make MW studies relevant for galaxy studies in general.
Outlook. We can look forward to the results of on-going and near-future ground-based surveys and of the Gaia mission. Based on these data we expect to reach an understanding of the MW’s stellar populations and formation history that is unique to our Galaxy.
On the structure of the inner Galaxy, we need to learn more about (1) the density, kinematics, stellar population mix of the nuclear disk, inner disk, and long bar, (2) the properties of the spiral arms and their masses, (3) the structure of the outer bulge and its transition to the inner halo, and (4) the dark matter distribution in the inner Galaxy. On the subject of stellar populations we need to understand better (5) how many stellar populations are there in the bulge and are they discrete or not? (6) what are the stellar populations in the long bar and how do they relate to those in the inner disk? (7) is the old, metal-poor component traced by RRL related to the early stellar halo? Is the metal-poor central concentration related to a classical bulge? Dynamical models will help in understanding many of these issues because they can relate stars to their orbits, which is a lower-dimensional and easier-to-understand space than positions and velocities.
Acknowledgments: I am grateful to Angeles Pérez-Villegas, Matthieu Portail, and Chris Wegg for our fruitful collaboration over the last several years.
References
- Abbott et al. (2017) Abbott, C., Valluri, M., Shen, J., Debattista, V.P. 2017, MNRAS, 470, 1526
- Antoja et al. (2014) Antoja, T., Helmi, A., Dehnen, W., et al. 2014, A&A, 563, A60
- Athanassoula (2016) Athanassoula, E. 2016, ASSL, 418, 391
- Babusiaux et al. (2010) Babusiaux, C., Gómez, A., Hill, V., et al. 2010, A&A, 519, 77
- Bland-Hawthorn & Gerhard (2016) Bland-Hawthorn, J., Gerhard, O. 2016, AR&A, 54, 529 (BHG16)
- Debattista et al. (2017) Debattista, V., Ness, M., Gonzalez, O.A., et al. 2017. MNRAS, 469, 1587
- Dehnen (2000) Dehnen, W. 2000, AJ, 119, 800
- De Lorenzi et al. (2007) De Lorenzi, F., Debattista, V. P., Gerhard, O., Sambhus, N. 2007, MNRAS, 376, 71
- De Lorenzi et al. (2008) De Lorenzi, F., Gerhard, O., Saglia, R. P., et al. 2008, MNRAS, 385, 1729
- Di Matteo et al. (2014) Di Matteo, P., Haywood, M., Gómez, A., et al. 2014, A&A, 567, A122
- Erwin & Debattista (2013) Erwin, P., Debattista, V.P. 2013, MNRAS, 431, 3060
- Erwin & Debattista (2016) Erwin, P., Debattista, V.P. 2016, ApJ, 825, L30
- Fragkoudi et al. (2017) Fragkoudi, F., Di Matteo, P., Haywood, M., et al. 2017, eprint arXiv:1704.00734
- Freeman et al. (2013) Freeman, K.C., Wylie-de-Boer, E., Athanassoula, E., et al. 2013. MNRAS, 428, 3660
- Gardner et al. (2014) Gardner, E., Debattista, V.P., Robin, A.C., Vasquez, S., Zoccali, M. 2014. MNRAS, 438, 3275
- Gran et al. (2016) Gran, F., Minniti, D., Saito, R.K., et al. 2016, A&A, 591, 145
- Kunder et al. (2012) Kunder, A., Koch, A., Rich, R.M., et al. 2012, AJ, 143, 57
- Kunder et al. (2016) Kunder, A., Rich, R.M., Koch, A., et al. 2016, ApJ, 821, L25
- Laurikainen et al. (2014) Laurikainen, E., Salo, H., Athanassoula, E., Bosma, A., Herrera-Endoqui, M. 2014, MNRAS, 444, L80
- Martinez-Valpuesta & Gerhard (2011) Martinez-Valpuesta, I., Gerhard, O. 2011, ApJ, 734, L20
- Martinez-Valpuesta & Gerhard (2013) Martinez-Valpuesta, I., Gerhard, O. 2013, ApJ, 766, L3
- McWilliam & Zoccali (2010) McWilliam, A., Zoccali, M. 2010, ApJ, 724, 1491
- Molaeinezhad et al. (2016) Molaeinezhad, A., Falcón-Barroso, J., Martínez-Valpuesta, I., et al. 2016, MNRAS, 456, 692
- Nataf et al. (2010) Nataf, D.M., Udalski, A., Gould, A., Fouqué, P., Stanek, K. 2010, ApJL, 721, L28
- Ness et al. (2013a) Ness, M., Freeman, K., Athanassoula, E., et al. 2013a, MNRAS, 430, 836
- Ness et al. (2013b) Ness M, Freeman K, Athanassoula E, et al. 2013b, MNRAS, 432, 2092
- Ness et al. (2016) Ness, M., Zasowski, G., Johnson, J.A., et al. 2016, ApJ 819, 2
- Pérez-Villegas et al. (2017) Pérez-Villegas, A., Portail, M., Gerhard, O. 2017, MNRAS, 464, L80
- Pietrukowicz et al. (2015) Pietrukowicz, P., Kozlowski, S., Skowron, J., et al. 2015, ApJ, 811, 113
- Piffl et al. (2014) Piffl T, Binney J, McMillan PJ, et al. 2014, MNRAS, 445, 3133
- Portail et al. (2015) Portail, M., Wegg, C., Gerhard, O., Martinez-Valpuesta, I. 2015, MNRAS, 448, 713
- Portail et al. (2017a) Portail, M., Gerhard, O., Wegg, C., Ness, M. 2017a, MNRAS, 465, 1621 (P17a)
- Portail et al. (2017b) Portail, M., Wegg, C., Gerhard, O., Ness, M. 2017b, MNRAS, 470, 1233 (P17b)
- Rich (2013) Rich, RM. 2013, in T.D. Oswalt, G. Gilmore (eds.), Planets, Stars and Stellar Systems (Springer:Dordrecht) 5, 271
- Rojas-Arriagada et al. (2017) Rojas-Arriagada, A., Recio-Blanco, A., de Laverny, P., et al. 2017, A&A, 601, A140
- Salaris & Girardi (2002) Salaris, M., Girardi, L. 2002, MNRAS 337, 332
- Shen et al. (2010) Shen, J., Rich, R.M., Kormendy, J., et al. 2010, ApJ, 720, L72
- Sormani et al. (2015) Sormani, M.C., Binney, J., Magorrian, J. 2015, MNRAS, 454, 1818
- Soto et al. (2007) Soto, M., Rich, R.M., Kuijken, K. 2007, ApJ 665, L31
- Valenti et al. (2016) Valenti, E., Zoccali, M., Gonzalez, O.A., et al. 2016, A&A, 587, L6
- Wegg & Gerhard (2013) Wegg, C., & Gerhard, O. 2013, MNRAS 435, 1874
- Wegg et al. (2015) Wegg, C., Gerhard, O., & Portail, M. 2015, MNRAS 450, 4050
- Wegg et al. (2017) —. 2017, ApJ, 843, L5
- Zoccali et al. (2014) Zoccali, M., Gonzalez, O.A., Vasquez, S., et al. 2014, A&A, 562, A66
- Zoccali et al. (2017) Zoccali, M., Vasquez, S., Gonzalez, O.A., et al. 2017, A&A, 599, 12