Conformer-selection by matter-wave interference
Abstract
We establish that matter-wave diffraction at near-resonant ultraviolet optical gratings can be used to spatially separate individual conformers of complex molecules. Our calculations show that the conformational purity of the prepared partial beams can be close to 100% and that all molecules remain in their electronic ground state. The proposed technique is independent of the dipole moment and the spin of the molecule and thus paves the way for structure-sensitive experiments with hydrocarbons and biomolecules, such as neurotransmitters and hormones, which have evaded conformer-pure isolation so far.
pacs:
03.75.-b,33.15.-e,37.20.+j,87.15.-v,I Introduction
The conformation of a molecule can have a strong influence on its chemical reaction rates. This was demonstrated for a number of compounds Chang et al. (2013); Taatjes et al. (2013); Sheps et al. (2014); Khriachtchev et al. (2009), where the rate constants of the conformer-specific reactions varied by a factor of at least two even though the conformers differed only in the orientation of a single bond. To explore such conformer specific traits, it is desirable to develop methods to separate conformers with high efficiency from an initially unsorted molecular ensemble.
Several conformer selection techniques have been developed in recent years. Charged molecules can be separated in collision cells using ion-mobility spectroscopy von Helden et al. (1995); Jarrold (2007); Papadopoulos et al. (2011). The separation of neutral molecules in high vacuum has been achieved using the Stark effect Filsinger et al. (2008, 2009); Chang et al. (2015). This method also allows to isolate spin-isomers Horke et al. (2014) and clusters with polar Trippel et al. (2012) and non-polar Putzke et al. (2012) particles in specific stochiometries. However, separation due to the Stark effect requires that the relevant conformers differ substantially in their rotational spectrum Motsch et al. (2009) or their electric dipole moment Putzke et al. (2012); Trippel et al. (2012). Any method that can overcome these restrictions will be instrumental for subsequent slowing Bethlem et al. (1999); Fulton et al. (2004); Hudson et al. (2006a); Bethlem et al. (2002); Chervenkov et al. (2014); Momose et al. (2013), trapping van Veldhoven et al. (2005); Heiner et al. (2007) or collision experiments Sawyer et al. (2011); Willitsch et al. (2008); Bell et al. (2009); Kirste et al. (2012), for high-resolution spectroscopy van Veldhoven et al. (2004); Hudson et al. (2006b); Schnell and Küpper (2011) and reaction studies.
Conformer-dependent reactions of hydrocarbons and aromatic radicals can strongly affect atmospheric and astrochemical processes, such as the oxidation of aromatics Atkinson and Arey (2007), the formation of smog Yu et al. (1997); Bejan et al. (2006), and the chemistry on Saturn’s moon Titan Sebree et al. (2010, 2012). Beams of size- and conformer-selected water clusters may give new insights into astrochemical Klemperer and Vaida (2006), atmospheric and environmental reactions Vaida (2011); Wyslouzil and Wölk (2016). Finally, small biomolecules, such as neurotransmitters and amino acids, offer rich conformational spaces Rizzo et al. (1986); de Vries and Hobza (2007); Schwing and Gerhards (2016). Experimental studies in the gas phase can shed new light on conformational preferences Butz et al. (2001); Wilke et al. (2016), isomerization barriers Dian et al. (2004a, b), and the influence of solvent molecules in hydrated beams Schmitt et al. (2005); LeGreve et al. (2009).
Here, we propose to use matter-wave diffraction at a tunable standing light wave grating for separating different conformers with high purity and high efficiency. Our scheme exploits that most conformers exhibit spectroscopically well separated electronic transitions in the ultraviolet, even if they are structurally similar and have comparable dipole moments. When the laser wavelength is resonant with the electronic transition of one specific conformer, the standing light wave will realize both an absorptive and a phase grating for the matter wave Keller et al. (1997); Cotter et al. (2015). All other conformers will only be subjected to a pure phase grating Gould et al. (1986); Nairz et al. (2001) which can suppress certain diffraction orders depending on the laser wavelength and energy. By balancing these effects a specific diffraction order can be preferentially populated by a selected conformer. One may then select this conformer with high purity by spatially filtering the molecular interference patterns. This method can address a wide range of biomolecules, radicals, hydrocarbons, and their water clusters (Supplementary Material).
II Proposed Setup
In our proposed setup (see Fig. 1) molecules are entrained in a pulsed supersonic expansion to prepare a ro-vibrationally cold ensemble with a fast but narrow velocity distribution. Several hundred rotational levels will still be occupied due to their small energy spacing. The molecules pass a slit skimmer and are diffracted at the source skimmer in accordance with Heisenberg’s uncertainty principle Nairz et al. (2002). After the distance m the molecular wave packet of mass traveling with velocity has a transverse coherence width , sufficiently large to illuminate several antinodes of a retro-reflected standing light wave.
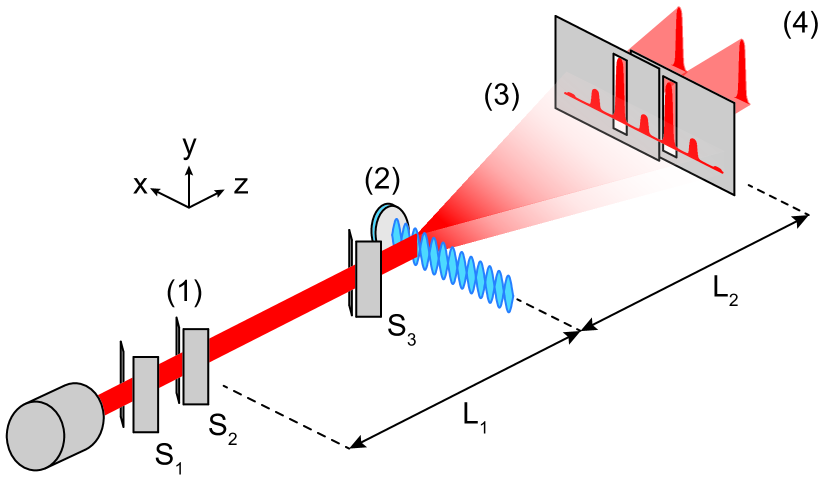
This optical grating with a period of can be generated by a narrow-band pulsed UV laser of wavelength , tuned with a linewidth of better than 1 pm. State-of-the-art frequency-doubled dye lasers meet these requirements and deliver sufficient energy per pulse to diffract the molecules. At the grating the molecules are diffracted according to their de Broglie wavelength with Planck’s constant . The required alignment of the grating mirror with respect to the molecular beam is determined by the pulse length of the laser and the collimation of the molecules. After traversing the grating, the molecular wave propagates the distance before it impinges onto a mask with two adjustable slits. These select, for instance, both first order diffraction peaks with a diffraction angle of .
Matter-wave-diffraction at optical gratings has been realized in continuous and pulsed interferometers for atoms Moskowitz et al. (1983); Martin et al. (1988), electrons Freimund et al. (2001) and molecules Haslinger et al. (2013); Nairz et al. (2001); Gerlich et al. (2007). The phase grating transfers an integer multiple of the grating momentum onto the traversing, rotating molecule. In addition, the molecule may absorb one or more photons depending on the laser wavelength, intensity, molecular absorption cross section, and interaction time. If only a single photon is absorbed, the coherent diffraction signal will be shifted in momentum by and filtered out by the mask provided that the diffraction peaks are sufficiently separated. Upon absorption of two or more photons, the molecule is ionized and removed from the beam.
III Molecule-Laser Interaction
The force acting on a polarizable molecule in the laser field is determined by the optical susceptibility, which depends on the laser wavelength and the rotational state . The real part of the susceptibility is the polarizability while the imaginary part depends on the total absorption cross section .
The effect of the pulsed standing light wave on the transverse motional state of the molecule can be described by the phase shift and the mean number of absorbed photons at the antinodes as a function of and the pulse-energy . The grating transit of a molecule in a rotational state is then characterized by the state-dependent grating transformation Nimmrichter et al. (2011); Stickler and Hornberger (2015)
| (1) |
The phase and the mean photon number can be related to the real and imaginary part of the susceptibility,
| (2) |
and
| (3) |
with the spot size .
IV Interference Pattern
The transverse wavefunction of a molecule’s center-of-mass motion, starting at position with velocity in the rotational state can be evaluated in the paraxial approximation as Hornberger et al. (2004); Stickler and Hornberger (2015)
| (4) | |||||
Here, is the total width of the grating as determined by the third skimmer. Averaging over all source points and rotation states with population then yields the molecular interference pattern
| (5) |
Interferometric conformer selection can be applied to all molecules with spectroscopically separated transitions in the visible/ultraviolet. This can be seen by considering the approximate intensity of the -th diffraction order in the far-field, i.e. for ,
| (6) |
where are Bessel functions. Spectroscopic separability of the conformers implies that the wavelength can be tuned in such a way that the polarizability of any chosen conformer exceeds all others substantially. By adjusting the pulse energy sufficiently low so that the Bessel function in Eq. (6) vanishes for all but the selected species, the first diffraction order will be populated predominantly by this conformer. This demonstrates the general applicability of the proposed method, even though there can be regions of and for which interferometric conformer selection works with even higher efficiency.
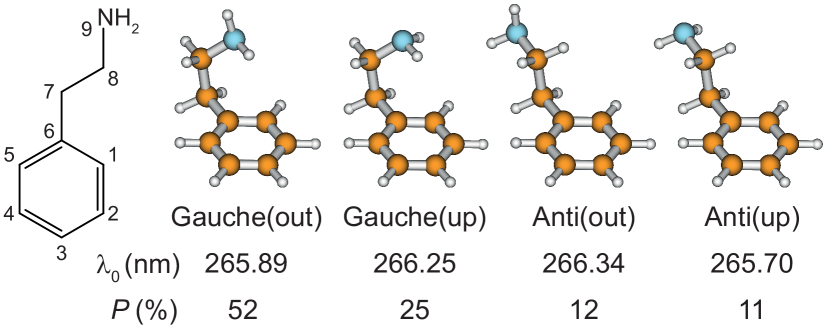
V Conformer-selective Interference of PEA
To illustrate the method, we study the neurotransmitter 2-phenylethylamine (PEA), see Fig. 2. In jet experiments it exhibits four conformers, which are spectroscopically well separated Martinez et al. (1993); Dickinson et al. (1998). They differ in the conformation of the C–N bond and the lone pair of the NH2 group. While the former is either in anti or gauche position to the C6–C7 bond, the latter points up or out with respect to the chromophore. Since PEA has only a single polar group, the dipole moments of all four observed conformers are predicted to be virtually identical ( D) Lopez et al. (2007); Brand et al. (2011). Stark separation is thus practically impossible Putzke et al. (2012). The susceptibility of the four different conformers is calculated from data compiled in the Supplementary Material. The complex optical susceptibility of each conformer can be described by a Lorentz oscillator model Townes and Schawlow (1975); Bohren and Huffman (2007) where the transition frequencies of the rotational states are calculated from the conformer-dependent rotational constants Meerts and Schmitt (2006); Dickinson et al. (1998). The mean static polarizability Å3 was calculated using density functional theory and agrees well with the value obtained from the refractive index in solution Hayes (2016). The maximum deviation between different conformers is at Å3 (Supplementary Material) and negligible compared to the optical polarizability which changes by tens of Å3 over the considered wavelength region. The rotational sub-structure of the electronic transition consists of several hundred individual peaks even at a rotational temperature of K. To account for this, we divide the rotational spectrum into 20 intervals and calculate for each bin its mean spectroscopic weight .
VI Conformer Selection Efficiency
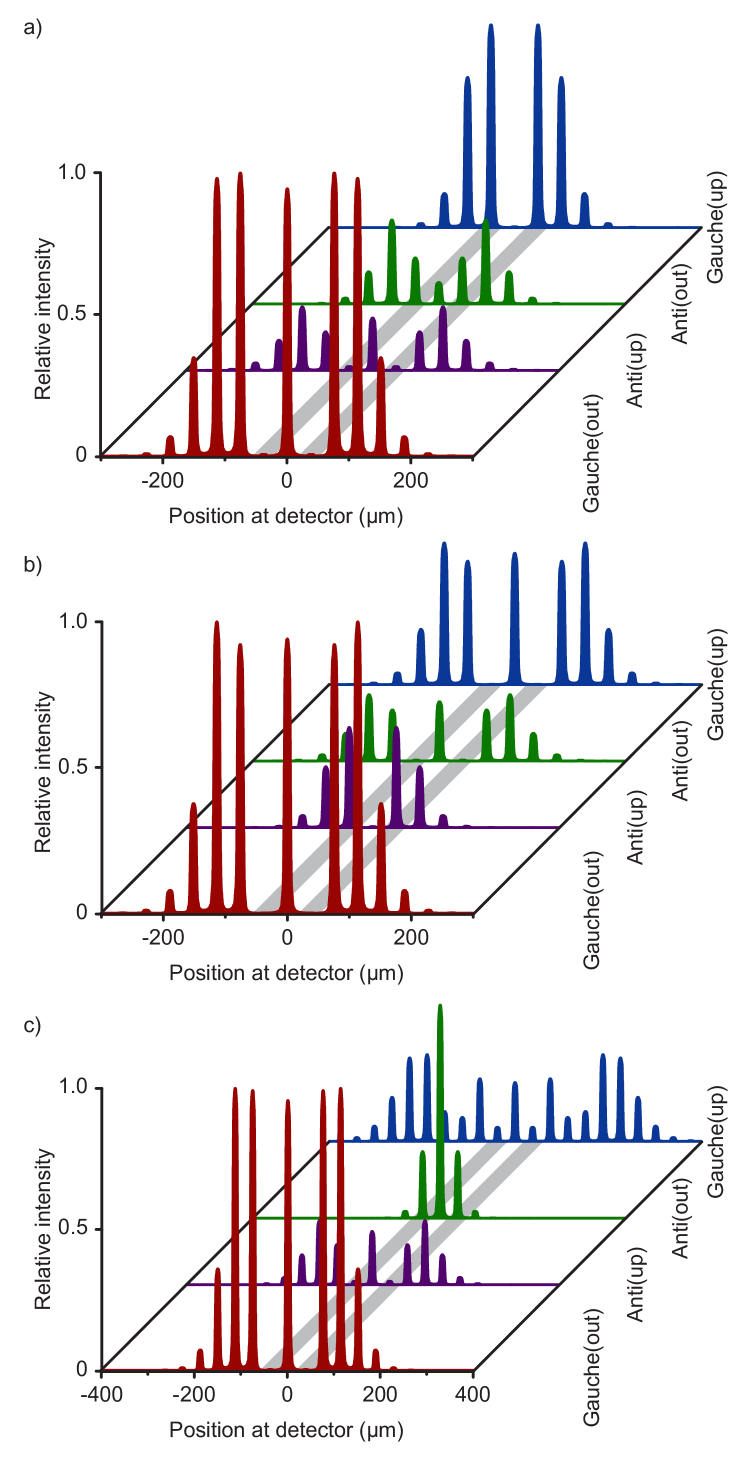
In Fig. 3a we show the interference patterns of the four conformers diffracted at a grating with nm, mJ, and mm2. The grating wavelength lies between the electronic transitions of the Anti(up) and the Gauche(out) conformers. Hence, the respective values of deviate strongly from the static polarizability, while they are close to that value for Gauche(up) and Anti(out). At the chosen parameters the intensity in the first diffraction order is maximal for Gauche(out) comprising 35% of the total population of this conformer.
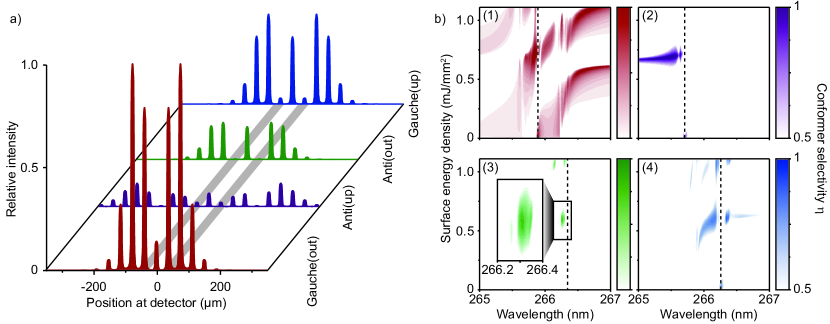
From the interference patterns we calculated the conformer-selection efficiency in the first diffraction order, that is the fraction of one conformer compared to the sum of all four. For the patterns shown in Fig. 3a reaches a value of , illustrating that high-purity conformer-selection is possible with this method. To prove the feasibility of a clear separation for all molecular conformers, we have extended the simulations to the wavelength region between 265 and 267 nm and to an surface energy density up to 1.1 mJ/mm2. For each simulated pattern we calculated and compiled the results in Fig. 3b for the four conformers. Here we color the plot only when an efficiency of 50 % is exceeded, areas of lower selectivity are left blank. It shows a rich pattern due to the strong wavelength-dependence of and near the resonances. The size of the parameter space which leads to selectivity depends strongly on the relative population of the conformer in the beam. For the Gauche(out) conformer a selectivity greater than 50% is observed in large parts of the parameter space. However, even for the weakly populated Anti(out) conformer exceeds 80% over a range of 0.03 nm which is experimentally easily accessible. It demonstrates that every single conformer of PEA can be selected with a high conformer selectivity and that specific conformers can be addressed by tuning the laser wavelength and power. Since the details of the selection efficiency shown in Fig. 3b are highly sensitive on the oscillator strength , measuring the conformer-selection efficiency offers a new way to probe it for all conformers.
VII Experimental Feasibility
The separation between neighboring resonances of the polarizability spectrum is on the order of nm, and therefore well resolved by a dye laser with a laser linewidth of 1 pm, even in the presence of rotational broadening of the spectrum. For medium-sized molecules such as PEA, the rotational energy spread at 3 K is roughly 0.02 nm Dickinson et al. (1998) – much smaller than the separation between the electronic resonances of the neighboring conformers. In a realistic experimental situation a certain fraction of the molecular beam will not interact with the pulsed laser beam and pass on to the detector in the blocked zeroth diffraction order. Furthermore, as the carrier gas is much lighter than the molecules, it experiences larger diffraction angles than the analyte molecule. Hence, the diffraction orders do not overlap and the proposed method is virtually background-free. This is comparable to Stark deflection where polar conformers are deflected out of the initial beam Filsinger et al. (2009).
The selectivity of our proposed method depends on the power stability of the laser system. When operated in saturation the fluctuation of a dye laser depends solely on the performance of the diode-pumped solid state laser, which can reach . After frequency doubling this leads to stability in power. However, even for power variations of the simulations predict values of between for Anti(out) and for Gauche(out) (see Supplementary Material).
The flux for a specific conformer behind the selection slits can be estimated using the vapor pressure of PEA at 410 K Mokbel et al. (2009), the characteristics of a pulsed Even-Lavie-valve Hillenkamp et al. (2003); Even (2015), a 100 Hz laser illuminating an area of mm2, and the diffraction pattern of the Gauche(out) conformer shown in Fig. 3a. Assuming that 78% of the molecules are in their vibrational ground state and a mean number of absorbed photons of , we expect a mean flux of cm-2s-1 (Supplementary Material). The peak density reaches cm-3 which is comparable to densities used in X-ray diffraction at free electron lasers Küpper et al. (2014) and in crossed beam studies Kirste et al. (2012).
Since the presented matter-wave assisted separation technique requires the conformers only to have sharp and separated transitions in the ultraviolet, it can be used for a wide range of species and applications. This includes large families of molecular systems such as hydrocarbons, small biomolecules, and aromatic radicals de Vries and Hobza (2007); Zwier (2006); Sebree et al. (2011) (Supplementary Material). It can provide conformer-pure samples for X-ray diffraction Barty et al. (2013) or Coulomb explosion studies Levin et al. (1998); Pitzer et al. (2013), merged beam experiments Kirste et al. (2012); Wei et al. (2012) or collisions with trapped neutral particles Sawyer et al. (2011) or cold ions Chang et al. (2013); Willitsch et al. (2008); Bell et al. (2009). The selected structure can be varied during the experiment by changing the wavelength and the pulse energy of the grating laser. This way several conformers can be compared within one experimental run. The combination with molecular cooling schemes might also prepare samples for high-resolution spectroscopy van Veldhoven et al. (2004); Hudson et al. (2006b); Schnell and Küpper (2011).
VIII Conclusion
We have presented a robust scheme to select molecular conformers in the vibrational ground state with purities of up to 95%. The method requires an intense and tightly collimated molecular beam giving rise to matter-wave diffraction at a tunable laser grating. It is applicable to large families of conformers that can be distinguished by individual and sharp electronic transitions in the UV. Being independent of internal dipole moments or the spin state, it can be applied to non-polar molecules, radicals and their clusters alike. Furthermore, this technique eliminates most of the vibrationally excited molecules from the region of interest, selecting colder molecules in the beam.
IX acknowledgments
C.B. and B.A.S. contributed equally to this work. This project has received funding from the European Research Council (ERC) under the EU Horizon 2020 research and innovation programme (grant agreement n∘320694) and the Austrian Science Funds FWF W1210-N25.
References
- Chang et al. (2013) Y.-P. Chang, K. Długołęcki, J. Küpper, D. Rösch, D. Wild, and S. Willitsch, Science 342, 98 (2013).
- Taatjes et al. (2013) C. A. Taatjes, O. Welz, A. J. Eskola, J. D. Savee, A. M. Scheer, D. E. Shallcross, B. Rotavera, E. P. F. Lee, J. M. Dyke, D. K. W. Mok, D. L. Osborn, and C. J. Percival, Science 340, 177 (2013).
- Sheps et al. (2014) L. Sheps, A. M. Scully, and K. Au, Phys. Chem. Chem. Phys. 16, 26701 (2014).
- Khriachtchev et al. (2009) L. Khriachtchev, A. Domanskaya, K. Marushkevich, M. Räsänen, B. Grigorenko, A. Ermilov, N. Andrijchenko, and A. Nemukhin, J. Phys. Chem. A 113, 8143 (2009).
- von Helden et al. (1995) G. von Helden, T. Wyttenbach, and M. T. Bowers, Science 267, 1483 (1995).
- Jarrold (2007) M. F. Jarrold, Phys. Chem. Chem. Phys. 9, 1659 (2007).
- Papadopoulos et al. (2011) G. Papadopoulos, A. Svendsen, O. V. Boyarkin, and T. R. Rizzo, Faraday Discuss. 150, 243 (2011).
- Filsinger et al. (2008) F. Filsinger, U. Erlekam, G. von Helden, J. Küpper, and G. Meijer, Phys. Rev. Lett. 100, 133003 (2008).
- Filsinger et al. (2009) F. Filsinger, J. Küpper, G. Meijer, J. L. Hansen, J. Maurer, J. H. Nielsen, L. Holmegaard, and H. Stapelfeldt, Angew. Chem. Int. Ed. 48, 6900 (2009).
- Chang et al. (2015) Y.-P. Chang, D. A. Horke, S. Trippel, and J. Küpper, Int. Rev. Phys. Chem. 34, 557 (2015).
- Horke et al. (2014) D. A. Horke, Y.-P. Chang, K. Długołęcki, and J. Küpper, Angew. Chem. Int. Ed. 53, 11965 (2014).
- Trippel et al. (2012) S. Trippel, Y.-P. Chang, S. Stern, T. Mullins, L. Holmegaard, and J. Küpper, Phys. Rev. A 86, 033202 (2012).
- Putzke et al. (2012) S. Putzke, F. Filsinger, J. Küpper, and G. Meijer, J. Chem. Phys. 137, 104310 (2012).
- Motsch et al. (2009) M. Motsch, L. D. van Buuren, C. Sommer, M. Zeppenfeld, G. Rempe, and P. W. H. Pinkse, Phys. Rev. A 79, 013405 (2009).
- Bethlem et al. (1999) H. L. Bethlem, G. Berden, and G. Meijer, Phys. Rev. Lett. 83, 1558 (1999).
- Fulton et al. (2004) R. Fulton, A. I. Bishop, and P. F. Barker, Phys. Rev. Lett. 93, 243004 (2004).
- Hudson et al. (2006a) E. R. Hudson, C. Ticknor, B. C. Sawyer, C. A. Taatjes, H. J. Lewandowski, J. R. Bochinski, J. L. Bohn, and J. Ye, Phys. Rev. A 73, 063404 (2006a).
- Bethlem et al. (2002) H. L. Bethlem, A. J. A. van Roij, R. T. Jongma, and G. Meijer, Phys. Rev. Lett. 88, 133003 (2002).
- Chervenkov et al. (2014) S. Chervenkov, X. Wu, J. Bayerl, A. Rohlfes, T. Gantner, M. Zeppenfeld, and G. Rempe, Phys. Rev. Lett. 112, 013001 (2014).
- Momose et al. (2013) T. Momose, Y. Liu, S. Zhou, P. Djuricanin, and D. Carty, Phys. Chem. Chem. Phys. 15, 1772 (2013).
- van Veldhoven et al. (2005) J. van Veldhoven, H. L. Bethlem, and G. Meijer, Phys. Rev. Lett. 94, 083001 (2005).
- Heiner et al. (2007) C. E. Heiner, D. Carty, G. Meijer, and H. L. Bethlem, Nat. Phys. 3, 115 (2007).
- Sawyer et al. (2011) B. C. Sawyer, B. K. Stuhl, M. Yeo, T. V. Tscherbul, M. T. Hummon, Y. Xia, J. Kłos, D. Patterson, J. M. Doyle, and J. Ye, Phys. Chem. Chem. Phys. 13, 19059 (2011).
- Willitsch et al. (2008) S. Willitsch, M. T. Bell, A. D. Gingell, S. R. Procter, and T. P. Softley, Phys. Rev. Lett. 100, 043203 (2008).
- Bell et al. (2009) M. T. Bell, A. D. Gingell, J. M. Oldham, T. P. Softley, and S. Willitsch, Farad. Discuss. 142, 73 (2009).
- Kirste et al. (2012) M. Kirste, X. Wang, H. C. Schewe, G. Meijer, K. Liu, A. van der Avoird, L. M. C. Janssen, K. B. Gubbels, G. C. Groenenboom, and S. Y. T. van de Meerakker, Science 338, 1060 (2012).
- van Veldhoven et al. (2004) J. van Veldhoven, J. Küpper, H. L. Bethlem, B. Sartakov, A. J. A. van Roij, and G. Meijer, Eur. Phys. J. D 31, 337 (2004).
- Hudson et al. (2006b) E. R. Hudson, H. J. Lewandowski, B. C. Sawyer, and J. Ye, Phys. Rev. Lett. 96, 143004 (2006b).
- Schnell and Küpper (2011) M. Schnell and J. Küpper, Farad. Discuss. 150, 33 (2011).
- Atkinson and Arey (2007) R. Atkinson and J. Arey, Polycycl. Aromat. Compd. 27, 15 (2007).
- Yu et al. (1997) J. Yu, H. E. Jeffries, and K. G. Sexton, Atmos. Environ. 31, 2261 (1997).
- Bejan et al. (2006) I. Bejan, Y. Abd El Aal, I. Barnes, T. Benter, B. Bohn, P. Wiesen, and J. Kleffmann, Phys. Chem. Chem. Phys. 8, 2028 (2006).
- Sebree et al. (2010) J. A. Sebree, V. V. Kislov, A. M. Mebel, and T. S. Zwier, Farad. Discuss. 147, 231 (2010).
- Sebree et al. (2012) J. A. Sebree, N. M. Kidwell, T. M. Selby, B. K. Amberger, R. J. McMahon, and T. S. Zwier, J. Am. Chem. Soc. 134, 1153 (2012).
- Klemperer and Vaida (2006) W. Klemperer and V. Vaida, Proc. Natl. Acad. Sci. U.S.A 103, 10584 (2006).
- Vaida (2011) V. Vaida, J. Chem. Phys. 135, 020901 (2011).
- Wyslouzil and Wölk (2016) B. E. Wyslouzil and J. Wölk, J. Chem. Phys. 145, 211702 (2016).
- Rizzo et al. (1986) T. R. Rizzo, Y. D. Park, L. A. Peteanu, and D. H. Levy, J. Chem. Phys. 84, 2534 (1986).
- de Vries and Hobza (2007) M. S. de Vries and P. Hobza, Annu. Rev. Phys. Chem. 58, 585 (2007).
- Schwing and Gerhards (2016) K. Schwing and M. Gerhards, Int. Rev. Phys. Chem. 35, 569 (2016).
- Butz et al. (2001) P. Butz, R. T. Kroemer, N. A. Macleod, and J. P. Simons, J. Phys. Chem. A 105, 544 (2001).
- Wilke et al. (2016) M. Wilke, C. Brand, J. Wilke, and M. Schmitt, Phys. Chem. Chem. Phys. 18, 13538 (2016).
- Dian et al. (2004a) B. C. Dian, A. Longarte, P. R. Winter, and T. S. Zwier, J. Chem. Phys. 120, 133 (2004a).
- Dian et al. (2004b) B. C. Dian, J. R. Clarkson, and T. S. Zwier, Science 303, 1169 (2004b).
- Schmitt et al. (2005) M. Schmitt, M. Böhm, C. Ratzer, C. Vu, I. Kalkman, and W. L. Meerts, J. Am. Chem. Soc. 127, 10356 (2005).
- LeGreve et al. (2009) T. A. LeGreve, W. H. James III, and T. S. Zwier, J. Phys. Chem. A 113, 399 (2009).
- Keller et al. (1997) C. Keller, M. K. Oberthaler, R. Abfalterer, S. Bernet, J. Schmiedmayer, and A. Zeilinger, Phys. Rev. Lett. 79, 3327 (1997).
- Cotter et al. (2015) J. P. Cotter, S. Eibenberger, L. Mairhofer, X. Cheng, P. Asenbaum, M. Arndt, K. Walter, S. Nimmrichter, and K. Hornberger, Nat. Commun. 6, 8336 (2015).
- Gould et al. (1986) P. L. Gould, G. A. Ruff, and D. E. Pritchard, Phys. Rev. Lett. 56, 827 (1986).
- Nairz et al. (2001) O. Nairz, B. Brezger, M. Arndt, and A. Zeilinger, Phys. Rev. Lett. 87, 160401 (2001).
- Nairz et al. (2002) O. Nairz, M. Arndt, and A. Zeilinger, Phys. Rev. A 65, 032109 (2002).
- Moskowitz et al. (1983) P. E. Moskowitz, P. L. Gould, S. R. Atlas, and D. E. Pritchard, Phys. Rev. Lett. 51, 370 (1983).
- Martin et al. (1988) P. J. Martin, B. G. Oldaker, A. H. Miklich, and D. E. Pritchard, Phys. Rev. Lett. 60, 515 (1988).
- Freimund et al. (2001) D. L. Freimund, K. Aflatooni, and H. Batelaan, Nature 413, 142 (2001).
- Haslinger et al. (2013) P. Haslinger, N. Dörre, P. Geyer, J. Rodewald, S. Nimmrichter, and M. Arndt, Nat. Phys. 9, 144 (2013).
- Gerlich et al. (2007) S. Gerlich, L. Hackermüller, K. Hornberger, A. Stibor, H. Ulbricht, M. Gring, F. Goldfarb, T. Savas, M. Muri, M. Mayor, and M. Arndt, Nat. Phys. 3, 711 (2007).
- Nimmrichter et al. (2011) S. Nimmrichter, P. Haslinger, K. Hornberger, and M. Arndt, New J. Phys. 13, 075002 (2011).
- Stickler and Hornberger (2015) B. A. Stickler and K. Hornberger, Phys. Rev. A 92, 023619 (2015).
- Hornberger et al. (2004) K. Hornberger, J. E. Sipe, and M. Arndt, Phys. Rev.A 70, 053608 (2004).
- Martinez et al. (1993) S. J. Martinez, J. C. Alfano, and D. H. Levy, J. Mol. Spectrosc. 158, 82 (1993).
- Dickinson et al. (1998) J. A. Dickinson, M. R. Hockridge, R. T. Kroemer, E. G. Robertson, J. P. Simons, J. McCombie, and M. Walker, J. Am. Chem. Soc. 120, 2622 (1998).
- Lopez et al. (2007) J. C. Lopez, V. Cortijo, S. Blanco, and J. L. Alonso, Phys. Chem. Chem. Phys. 9, 4521 (2007).
- Brand et al. (2011) C. Brand, W. L. Meerts, and M. Schmitt, J. Phys. Chem. A 115, 9612 (2011).
- Townes and Schawlow (1975) C. H. Townes and L. Schawlow, Microwave Spectroscopy (Dover, 1975).
- Bohren and Huffman (2007) C. F. Bohren and D. R. Huffman, Absorption and Scattering of Light by Small Particles (Wiley-VCH Verlag GmbH, 2007).
- Meerts and Schmitt (2006) W. L. Meerts and M. Schmitt, Int. Rev. Phys. Chem. 25, 353 (2006).
- Hayes (2016) W. M. Hayes, CRC Handbook of Chemistry and Physics, 97th ed. (Taylor & Francis, 2016).
- Mokbel et al. (2009) I. Mokbel, A. Razzouk, T. Sawaya, and J. Jose, J. Chem. Eng. Data 54, 819 (2009).
- Hillenkamp et al. (2003) M. Hillenkamp, S. Keinan, and U. Even, J. Chem. Phys. 118, 8699 (2003).
- Even (2015) U. Even, EPJ Tech. Instrum. 2, 17 (2015).
- Küpper et al. (2014) J. Küpper, S. Stern, L. Holmegaard, F. Filsinger, A. Rouzée, A. Rudenko, P. Johnsson, A. V. Martin, M. Adolph, A. Aquila, S. Bajt, A. Barty, C. Bostedt, J. Bozek, C. Caleman, R. Coffee, N. Coppola, T. Delmas, S. Epp, B. Erk, L. Foucar, T. Gorkhover, L. Gumprecht, A. Hartmann, R. Hartmann, G. Hauser, P. Holl, A. Hömke, N. Kimmel, F. Krasniqi, K.-U. Kühnel, J. Maurer, M. Messerschmidt, R. Moshammer, C. Reich, B. Rudek, R. Santra, I. Schlichting, C. Schmidt, S. Schorb, J. Schulz, H. Soltau, J. C. H. Spence, D. Starodub, L. Strüder, J. Thøgersen, M. J. J. Vrakking, G. Weidenspointner, T. A. White, C. Wunderer, G. Meijer, J. Ullrich, H. Stapelfeldt, D. Rolles, and H. N. Chapman, Phys. Rev. Lett. 112, 083002 (2014).
- Zwier (2006) T. S. Zwier, J. Phys. Chem. A 110, 4133 (2006).
- Sebree et al. (2011) J. A. Sebree, N. M. Kidwell, E. G. Buchanan, M. Z. Zgierski, and T. S. Zwier, Chem. Sci. 2, 1746 (2011).
- Barty et al. (2013) A. Barty, J. Küpper, and H. N. Chapman, Annu. Rev. Phys. Chem. 64, 415 (2013).
- Levin et al. (1998) J. Levin, H. Feldman, A. Baer, D. Ben-Hamu, O. Heber, D. Zajfman, and Z. Vager, Phys. Rev. Lett. 81, 3347 (1998).
- Pitzer et al. (2013) M. Pitzer, M. Kunitski, A. S. Johnson, T. Jahnke, H. Sann, F. Sturm, L. P. H. Schmidt, H. Schmidt-Böcking, R. Dörner, J. Stohner, J. Kiedrowski, M. Reggelin, S. Marquardt, A. Schießer, R. Berger, and M. S. Schöffler, Science 341, 1096 (2013).
- Wei et al. (2012) Q. Wei, I. Lyuksyutov, and D. Herschbach, J. Chem. Phys. 137, 054202 (2012).
- Sipior et al. (1991) J. Sipior, C. K. Teh, and M. Sulkes, J. Fluorescence 1, 41 (1991).
- LeGreve et al. (2007) T. A. LeGreve, E. E. Baquero, and T. S. Zwier, J. Am. Chem. Soc. 129, 4028 (2007).
- Florio et al. (2002) G. M. Florio, R. A. Christie, K. D. Jordan, and T. S. Zwier, J. Am. Chem. Soc. 124, 10236 (2002).
- Florio and Zwier (2003) G. M. Florio and T. S. Zwier, J. Phys. Chem. A 107, 974 (2003).
- Park et al. (1986) Y. D. Park, T. R. Rizzo, L. A. Peteanu, and D. H. Levy, J. Chem. Phys. 84, 6539 (1986).
- Carney and Zwier (2001) J. R. Carney and T. S. Zwier, Chem. Phys. Lett. 341, 77 (2001).
- Nguyen et al. (2005) T. V. Nguyen, T. M. Korter, and D. W. Pratt, Mol. Phys. 103, 1603 (2005).
- Sipior and Sulkes (1988) J. Sipior and M. Sulkes, J. Chem. Phys. 88, 6146 (1988).
- Vu et al. (2009) T. B. C. Vu, I. Kalkman, W. L. Meerts, C. Brand, Y. N. Svartsov, S. Wiedemann, R. Weinkauf, and M. Schmitt, Phys. Chem. Chem. Phys. 11, 2433 (2009).
- Brause et al. (2006) R. Brause, H. Fricke, M. Gerhards, R. Weinkauf, and K. Kleinermanns, Chem. Phys. 327, 43 (2006).
- Yao et al. (2000) J. Yao, H. S. Im, M. Foltin, and E. R. Bernstein, J. Phys. Chem. A 104, 6197 (2000).
- Gerhards et al. (2004) M. Gerhards, C. Unterberg, A. Gerlach, and A. Jansen, Phys. Chem. Chem. Phys. 6, 2682 (2004).
- Dian et al. (2002) B. C. Dian, A. Longarte, S. Mercier, D. A. Evans, D. J. Wales, and T. S. Zwier, J. Chem. Phys. 117, 10688 (2002).
- Nimlos et al. (1989) M. R. Nimlos, D. F. Kelley, and E. R. Bernstein, J. Phys. Chem. 93, 643 (1989).
- Held and Pratt (1993) A. Held and D. W. Pratt, J. Am. Chem. Soc. 115, 9708 (1993).
- Talbot and Simons (2002) F. O. Talbot and J. P. Simons, Phys. Chem. Chem. Phys. 4, 3562 (2002).
- Jockusch et al. (2003a) R. A. Jockusch, R. T. Kroemer, F. O. Talbot, and J. P. Simons, J. Phys. Chem. A 107, 10725 (2003a).
- Jockusch et al. (2003b) R. A. Jockusch, F. O. Talbot, and J. P. Simons, Phys. Chem. Chem. Phys. 5, 1502 (2003b).
- Korn et al. (2016) J. A. Korn, D. P. Tabor, E. L. Sibert, and T. S. Zwier, J. Chem. Phys. 145, 124314 (2016).
- A. Dickinson et al. (1997) J. A. Dickinson, P. W. Joireman, R. T. Kroemer, E. G. Robertson, and J. P. Simons, J. Chem. Soc. Faraday Trans. 93, 1467 (1997).
- Breen et al. (1987) P. J. Breen, E. R. Bernstein, and J. I. Seeman, J. Chem. Phys. 87, 3269 (1987).
- Selby et al. (2005) T. M. Selby, J. R. Clarkson, D. Mitchell, J. A. J. Fitzpatrick, H. D. Lee, D. W. Pratt, and T. S. Zwier, J. Phys. Chem. A 109, 4484 (2005).
- Jacoby et al. (1998) C. Jacoby, W. Roth, M. Schmitt, C. Janzen, D. Spangenberg, and K. Kleinermanns, J. Phys. Chem. A 102, 4471 (1998).
- Roth et al. (1998) W. Roth, M. Schmitt, C. Jacoby, D. Spangenberg, C. Janzen, and K. Kleinermanns, Chem. Phys. 239, 1 (1998).
X Supplementary Material
X.1 Optical polarizability and rotational average for 2-phenylethylamine (PEA)
For each conformer of PEA, the complex optical polarizability at laser wavelength is calculated using the Lorentz-Drude formula for a single electronic transition Hayes (2016); Townes and Schawlow (1975); Bohren and Huffman (2007),
| (7) |
We assumed a common excited state lifetime of 70 ns based on experimental data Martinez et al. (1993). The static polarizabilities were calculated using density functional theory with the PBE0 functional employing the Def2-TZVP basis set and are compiled in Table 1. The oscillator strength and the electronic transition wavelength are also compiled in Table 1 for each conformer of PEA.
In order to take the rotational structure of the transition from the electronic ground to the excited state into account, we note that the final measurement traces over all rotation states. Thus, any coherences between rotational levels can be neglected and we determine the interference pattern for each transition, replacing by in (7), and sum over the resulting interference patterns, weighted by their respective spectroscopic relative intensity. Several hundred transitions relevant for PEA are collected in a histogram. We use the mean frequency and spectroscopic weight of each bin to perform the calculation. Only in the case of rotation-state resolved detection, the coherences between rotational levels need to be considered.
| Conformer | (nm) | (Å3) | ||
|---|---|---|---|---|
| Gauche(out) | 0.56 | 265.89 | 14.5 | 52 |
| Gauche(up) | 0.92 | 266.25 | 14.5 | 25 |
| Anti(out) | 0.64 | 266.34 | 14.6 | 12 |
| Anti(up) | 1.94 | 265.70 | 14.7 | 11 |
X.2 Selection efficiency
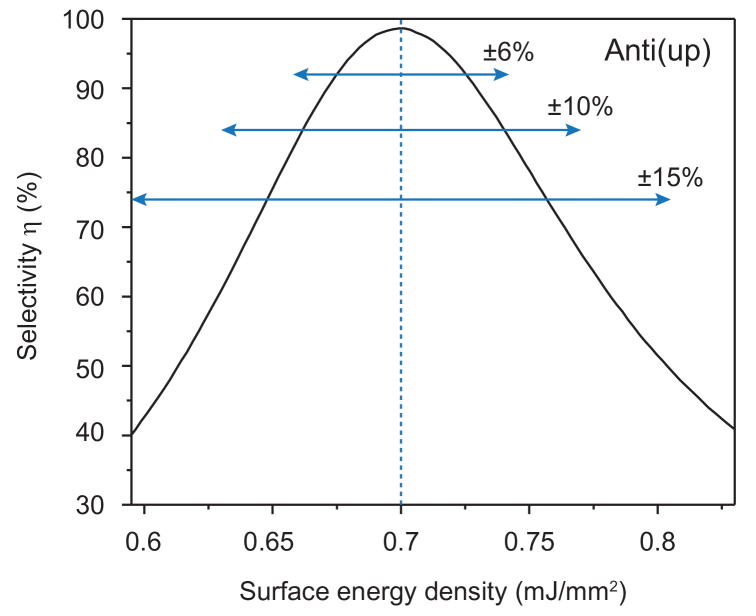
The selectivity of the proposed method depends on both the wavelength of the grating laser and the surface energy density. The wavelength stability of current pulsed dye lasers is in the pm regime which is sufficient to maintain stable diffraction pattern over time. The effect of power fluctuations is illustrated in Fig. 4 for the Anti(out) conformer at a wavelength of 265.55 nm. The selectivity peaks at a surface density of 0.7 mJ/mm2. Power fluctuations of would reduce the integrated selectivity to 92. Even under strong energy fluctuations, for instance, at mJ/mm the selectivity still reaches . The power-dependent selectivities of all four conformers are compiled in Table 2.
| Conformer | Wavelength | Surface power | Mean | ||
|---|---|---|---|---|---|
| (nm) | density (mJ/mm2) | selectivity | |||
| Gauche(out) | 265.84 | 100 | |||
| 97 | |||||
| 95 | |||||
| Gauche(up) | 266.17 | 83 | |||
| 79 | |||||
| 75 | |||||
| Anti(out) | 266.26 | 88 | |||
| 77 | |||||
| 70 | |||||
| Anti(up) | 265.55 | 99 | |||
| 84 | |||||
| 74 |
X.3 Expected molecular flux behind the selection slits
The particle flux is determined by the partial pressure of 2-phenylethylamine, the temperature , and the velocity of the molecules. Taking the velocity of an adiabatic expansion of Argon ( m/s) and the partial pressure of 2-phenylethylamine at K Mokbel et al. (2009), this yields a flux of m-2s-1.
We consider the example of a supersonic expansion from an Even-Lavie valve Even (2015) with a nozzle diameter of m, emitting a molecular current of s-1. The spatial distribution of the expansion can be described by a gaussian with a full width at half maximum of 12∘ Hillenkamp et al. (2003). At the second collimation slit S2, 0.1 m behind the nozzle, the molecular beam has a half width at half maximum of 10 mm. The fraction of molecules transmitted through the slit of 1 mm height and m width is calculated from the two-dimensional integral over the size of the detector slit.
This yields a reduction factor of , leading to a particle current s-1 for a continuous flow of molecules. Here we consider that the skimmer S1 does not play a significant role as S2 leads to a more stringent collimation. The collimated beam propagates 1 m until it reaches the skimmer S3 (1 mm 10 m), where the number of particles is reduced by another factor of . This yields an overall reduction factor of . For a spot size of mm2, the number of molecules illuminated by the laser is molecules per pulse. The number of isolated molecules also depends on the relative population of the targeted conformer, the population of the vibrational ground state, the number of molecules ionized by the grating laser, and the percentage of molecules diffracted into the first order.
In Fig. 3a we consider the diffraction of the Gauche(out) conformer of PEA. Its relative population is 52% Dickinson et al. (1998), 78% of all molecules are expected to be in the vibrational ground state, and 35% of the conformers are diffracted into the first order. The ionization probability at this wavelength is computed to be below and can be neglected. This yields about molecules per laser shot and a mean current of s-1 cm-2, assuming a laser repetition rate of 100 Hz and a detection area of mm m. The width of the area is given by separation of the first diffraction orders. The peak density corresponds to cm-3 which compares well to the beam density used in XUV diffraction experiments at free electron lasers ( cm-3) Küpper et al. (2014). As shown in Fig. 3b, also less abundant conformers can be isolated with high selectivity. Fig. 5a shows the molecular diffraction patterns for all conformers at nm and a surface power density of 0.57 mJ/mm2. At these parameters the Gauche(up) conformer is selected and 51% of all molecules in the Gauche(up) conformation are in the first diffraction orders, leading to a peak density of cm-3. The diffraction patterns at points of high selectivity for the two Anti conformers are shown in the lower panels. The extracted peak density is cm-3 for Anti(up) and cm-3 for Anti(out).
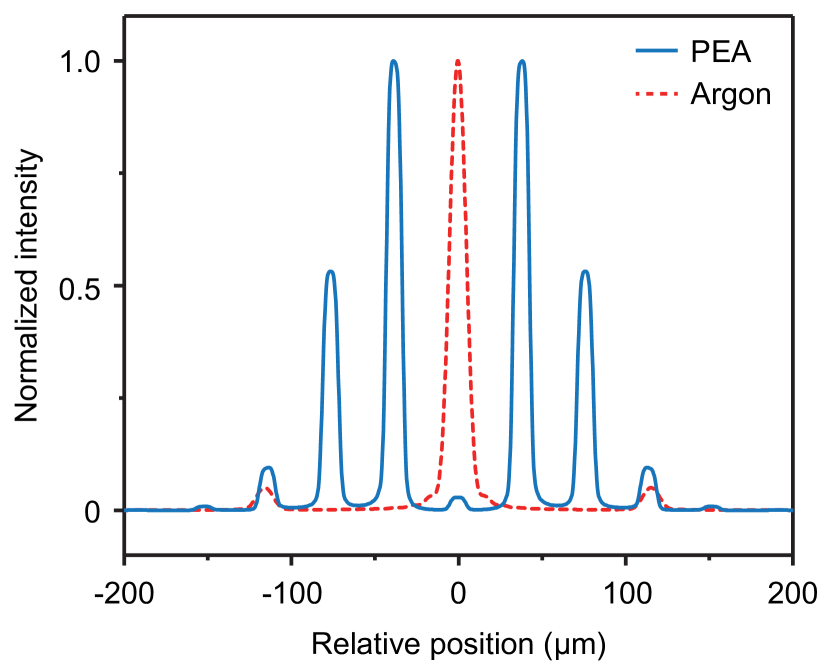
In Fig. 6 the diffraction patterns of PEA and Argon at a phase grating with period 266 nm are compared. As the spacing of the diffraction orders scales inversely with mass, the backing gas is diffracted to larger angles. Hence, the diffraction orders do not overlap, preventing the gas from reaching the detection area.
X.4 Suitable molecular systems
In Table 3-5 we list a number of molecules which can be addressed with the proposed selection method. It contains a set of systems systems which are of importance for several fields of physics and chemistry and is by no means exhaustive. The chosen particles molecules have sufficiently high vapor pressure and are light enough to be compatible with fast molecular beams. We have compiled all conformers even though not all of them might be isolated, either because their relative population is too small or they are spectrally overlapping with other conformers. This list can easily be extended to clusters with noble gas atoms, and small molecules like O2, N2, and CH4. Often these can be prepared in high abundance by co-expanding them with the desired molecule. As the clusters do not absorb a photon and remain in their electronic ground state during the diffraction, fragmentation can be neglected.
| Substance | Structure | Electronic origin (cm-1) | ||
|---|---|---|---|---|
| Neurotransmitter and hormones | ||||
| 2-Phenylethylamine |
![[Uncaptioned image]](/html/1710.01035/assets/PEA.png)
|
4 conformers Sipior et al. (1991); Dickinson et al. (1998) | 37 546 | |
| 37 558 | ||||
| 37 610 | ||||
| 37 636 | ||||
| (H2O)1-cluster Dickinson et al. (1998) | 37 630 | |||
| Serotonin |
![[Uncaptioned image]](/html/1710.01035/assets/Serotonin.png)
|
8 conformers LeGreve et al. (2007) | 32 282 | |
| 32 313 | ||||
| 32 353 | ||||
| 32 537 | ||||
| 32 545 | ||||
| 32 548 | ||||
| 32 560 | ||||
| 32 584 | ||||
| (H2O)1-cluster LeGreve et al. (2009) | 32 183 | |||
| 32 449 | ||||
| 32 666 | ||||
| Melatonin |
![[Uncaptioned image]](/html/1710.01035/assets/Melatonin.png)
|
5 conformers Florio et al. (2002) | 32 432 | |
| 32 483 | ||||
| 32 614 | ||||
| 32 621 | ||||
| 32 795 | ||||
| (H2O)1-cluster Florio and Zwier (2003) | 32 442 | |||
| 32 673 | ||||
| 32 842 | ||||
| 32 956 | ||||
| Tryptamine |
![[Uncaptioned image]](/html/1710.01035/assets/Tryptamine.png)
|
7 conformers Park et al. (1986); Carney and Zwier (2001); Nguyen et al. (2005) | 34 832 | |
| 34 868 | ||||
| 34 879 | ||||
| 34 880 | ||||
| 34 884 | ||||
| 34 896 | ||||
| 34 916 | ||||
| (H2O)1-cluster Sipior and Sulkes (1988) | 34 957 | |||
| Mexamin |
![[Uncaptioned image]](/html/1710.01035/assets/Mexamine.png)
|
3 conformers Vu et al. (2009) | 32 734 | |
| 32 764 | ||||
| 32 808 | ||||
| (H2O)1-cluster Vu et al. (2009) | 32 528 | |||
| Amphetamine |
![[Uncaptioned image]](/html/1710.01035/assets/Amphetamine.png)
|
3 conformers Brause et al. (2006) | 37 549 | |
| 37 558 | ||||
| 37 592 | ||||
| (H2O)1-cluster Brause et al. (2006); Yao et al. (2000) | 37 574 | |||
| 37 578 | ||||
| 37 617 | ||||
| Substance | Structure | Electronic origin (cm-1) | ||
| Protected amino acids | ||||
| N-acetyl phenylalanine |
![[Uncaptioned image]](/html/1710.01035/assets/AcPheNHMe.png)
|
3 conformers Gerhards et al. (2004) | 37 414 | |
| methyl amide | 37 518 | |||
| 37 593 | ||||
| N-acetyltryptophan |
![[Uncaptioned image]](/html/1710.01035/assets/NATMA.png)
|
3 conformers Dian et al. (2002) | 34 881 | |
| methyl amide | 34 913 | |||
| - | ||||
| N-acetyl tryptophan |
![[Uncaptioned image]](/html/1710.01035/assets/NATE.png)
|
4 conformers Park et al. (1986) | 34 694 | |
| ethyl ester | 34 832 | |||
| 34 855 | ||||
| 34 999 | ||||
| Tautomers | ||||
| 2-Hydroxypyridine |
![[Uncaptioned image]](/html/1710.01035/assets/2Hydroxypyridine.png)
|
2 tautomers Nimlos et al. (1989); Held and Pratt (1993) | 29 831 | |
| 36 136 | ||||
| (H2O)1-cluster Nimlos et al. (1989); Held and Pratt (1993) | 35 468 | |||
| Sugars | ||||
| Phenyl - |
![[Uncaptioned image]](/html/1710.01035/assets/Glucopyranoside.png)
|
3 conformers Talbot and Simons (2002) | 36 868 | |
| D-glucopyranoside | 36 903 | |||
| 36 906 | ||||
| (H2O)1-cluster Jockusch et al. (2003a) | 36 767 | |||
| 36 870 | ||||
| Phenyl - |
![[Uncaptioned image]](/html/1710.01035/assets/Galactopyranoside.png)
|
2 conformers Jockusch et al. (2003b) | 36 839 | |
| D-galactopyranoside | 36 854 | |||
| Aromatic radicals | ||||
| -Propyl benzyl |
![[Uncaptioned image]](/html/1710.01035/assets/Propylbenylradical.png)
|
2 conformers Korn et al. (2016) | 21 922111The electronic origin is not known. This wavenumber corresponds to a strong vibrational band from the IR-UV hole-burning spectrum. | |
| radical | 21 929 | |||
| Substance | Structure | Electronic origin (cm-1) | ||
| Aromatic hydrocarbons | ||||
| Propylbenzene |
![[Uncaptioned image]](/html/1710.01035/assets/Propylbenzene.png)
|
2 conformers A. Dickinson et al. (1997) | 37 533 | |
| 37 583 | ||||
| Butylbenzene |
![[Uncaptioned image]](/html/1710.01035/assets/Butylbenzene.png)
|
4 conformers A. Dickinson et al. (1997) | 37 514 | |
| 37 516 | ||||
| 37 573 | ||||
| 37 576 | ||||
| 4-phenyl-1-butene |
![[Uncaptioned image]](/html/1710.01035/assets/4-phenyl-1-butene.png)
|
3 conformers Sebree et al. (2010) | 37 525 | |
| 37 528 | ||||
| 37 580 | ||||
| 1,3-Diethylbenzene |
![[Uncaptioned image]](/html/1710.01035/assets/1,3-Diethylbenzene.png)
|
2 conformers Breen et al. (1987) | 37 134 | |
| 37 151 | ||||
| Meta-Ethnylstyrene |
![[Uncaptioned image]](/html/1710.01035/assets/Meta-Ethnylstyrene.png)
|
2 conformers Selby et al. (2005) | 32 672 | |
| 32 926 | ||||
| Size-selected water cluster | ||||
| Phenol(H2O)n |
![[Uncaptioned image]](/html/1710.01035/assets/Phenol-water.png)
|
n=1 Jacoby et al. (1998) | 35 996 | |
| n=3 Jacoby et al. (1998) | 36 258 | |||
| n=4 Jacoby et al. (1998) | 36 170 | |||
| n=5 Jacoby et al. (1998) | 36 297 | |||
| n=8 Roth et al. (1998) | 35 923 | |||