The gas and stellar mass of low-redshift damped Lyman- absorbers
Abstract
We report Hubble Space Telescope Cosmic Origins Spectrograph far-ultraviolet and Arecibo Telescope Hi 21cm spectroscopic studies of six damped and sub-damped Lyman- absorbers (DLAs and sub-DLAs, respectively) at , that have yielded estimates of their Hi column density, metallicity and atomic gas mass. This significantly increases the number of DLAs with gas mass estimates, allowing the first comparison between the gas masses of DLAs and local galaxies. Including three absorbers from the literature, we obtain Hi masses , lower than the knee of the local Hi mass function. This implies that massive galaxies do not dominate the absorption cross-section for low- DLAs. We use Sloan Digital Sky Survey photometry and spectroscopy to identify the likely hosts of four absorbers, obtaining low stellar masses, , in all cases, consistent with the hosts being dwarf galaxies. We obtain high Hi 21 cm or CO emission line widths, km s-1, and high gas fractions, , suggesting that the absorber hosts are gas-rich galaxies with low star formation efficiencies. However, the Hi 21 cm velocity spreads ( km s-1) appear systematically larger than the velocity spreads in typical dwarf galaxies.
keywords:
galaxies: evolution — galaxies: high-redshift — quasars: absorption lines1 Introduction
Absorption-selected galaxy samples, based on the presence of strong Lyman- absorption in quasar spectra, are not biased towards high-luminosity objects and hence provide a view of “normal” galaxies at high redshifts. The highest Hi column density () systems, the damped and sub-damped Lyman- absorbers (DLAs and sub-DLAs, respectively) have values similar to those in nearby gas-rich galaxies, and have hence been of much interest in studies of galaxy evolution (e.g. Wolfe et al., 2005).
Absorption spectroscopy has yielded much information on DLAs, including their metallicities (e.g. Prochaska et al., 2003; Rafelski et al., 2012), gas temperatures (e.g. Kanekar & Chengalur, 2003; Kanekar et al., 2014), and molecular fractions (e.g. Ledoux et al., 2003; Noterdaeme et al., 2008). However, despite many searches, the galaxy counterparts of only a dozen DLAs and sub-DLAs, mostly targetted due to an atypically high metallicity, have so far been detected in optical/ultraviolet emission at (e.g. Fynbo et al., 2011, 2013). Typical high- DLAs appear to have low in-situ star formation rates (SFRs), yr-1 (Fumagalli et al., 2015). The situation is somewhat better at low redshifts, , with estimates of the SFR, stellar mass, etc. available for absorbers (e.g. Péroux et al., 2012).
Our knowledge of the gas content of the absorbers is even worse than that of the stellar content. The radio Hi 21cm hyperfine and CO rotational transitions are the main probes of atomic and molecular gas in nearby galaxies. Unfortunately, few DLAs are known at low redshifts, , where the weak Hi 21cm line is detectable with today’s radio telescopes. Hi 21cm emission has hence only been detected in one DLA, at towards SBS 1543+593 (Bowen et al., 2001; Chengalur & Kanekar, 2002), and one sub-DLA, at towards PG 1216+069 (Briggs & Barnes, 2006; Chengalur et al., 2015), with a few non-detections yielding limits on the Hi mass (Mazumdar et al., 2014). In the case of molecular gas, there is so far only a single CO detection, at towards PKS 0439433 (Neeleman et al., 2016b). And, while the recent detection of Cii-158m emission in two DLAs (Neeleman et al., 2017) provides an exciting new tool to identify high- DLA host galaxies, this transition does not provide information on the gas content of the absorbers.
A detailed comparison between the stellar and gas properties of absorption-selected galaxies requires a large absorber sample at low redshifts, . The excellent far-ultraviolet (FUV) sensitivity of the Cosmic Origins Spectrograph (COS) onboard the Hubble Space Telescope (HST) now allows the detection of Lyman- absorption at very low redshifts. We have hence analysed the HST data archive (Neeleman et al., 2016a), to identify low- absorbers suitable for follow-up studies to characterize the host galaxies. We have now used the Arecibo Telescope to carry out a search for Hi 21cm emission from a set of low- absorbers identified in our survey. In this Letter, we present the values, metallicities, and atomic gas and stellar masses for six systems at .
| QSO | N(Oi) | N(Siii) | N(Sii) | N(Feii) | [M/H] | Ma | ||
|---|---|---|---|---|---|---|---|---|
| cm-2 | cm-2 | cm-2 | cm-2 | cm-2 | ||||
| J0930+2845 | [ , ]b | Sii, Siii | ||||||
| J0951+3307 | Sii | |||||||
| J1415+1634 | c | Oi | ||||||
| J1512+0128 | Siii | |||||||
| J1553+3548 | Siii | |||||||
| J1619+3342 | Sii |
aThe element used in the metallicity estimate of the previous column. bThe allowed metallicity range; see main text for discussion. cIonization corrections have not been included, but are expected to be small, dex (e.g. Battisti et al., 2012).
2 Observations, data analysis and spectra
2.1 The HST observations
The details of our analysis of the HST archival data on quasars observed with COS, the Space Telescope Imaging Spectrograph, or the Faint Object Spectrograph, are presented in Neeleman et al. (2016a). Standard pipelines were used to produce the final spectrum for each quasar. The search for Lyman- absorption followed the approach of Prochaska et al. (2005), with minor modifications (see Neeleman et al., 2016a). For each absorber, was estimated using a custom IDL Voigt-profile fitting program, simultaneously fitting both the Voigt profile and the quasar continuum. The metal column densities were derived using the apparent optical depth method (Savage & Sembach, 1991), and then used to infer the gas metallicity (Rafelski et al., 2012).
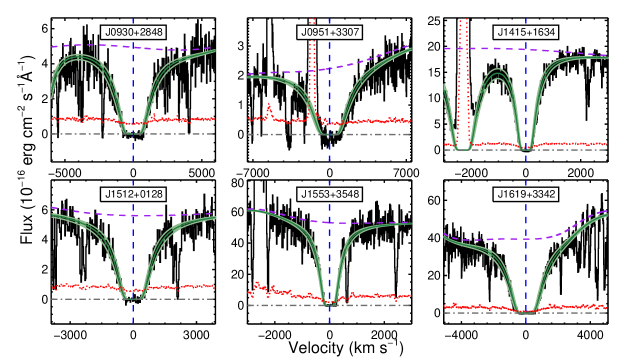
Our search yielded 15 DLAs and sub-DLAs at ; note that this is not an unbiased sample (see Section 4). We focus here on the six absorbers for which we were able to obtain Hi 21cm spectroscopy. Four systems are DLAs, with cm-2, and two are sub-DLAs, both with cm-2. Their Lyman- absorption profiles and the Voigt profile fits to estimate the Hi column density are shown in Fig. 1, and their redshifts, Hi and metal column densities, and metallicities are listed in Table 1.
2.2 The Arecibo observations
We used the Arecibo L-Band-wide receiver over April–July 2015 and May 2016 in proposal A2940 (PI: Kanekar) to search for redshifted Hi 21cm emission from 11 DLAs and sub-DLAs at , observable with the Arecibo Telescope (e.g. Meiring et al., 2011; Neeleman et al., 2016a). Observations of five targets were affected by radio frequency interference (RFI); it was not possible to obtain clean spectra for these systems, which will not be discussed further. Bandwidths of 6.25 MHz, 12.5 MHz, 25 MHz and 50 MHz were simultaneously used for the observations, centred at the expected redshifted Hi 21cm line frequency, and sub-divided into 2048 or 8192 channels, with the WAPP backend. Position switching (On/Off) was used for bandpass calibration, while the flux density scale was calibrated using a noise diode. The total on-source time was hours per source.
All the Arecibo data were analysed in IDL, using standard procedures. While the data on all six targets were relatively free of RFI, detailed flagging was necessary for the two systems at (towards J1553+3548 and J1619+3342) to obtain clean spectra. The root-mean-square (RMS) noise values on the final spectra range from mJy per 12.2 kHz channel.
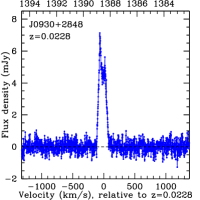
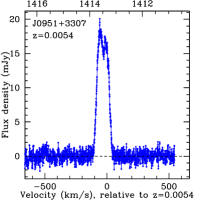
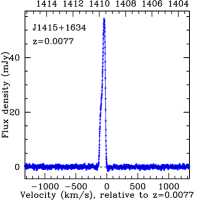
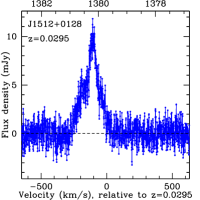
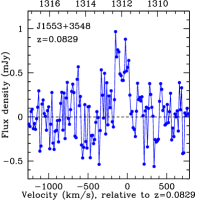
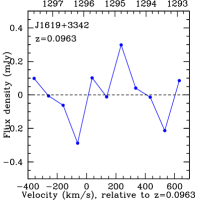
The final Hi 21cm spectra for the six DLAs and sub-DLAs are shown in Fig. 2, in order of increasing right ascension. We obtained five detections of Hi 21cm emission (with significance), out to . For four of the six systems, the spectra are presented after Hanning-smoothing to, and resampling at, a resolution of 12.2 kHz ( km s-1 at the respective line frequencies). For the fifth detection, at towards J1553+3548, we further boxcar-smoothed the spectrum by 5 channels; the spectrum of this source in Fig. 2 is at a resolution of kHz ( km s-1 at the redshifted Hi 21cm line frequency). Finally, in the case of the sole non-detection, for the DLA towards J1619+3342, the spectrum shown in Fig. 2 has been box-car smoothed to, and resampled at, a resolution of km s-1. Table 2 provides details of the results of the Hi 21cm observations.
3 Results
| QSO | [M/H] | M∗ | ∗ | a∗ | |||||
|---|---|---|---|---|---|---|---|---|---|
| cm-2 | Jy km s-1 | km s-1 | km s-1 | ||||||
| J0930+2845 | [ , ] | ||||||||
| J0951+3307 | |||||||||
| J1415+1634 | |||||||||
| J1512+0128 | |||||||||
| J1553+3548 | |||||||||
| J1619+3342 | |||||||||
| Measurements from the literature | |||||||||
| PG 1216+069 | |||||||||
| SBS 1543+543 | |||||||||
| PKS 0439433 | |||||||||
∗The quoted errors are the sums in quadrature of the measurement errors and % systematic errors on the flux density scale.
aThe Hi masses assume a -cold-dark-matter cosmology, with km s-1 Mpc-1, , and (Ade et al., 2016).
b is the velocity width between 20% points of the peak Hi 21cm flux density.
c is the velocity width containing 90% of the equivalent width of the low-ionization metal absorption lines.
dThe gas fraction, , is defined here as the ratio of the Hi mass to the stellar mass (Huang et al., 2012).
eThese are limits on the integrated Hi 21cm line flux density and the Hi mass, assuming a Gaussian line profile with an FWHM of km s-1.
References for literature absorbers: fMetallicity: Dutta et al. (2015), Tripp et al. (2005), Bowen et al. (2005); gStellar mass: Christensen et al. (2014), Rosenberg et al. (2006); hHi 21cm data: Bowen et al. (2001), Kanekar et al. (2001), Chengalur et al. (2015).
iThe value of for the sub-DLA towards PKS 0439433 is for the CO J=1-0 line (Neeleman et al., 2016b).
J0930+2845 : The DLA towards J0930+2845 has cm-2. Unfortunately, most of the metal lines covered by the HST-COS spectrum for this DLA are either saturated or not detected: we obtain log[N(Siii)/cm-2], log[N(Oi)/cm-2] , and log[N(Sii)/cm-2] . Combining the Siii lower limit and the Sii upper limit yields the metallicity range [M/H] . The Hi mass of the galaxy is , while the velocity spread between 20% points is km s-1 (see also Haynes et al., 2011). No spectroscopically confirmed galaxy is known at or near the DLA redshift. The nearest galaxy, located at RA=142.50583∘, Dec=28.81740∘ (at an impact parameter of , i.e. kpc, to the quasar line-of-sight) is clearly detected in Sloan Digital Sky Survey (SDSS) images, with a photometric redshift of (Brescia et al., 2014), consistent with the DLA redshift. Applying the kcorrect software (Blanton & Roweis, 2007) to the SDSS photometry of this galaxy yields a stellar mass of .
J0951+3307 : The DLA towards J0951+3307 has cm-2, the highest of our sample. The Arecibo Hi spectrum yields a low Hi mass for this DLA, , consistent with a dwarf galaxy. However, the Hi 21cm line is quite wide, with km s-1. We measure log[N(Sii)/cm-2] , implying [M/H] . A well-known galaxy, UGC 5282 (at and at an impact parameter of , i.e. kpc), is the likely DLA host; this has been earlier detected in Hi 21cm emission by Schneider et al. (1990), with an integrated Hi 21cm line flux density of Jy km s-1, consistent within the errors with our estimate of Jy km s-1. Ann et al. (2015) used the SDSS photometry of UGC 5282 to infer a stellar mass of , after correcting for the spatial extent of the galaxy. We obtain a gas-to-stars ratio of , not atypical for dwarf galaxies (e.g. Begum et al., 2008).
J1415+1634 : The sub-DLA towards J1415+1634 has cm-2. The Arecibo Hi 21cm spectrum yields an Hi mass of , with km s-1. We obtain log[N(Oi)/cm-2] from the HST-COS spectrum, yielding [M/H] . This is a lower limit to [M/H], as ionization corrections may be significant for this sub-DLA. The host galaxy is likely to be UGC 9126 (at ), at an impact parameter of , i.e. kpc, to the quasar sightline. Wong et al. (2006) estimate its integrated Hi 21cm line flux density to be Jy km s-1, times larger than our estimate for the absorber host. This is likely to be due to the relatively large impact parameter; note that the Arecibo primary beam has an FWHM of . Finally, the stellar mass of UGC 9126 has been estimated to be quite low, by Chang et al. (2015), via a fit to its optical and mid-infrared spectral energy distribution. With , the host of the sub-DLA appears to be an extremely gas-rich galaxy.
J1512+0128 : We obtain cm-2 for the DLA towards J1512+0128, and , the highest in our sample. The Hi 21cm velocity spread is km s-1, consistent with that expected from a massive galaxy. We derive a metallicity of [M/H] from the Siii line detected in the HST-COS spectrum. The absorber appears to be part of a galaxy group: six SDSS galaxies are present within of the quasar line-of-sight and with redshifts within of the absorber redshift. The nearest identified galaxies with confirmed spectroscopic redshifts are part of a triple system (UZC-CG 236), with an impact parameter of (i.e. kpc) to the quasar line-of-sight. However, it is possible that the absorber might arise in a fainter galaxy with a lower impact parameter.
J1553+3548 : This system is also a sub-DLA, with cm-2. We obtain and km s-1 from the Hi 21cm spectrum. The Siii line detected in the HST-COS spectrum yields [M/H] , before ionization corrections. Battisti et al. (2012) estimate the correction for this ion to lie in the range ; this would imply [M/H] . We also detect Cii*1335 absorption in this absorber, yielding log[N(Cii*)/cm-2]=. A galaxy at low impact parameter () is seen in the SDSS imaging. We used the Low Resolution Imaging Spectrograph on the Keck telescope to obtain a spectrum of this galaxy (which will be discussed elsewhere) and measured from the H and H lines, indicating that this object is likely to be the DLA host. We infer a stellar mass of , applying kcorrect to the SDSS photometry of the galaxy.
J1619+3342 : We were unable to detect Hi 21cm emission from the DLA towards J1619+3342, obtaining the upper limit . We obtain cm-2 from the HST-COS spectrum, and a metallicity of [M/H]= from the Sii line (see also Meiring et al., 2011; Battisti et al., 2012). There are no galaxies at the DLA redshift in the SDSS spectroscopic catalog and no obvious candidate hosts close to the quasar line-of-sight. This system, the only absorber of our sample that does not have an Hi 21cm emission detection, also has no candidate optical counterpart, suggesting that it is likely to be an optically faint, low-mass galaxy.
4 Discussion and Summary
We emphasize at the outset that our six absorbers are not an unbiased sample: J0951+3307 and J1415+1634 were targeted with the HST due to the presence of a low-mass, gas-rich galaxy within 15 kpc of the quasar sightline, while J1512+0128 is part of the GASS sample (Borthakur et al., 2015). Caution must hence be taken when extending our results to general DLA samples.
Our observations have yielded Hi masses or Hi mass limits for six new DLAs and sub-DLAs. There are now nine such absorbers with estimates of the atomic gas mass (see Table 2). Five systems are DLAs, with cm-2, while four are sub-DLAs, with cm-2. Table 2 also lists the derived values, metallicities, stellar masses, the Hi 21cm (or CO) velocity spread between 20% points (), the velocity spread of low-ionization metal absorption lines (), and the gas fraction of the above nine systems.
The Hi masses of the nine absorbers of our sample lie in the range , significantly lower, in all cases, than the knee of the local Hi mass function (M*; e.g. Martin et al., 2010). This is consistent with expectations for the relatively low Hi column densities of most of the nine absorbers (e.g. Zwaan et al., 2005). While the low Hi mass of the high- ( cm-2) DLA towards J0951+3307 may appear surprising, this sightline was selected for the presence of a low-mass, gas-rich dwarf close to the quasar sightline. Overall, it appears that massive galaxies do not dominate the cross-section for damped or sub-damped absorption at low redshifts (see also Zwaan et al., 2005).
While the angular resolutions of our Arecibo data (, i.e. kpc at the absorber redshift) are too coarse to allow a direct identification of the absorber host galaxies, we have used SDSS spectroscopy and photometry to identify candidate host galaxies for five of our six absorbers, and to estimate the stellar mass for four systems. Including systems from the literature, five of the six absorbers with stellar mass estimates have very low stellar masses () and high gas fractions (), amongst the highest gas fractions of galaxies in the local Universe (e.g. Huang et al., 2012). Only two of these systems were targetted due to their gas richness. Further, even the sixth absorber (at towards PKS0439433) has a high H2 mass, M (Neeleman et al., 2016b), yielding a gas fraction (including molecular gas) of , quite high for late-type disk galaxies. The metallicities of most absorbers are relatively low, with seven of the nine systems having [M/H] ; this is surprising for objects in the nearby Universe (although consistent with metallicity evolution in DLAs; Rafelski et al., 2012). Most of the absorbers of the sample thus appear to arise in gas-rich galaxies, with low star formation activity. However, the Hi 21cm velocity spreads are too large to be explained by an origin in individual dwarf galaxies. It is possible that the large velocity widths arise from Hi 21cm emission from multiple faint galaxies in the relatively large Arecibo beam; we are now investigating this with interferometric Hi 21cm studies.
In conclusion, we have used a combination of HST-COS FUV spectroscopy, Arecibo Hi 21cm emission spectroscopy and SDSS photometry to estimate or constrain the Hi column density, the metallicity, the atomic gas mass, and the stellar mass for a sample of six DLAs and sub-DLAs at . We obtain Hi masses , stellar masses , low metallicities, solar, and high gas fractions, (amongst the highest in the nearby Universe), for the absorbers of our sample. The large velocity spreads of the Hi 21cm and CO emission lines ( km s-1), the high gas fractions (), and the low metallicities and stellar masses suggest that the absorbers are gas-rich galaxies with a low star formation efficiency.
Acknowledgments
It is a pleasure to thank Chris Salter and Phil Perrilat for much help with the Arecibo observations. NK acknowledges support from the Department of Science and Technology via a Swarnajayanti Fellowship (DST/SJF/PSA-01/2012-13). The Arecibo Observatory is operated by SRI International under a cooperative agreement with the National Science Foundation (AST-1100968), and in alliance with Ana G. Méndez-Universidad Metropolitana, and the Universities Space Research Association.
References
- Ade et al. (2016) Ade, P. A. R., et al. 2016, A&A, 594, A13
- Ann et al. (2015) Ann, H. B., Seo, M., & Ha, D. K. 2015, ApJS, 217, 27
- Battisti et al. (2012) Battisti, A. J. et al. 2012, ApJ, 744, 93
- Begum et al. (2008) Begum, A., Chengalur, J. N., Karachentsev, I. D., Sharina, M. E., & Kaisin, S. S. 2008, MNRAS, 386, 1667
- Blanton & Roweis (2007) Blanton, M. R. & Roweis, S. 2007, AJ, 133, 734
- Borthakur et al. (2015) Borthakur, S. et al. 2015, ApJ, 813, 46
- Bowen et al. (2001) Bowen, D. V., Huchtmeier, W., Brinks, E., Tripp, T. M., & Jenkins, E. B. 2001, A&A, 372, 820
- Bowen et al. (2005) Bowen, D. V., Jenkins, E. B., Pettini, M., & Tripp, T. M. 2005, ApJ, 635, 880
- Brescia et al. (2014) Brescia, M., Cavuoti, S., Longo, G., & De Stefano, V. 2014, A&A, 568, A126
- Briggs & Barnes (2006) Briggs, F. H. & Barnes, D. G. 2006, ApJ, 640, L127
- Chang et al. (2015) Chang, Y.-Y., van der Wel, A., da Cunha, E., & Rix, H.-W. 2015, ApJS, 219, 8
- Chengalur et al. (2015) Chengalur, J. N., Ghosh, T., Salter, C. J., Kanekar, N., Momjian, E., Keeney, B. A., & Stocke, J. T. 2015, MNRAS, 453, 3135
- Chengalur & Kanekar (2002) Chengalur, J. N. & Kanekar, N. 2002, A&A, 388, 383
- Christensen et al. (2014) Christensen, L., Møller, P., Fynbo, J. P. U., & Zafar, T. 2014, MNRAS, 445, 225
- Dutta et al. (2015) Dutta, R., Srianand, R., Muzahid, S., Gupta, N., Momjian, E., & Charlton, J. 2015, MNRAS, 448, 3718
- Fumagalli et al. (2015) Fumagalli, M., O’Meara, J. M., Prochaska, J. X., Rafelski, M., & Kanekar, N. 2015, MNRAS, 444, 1282
- Fynbo et al. (2013) Fynbo, J. P. U. et al. 2013, MNRAS, 436, 361
- Fynbo et al. (2011) Fynbo, J. P. U. et al. 2011, MNRAS, 413, 2481
- Haynes et al. (2011) Haynes, M. P., et al. 2011, AJ, 142, 170
- Huang et al. (2012) Huang, S., Haynes, M. P., Giovanelli, R., & Brinchmann, J. 2012, ApJ, 756, 113
- Kanekar & Chengalur (2003) Kanekar, N. & Chengalur, J. N. 2003, A&A, 399, 857
- Kanekar et al. (2001) Kanekar, N., Chengalur, J. N., Subrahmanyan, R., & Petitjean, P. 2001, A&A, 367, 46
- Kanekar et al. (2014) Kanekar, N. et al. 2014, MNRAS, 438, 2131
- Ledoux et al. (2003) Ledoux, C., Petitjean, P., & Srianand, R. 2003, MNRAS, 346, 209
- Martin et al. (2010) Martin, A. M., Papastergis, E., Giovanelli, R., Haynes, M. P., Springob, C. M., & Stierwalt, S. 2010, ApJ, 723, 1359
- Mazumdar et al. (2014) Mazumdar, P., Kanekar, N., & Prochaska, J. X. 2014, MNRAS, 443, L29
- Meiring et al. (2011) Meiring, J. D. et al. 2011, ApJ, 732, 35
- Neeleman et al. (2016a) Neeleman, M., Prochaska, J. X., Ribaudo, J., Lehner, N., Howk, J. C., Rafelski, M., & Kanekar, N. 2016a, ApJ, 818, 113
- Neeleman et al. (2016b) Neeleman, M. et al. 2016b, ApJL, 820, L39
- Neeleman et al. (2017) Neeleman, M., Kanekar, N., Prochaska, J. X., Rafelski, M., Carilli, C. L., & Wolfe, A. M. 2017, Science, 355, 1285
- Noterdaeme et al. (2008) Noterdaeme, P., Ledoux, C., Petitjean, P., & Srianand, R. 2008, A&A, 481, 327
- Péroux et al. (2012) Péroux, C., Bouché, N., Kulkarni, V. P., York, D. G., & Vladilo, G. 2012, MNRAS, 419, 3060
- Prochaska et al. (2003) Prochaska, J. X., Gawiser, E., Wolfe, A. M., Castro, S., & Djorgovski, S. G. 2003, ApJ, 595, L9
- Prochaska et al. (2005) Prochaska, J. X., Herbert-Fort, S., & Wolfe, A. M. 2005, ApJ, 635, 123
- Rafelski et al. (2012) Rafelski, M., Wolfe, A. M., Prochaska, J. X., Neeleman, M., & Mendez, A. J. 2012, ApJ, 755, 89
- Rosenberg et al. (2006) Rosenberg, J. L., Bowen, D. V., Tripp, T. M., & Brinks, E. 2006, AJ, 132, 478
- Savage & Sembach (1991) Savage, B. D. & Sembach, K. R. 1991, ApJ, 379, 245
- Schneider et al. (1990) Schneider, S. E., Thuan, T. X., Magri, C., & Wadiak, J. E. 1990, ApJS, 72, 245
- Tripp et al. (2005) Tripp, T. M., Jenkins, E. B., Bowen, D. V., Prochaska, J. X., Aracil, B., & Ganguly, R. 2005, ApJ, 619, 714
- Wolfe et al. (2005) Wolfe, A. M., Gawiser, E., & Prochaska, J. X. 2005, ARA&A, 43, 861
- Wong et al. (2006) Wong, O. I., Ryan-Weber, E. V., Garcia-Appadoo, D. A., & et al. 2006, MNRAS, 371, 1855
- Zwaan et al. (2005) Zwaan, M. A., van der Hulst, J. M., Briggs, F. H., Verheijen, M. A. W., & Ryan-Weber, E. V. 2005, MNRAS, 364, 1467