Signatures of low-energy fractionalized excitations in -RuCl3
from field-dependent microwave absorption
Abstract
Topologically ordered states of matter are generically characterized by excitations with quantum number fractionalization. A prime example is the spin liquid realized in Kitaev’s honeycomb-lattice compass model where spin-flip excitations fractionalize into Majorana fermions and Ising gauge fluxes. While numerous compounds have been proposed to be proximate to such a spin-liquid phase, clear-cut evidence for fractionalized excitations is lacking. Here we employ microwave absorption measurements to study the low-energy excitations in -RuCl3 over a wide range of frequencies, magnetic fields, and temperatures, covering in particular the vicinity of the field-driven quantum phase transition where long-range magnetic order disappears. In addition to conventional gapped magnon modes we find a highly unusual broad continuum characteristic of fractionalization which – most remarkably - extends to energies below the lowest sharp mode and to temperatures significantly higher than the ordering temperature, and develops a gap of a nontrivial origin in strong magnetic fields. Our results unravel the signatures of fractionalized excitations in -RuCl3 and pave the way to a more complete understanding of the Kitaev spin liquid and its instabilities.
I Introduction
Spin liquids – low-temperature states of local-moment insulators devoid of symmetry-breaking long-range order – constitute a class of most fascinating states of matter. They are characterized by topological order and fractionalization, i.e., local excitations decay into fractionalized constituents, which typically leads to continua instead of sharp modes in the dynamic response of the material. The seminal work of Kitaev Kitaev (2006) has introduced a particular spin-liquid model, with compass interactions on the honeycomb lattice, whose fractionalized excitations are dispersive Majorana fermions and static Ising gauge fluxes (visons). Subsequently, it has been proposed that this model may be approximately realized in certain Mott insulators with strong spin-orbit coupling Jackeli and Khaliullin (2009); Chaloupka et al. (2010). Candidate materials Winter et al. (2017) are Na2IrO3, different polytypes of Li2IrO3, and -RuCl3. While these materials display long-range magnetic order below a small Néel temperature , likely due to the presence of additional interactions, it is believed that they are proximate to a Kitaev spin-liquid phase. As a result, signatures of Kitaev physics are expected in various physical probes including the excitation spectrum, and pressure or magnetic field might even stabilize a spin-liquid ground state.
In -RuCl3 Plumb et al. (2014); Sears et al. (2015), currently considered the most promising Kitaev material, unconventional behavior has been reported in a number of experimental probes. Antiferromagnetic order which occurs in single crystalline samples of -RuCl3 without stacking faults at in a range 7 -8 K can be completely suppressed by application of a moderate in-plane magnetic field T (see, e.g., Sears et al. (2015, 2017); Banerjee et al. (2018); Wolter et al. (2017); Hentrich et al. (2018); Kasahara et al. (2018a)). Remarkably, recent inelastic neutron scattering (INS) experiments Banerjee et al. (2017) have revealed an unusually broad magnetic response near the Brillouin-zone center, , which persists up to temperatures of 100 K, the energy scale of the estimated Kitaev coupling in -RuCl3 Sandilands et al. (2015); Nasu et al. (2016); Banerjee et al. (2016). This elevated-energy response apparently unrelated to magnetic order may thus be consistent Banerjee et al. (2017) with continuum scattering off Majorana excitations inherent in the Kitaev spin liquid Knolle et al. (2014); Song et al. (2016). The emergence of the Majorana fermions in -RuCl3 was further suggested by a combined specific heat and INS study in Ref. Do et al. (2017). In addition, sharper spin-wave-like excitations at with an apparent gap meV at zero magnetic field have been found below . The existence of these magnon modes has been confirmed by other experimental techniques Little et al. (2017); Wang et al. (2017); Ponomaryov et al. (2017) and the low-temperature study of their field dependence has revealed that still has a sizable minimum value of meV at the critical field T Little et al. (2017); Wang et al. (2017); Ponomaryov et al. (2017).
To clarify the nature of the excitation spectrum of -RuCl3 we have measured the microwave absorption (MWA) of high-quality single crystals in the
temperature range K as function of the magnetic field up to T, employing a high-field/high-frequency electron spin resonance (ESR)
setup where the signal loss is proportional to the imaginary part of the dynamic spin susceptibility at the chosen
excitation frequency and wavevector . Working with fixed selected
frequencies, we covered the range of GHz ( meV). We note that energies below meV were inaccessible in the
INS study in Ref. Banerjee et al. (2017) (1.0 meV in Ref. Banerjee et al. (2018)) due to the presence of the elastic peak at .
Also, to our knowledge, the magnetic field dependence of the dynamic response at in this important energy range was not addressed so far (cf. Refs. Little et al. (2017); Wang et al. (2017); Ponomaryov et al. (2017); Shi et al. (2018); Reschke et al. (2018); Wu et al. (2018)). Besides the sharp resonant modes at reported earlier Little et al. (2017); Wang et al. (2017); Ponomaryov et al. (2017), we observe non-resonant, magnetic field dependent absorption, which is particularly strong for energies between and GHz
( meV), i.e., below the apparent magnon gap, which persists up to temperatures significantly larger than , and develops a gap of a nontrivial origin in magnetic fields exceeding 7 T. This novel finding
provides evidence for an excitation continuum extending down to low energies of the order
meV, likely arising from fractionalization.
II Experimental details
II.1 Crystal synthesis and characterization
Single crystals used in this study have been grown at TU Dresden. For the synthesis, pure ruthenium-metal powder (99.98 %, Alfa Aesar) was filled into a quartz ampoule under argon atmosphere, together with a sealed silica capillary containing chlorine gas (99.5 %, Riedel-de Haën). The chlorine gas was dried prior to use by passing through concentrated H2SO4 and CaCl2, the ruthenium powder used was without further purification. The molar ratio of the starting materials was chosen to ensure in-situ formation of RuCl3 and its consequent chemical transport according to the reaction: RuCl3(s) + Cl2 = RuCl4(g) Binnewies et al. (2012). After sealing the reaction ampoule under vacuum, the chlorine-containing capillary inside was broken in order to release the gas. The ampoule was kept in the temperature gradient between 750 ∘C (source) and 650 ∘C (sink) for 5 days. The obtained crystalline product represented pure -RuCl3 (according to powder X-ray diffraction) without inclusions of ruthenium. Single-crystal X-ray diffraction studies (Apex II diffractometer, Bruker-AXS, Mo K - radiation) and EDXS (Hitachi SU 8020 SEM, 20 kV with an Oxford Silicon drift detector XMaxN) of the crystals have confirmed a monoclinic structure Johnson et al. (2015) and the nominal composition. The crystals are black with a shiny surface, of a size of several millimeters along the ab-plane, and of a thickness about 0.2 mm [Fig. S3, right panel, in Supplemental Material (SM) Sup ]. MWA measurements were performed on three samples from the same batch. They all show a similar AFM ordering temperature K which has been determined through magnetization measurements with a vibrating sample magnetometer (Quantum Design) with superconducting quantum interference device detection (SQUID-VSM).
II.2 Microwave absorption measurements
For measurements of MWA a home made high-frequency/high-field ESR (HF-ESR) spectrometer was employed. A vector network analyzer (PNA-X from Keysight Technologies) was used for generation and detection of microwaves in the frequency range from 70 GHz to 330 GHz. In addition, an amplifier/multiplier chain (AMC from Virginia Diodes Inc.) allowed for measurements with frequencies up to 480 GHz, detected using a hot electron InSb bolometer (QMC Instruments). The probe-head with the sample was mounted in the variable temperature insert of the superconducting magnet system (Oxford Instruments) enabling field sweeps up to 16 T. Measurements up to 660 GHz were performed using a vector network analyser from ABmillimetre and a 14 T magnet from Cryogenic Limited. Measurements were carried out in transmission mode using a Faraday configuration, i.e. with the -vector of the microwaves oriented parallel to the direction of the external magnetic field, which in turn was parallel to the sample ab-plane. MWA spectra at each temperature were recorded at fixed selected frequencies (see SM Sup and related Refs. Eilers et al. (1994); Kullmann et al. (1984); Brunel et al. (2002); Sosin et al. (2008) for further technical details of the MWA measurements).
III Results
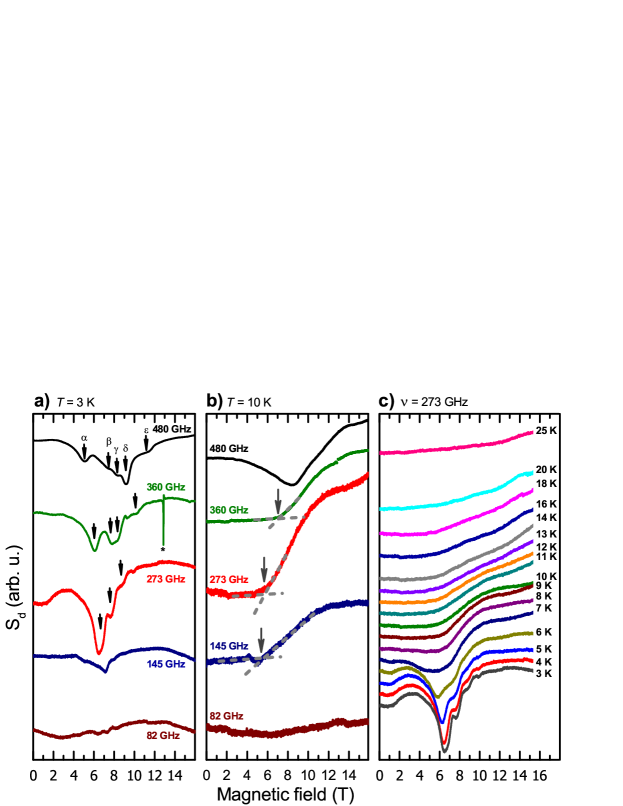
Characteristic MWA spectra (signal at the detector () as a function of field at a given constant ) for -plane are summarized in Fig. 1. Here, a smaller value of corresponds to a larger absorption of microwaves by the sample and vice versa. Fig. 1(a) shows the frequency dependence of the MWA signal at 3 K. At a high frequency of 480 GHz one observes a set of lines labeled and which shift by lowering to 360 GHz indicating their resonant nature. These lines are present only at K. Their position and the -dependence is in agreement with observations interpreted in terms of resonant magnon modes at reported in Refs. Wang et al. (2017); Ponomaryov et al. (2017) (see also Fig. S4(a) in SM Sup ). Remarkably, by approaching the minimum excitation gap GHz for these resonance modes reported in Refs. Little et al. (2017); Wang et al. (2017); Ponomaryov et al. (2017), the spectrum evolves into a pronounced maximum of MWA centered at T with some residual smeared structure. This response does not shift upon change of frequency within experimental uncertainties, which suggests a non-resonant nature of the absorption spectrum (see also Figs. S1 and S4 in SM Sup ).
The strong peak in the MWA spectrum in the range T starts to develop at temperatures right below K
[Fig. 1(c)]. Above , the spectra at GHz become flat for magnetic fields below T
showing no field dependence of MWA [Figs. 1(b) and (c)]. Only in the vicinity of and at GHz the
MWA signal still exhibits a broad bump due to strongly broadened, rapidly decaying resonance modes and
[cf. top curves in Figs. 1(a) and (b)]. A remarkable novel feature of the MWA spectrum at and GHz is the occurrence of an inflection point in the dependence marked by arrows in Fig. 1(b) which shifts
only slightly with changing the frequency. Above this point begins to increase indicating a decrease of the MWA by the sample. Importantly, all
non-resonant MWA features are most prominent in the frequency window GHz. In particular, they rapidly decrease at GHz and finally vanish below GHz [see Fig. 1(a,b) and the maps of the microwave absorption
plotted for different excitation frequencies in Fig. S5 in SM Sup ].
We note that the major features of the magnetic response discussed above are specific for the -plane geometry and were not observed for the -axis orientation, similar to, e.g., Ref. Majumder et al. (2015), where the change of magnetic properties upon variation of the magnetic field in the -axis field geometry became much milder.
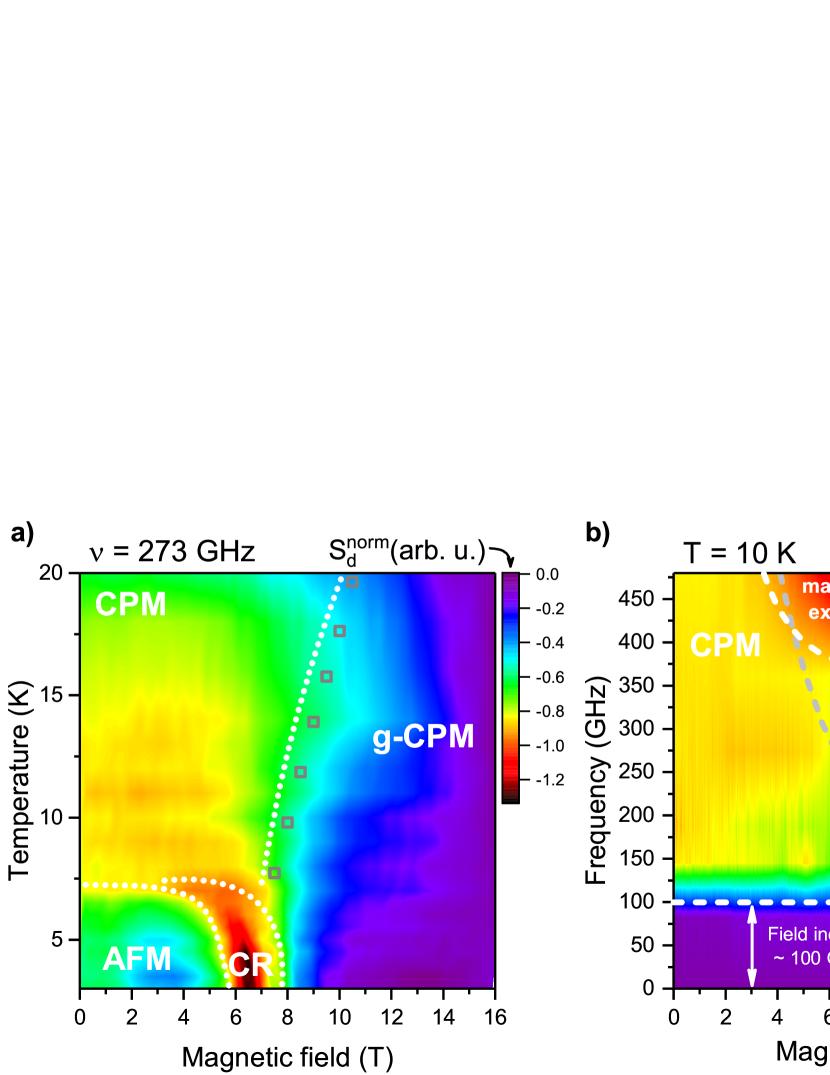
The contour plots presented in Fig. 2(a) were obtained from recorded spectra by first subtracting the value at a field of 15.5 T, and afterwards by subtracting the spectrum measured at 30 K from the spectra measured at other temperatures. To obtain the contour plots shown in Fig. 2(b), the respective value was subtracted from all the spectra, similar to the procedure described above. Since at different microwave frequencies the sensitivity of the spectrometer may vary, and also since for this kind of measurements several experimental setups were employed, the following normalization of the data was applied for plotting Fig. 2(b): The spectra, except the one at GHz, were divided by a respective difference value . To normalize the flat signal at GHz the value from the measurement at a next higher frequency GHz was used. In both figures the gradual change of the color from ”cold” violet to ”warmer” colors such as yellow and red corresponds to an increase of the absorption in the sample. However, due to a different data treatment the scales in Figs. 2(a) and (b) are not quantitatively comparable.
IV Discussion
Given that the MWA technique probes the field dependence of the imaginary part of the dynamic spin susceptibility Kubo and Tomita (1954), a strong MWA peak developing below around the critical field T can be related to the enhanced density of the spin fluctuations in -RuCl3 at the vicinity of the field-induced phase transition from the AFM-ordered to a non-ordered state at higher fields. At , the decrease of the MWA at higher fields ([Figs. 1(b),(c)] implies thus a depletion of the spin excitations probed by microwaves, i.e., a field-induced gapped behavior of which is visible in the spectra up to K.
The MWA data can be used to construct a schematic phase diagram of -RuCl3 which is drawn by lines in Fig. 2 together with the representative color-coded maps of the spectra. Fig. 2(a) depicts the parameter space where the maps are plotted for a representative frequency GHz (see also Fig. S5 in SM Sup ), and Fig. 2(b) presents the cut of the MWA spectra at a temperature K K. We note that, with the present setup, the absorption cannot be measured on an absolute scale. Also a comparison of their values measured at different and is prone to a number of instrumental uncertainties. Therefore, to facilitate the pictorial presentation of the data, we plot in Fig. 2 the normalized spectra, as explained in Sect. III, so that the maps in panels (a) and (b) reflect field-induced changes in the temperature and frequency dependence of MWA.
Keeping in mind the presence of the Néel transition at K at T and the sizeable spin gap K Baek et al. (2017); Hentrich et al. (2018) existing at T, four distinct regimes enclosed by dotted lines (AFM, CR, CPM and g-CPM) with characteristic MWA properties can be identified. Given that the probing frequencies GHz ( meV) considered for the phase diagram in Fig. 2 are smaller than the spin-wave energies probed by INS at (2.7 meV at 0 T Banerjee et al. (2017) and 3.4 meV at 8 T Banerjee et al. (2018)), the observed non-resonant effects should be related to the coupling of microwaves to spin excitations other than magnons. Such a field-dependent MWA below the spin-wave gap energy, which, as can be seen in Fig. 2(b), is most importantly present also above is unexpected for a conventional antiferromagnet. The non-resonant character of the MWA suggests a continuous energy spectrum of the probed excitations, typical for spin fractionalization fra . The vanishing of the field-dependent microwave response below GHz implies a characteristic minimum energy of meV (100 GHz) for this continuum [Fig. 2(b)]. Interestingly, a remarkably similar drop-off in the optical conductivity below meV (242 GHz), well defined even at meV was reported in Ref. Little et al. (2017). Such similarity supports the conjecture made there that at energies well below the range of expected optical transitions is related to the spin degree of freedom in -RuCl3. Remarkably, a recent theory on the electromagnetic absorption of materials described by the Kitaev model predicts that – similarly to the previously discussed special case of some Mott insulators (see, e.g., Refs. Bulaevskii et al. (2008); Potter et al. (2013)) – the fractionalized magnetic excitations may respond to the external ac electric field as well Bolens et al. (2018). Within this exotic scenario, the MWA continuum observed in our experiments may manifest a coupling of both electrical and magnetic components of the sub-THz electromagnetic radiation to the fractionalized spin excitations in -RuCl3 that develop a field induced spin gap.
We note that the MWA continuum is unlikely to be explained by a coupling of one-magnon and two-magnon states in the ordered phase. First, the field-dependent MWA is observed also at temperatures significantly larger than and, second, at energies below the spin-wave gap at wavevector (i.e. at the -point of the Brillouin zone). Second-order effects which might yield sub-gap spin excitations at the -point, e.g., due to the softening of the spin waves at the AFM-ordering wavevector at the -point, appear unlikely as they would result in small-intensity features only. This conclusion is consistent with recent theory works Winter et al. (2017, 2018).
At low temperatures the detected signal exhibits an enhanced absorption of the microwaves by the sample by approaching the critical field T for the suppression of the AFM order. This evidences a boosted density of spin fluctuations in the critical region (CR) around this field where the spin-wave gap reduces to meV [Fig. 2(b)]. On this strong background it is difficult to discern a weaker response due to the interaction of microwaves with the continuum [see Fig. S4(b) in SM Sup ]. In the ”high”-temperature regime at low fields the interaction of microwaves with the continuum of spin excitations does not reveal a measurable field dependence, possibly due to the thermal broadening of the gap, while the continuum itself, according to INS Banerjee et al. (2017), still persists up to much higher energies and temperatures. This part of the parameter space is denoted as correlated paramagnet (CPM) in Fig. 2. At higher fields the MWA reduces with increasing field suggesting a depletion of the density of fractionalized excitations. This region is denoted as a gapped phase of CPM (g-CPM). The inflection point in the MWA signal [Fig. 1(b)], which denotes the onset of the field dependence of the microwave absorption with increasing the field strength above T, approximately demarcates in the phase diagram in Fig. 2(a) the CPM regime at smaller fields and the g-CPM phase at larger fields.
A precise quantitative determination of the gap size from MWA measurements alone is difficult because of the combined dependence on frequency and temperature. Despite this difficulty, on the more qualitative level, our data directly show that the energy scale of the field-induced gap corresponds to the temperature range where the depletion of the microwave absorption sets in. It approximately follows the dotted line in Fig. 2(a) which separates the CPM and g-CPM regimes in -RuCl3. This is consistent with the energy scale of the field-induced spin gap observed in the NMR relaxation rates Baek et al. (2017); Janša et al. (2018) and thermal conductivity Hentrich et al. (2018) measurements [open squares in Fig. 2(a)], whereas specific heat data reveal somewhat smaller gap values Sears et al. (2017); Wolter et al. (2017). Note that alternatively, a power law behavior of the NMR relaxation rate was observed in Ref. Zheng et al. (2017).
V Conclusions
In summary, our field-dependent MWA study reveals a highly unusual excitation continuum in -RuCl3 at the wavevector at low
energies between 0.4 and meV, i.e., below the energy of the lowest reported magnon-like mode
[Fig. 2(b)] and extending to temperatures in a broad field region up to 16 T
[Fig. 2(a)]. The continuum seen by MWA gets progressively gapped above , in line with observations of a
field-induced spin gap in Refs. Baek et al. (2017); Sears et al. (2017); Wolter et al. (2017); Hentrich et al. (2018) which value of K at 15 T is significantly larger than
the energies probed by MWA. This is compliant with the MWA caused by a continuum below the lowest sharp mode and persisting at elevated
temperatures, a feature inconsistent with conventional magnon excitations.
The lower bound of the continuum appears to be
quite small, of the order GHz (0.4 meV).
The continuum suggests a natural explanation in terms of fractionalized excitations. Given that a generic Kitaev spin liquid displays an excitation
continuum down to lowest energies Song et al. (2016), possibly peaked at an energy corresponding to a fraction of the Kitaev coupling
Knolle et al. (2014), we consider it likely that the experimental continuum represents genuine spin-liquid physics. In a fractionalization scenario, the
sharper magnon-like modes observed at elevated energy may then be interpreted as bound-state magnetic excitations Ponomaryov et al. (2017). We emphasize
that the gapped phase above T depicted in Fig. 2 as g-CPM is very unconventional in the sense that
the gap seen in many physical properties Baek et al. (2017); Sears et al. (2017); Wolter et al. (2017); Hentrich et al. (2018) is not a usual spin-wave gap typically observed in
antiferromagnets or in fully polarized states of SU(2)-symmetric magnets above a saturation field, but a gap in a continuum of excitations.
Our MWA study reveals that these broad in energy excitations are of nature which offers new insights for the interpretation of other
experimental results. Account for other interactions beyond the Kitaev model may bring additional complexity in the spin dynamics Winter et al. (2018).
Thus, developing a detailed theory of microwave absorption for the Kitaev spin liquid and its descendants is a key task for the
future.
Acknowledgments
The authors acknowledge valuable discussions with J. van den Brink, R. Moessner, J. Knolle, I. Rousochatzakis, L. Janssen and R. Valenti. This
work has been supported by the Deutsche Forschungsgemeinschaft (DFG) via SFB 1143 and Grant No. KA 1694/8-1.
References
- Kitaev (2006) A. Kitaev, Ann. Phys. 321, 2 (2006).
- Jackeli and Khaliullin (2009) G. Jackeli and G. Khaliullin, Phys. Rev. Lett. 102, 017205 (2009).
- Chaloupka et al. (2010) J. Chaloupka, G. Jackeli, and G. Khaliullin, Phys. Rev. Lett. 105, 027204 (2010).
- Winter et al. (2017) S. M. Winter, A. A. Tsirlin, M. Daghofer, J. van den Brink, Y. Singh, P. Gegenwart, and R. Valentí, J. Phys. Condens. Matter 29, 493002 (2017).
- Plumb et al. (2014) K. W. Plumb, J. P. Clancy, L. J. Sandilands, V. V. Shankar, Y. F. Hu, K. S. Burch, H.-Y. Kee, and Y.-J. Kim, Phys. Rev. B 90, 041112 (2014).
- Sears et al. (2015) J. A. Sears, M. Songvilay, K. W. Plumb, J. P. Clancy, Y. Qiu, Y. Zhao, D. Parshall, and Y.-J. Kim, Phys. Rev. B 91, 144420 (2015).
- Sears et al. (2017) J. A. Sears, Y. Zhao, Z. Xu, J. W. Lynn, and Y.-J. Kim, Phys. Rev. B 95, 180411 (2017).
- Banerjee et al. (2018) A. Banerjee, P. Lampen-Kelley, J. Knolle, C. Balz, A. A. Aczel, B. Winn, Y. Liu, D. Pajerowski, J.-Q. Yan, C. A. Bridges, A. T. Savici, B. C. Chakoumakos, M. D. Lumsden, D. A. Tennant, R. Moessner, D. G. Mandrus, and S. E. Nagler, npj Quantum Materials 3, 8 (2018).
- Wolter et al. (2017) A. U. B. Wolter, L. T. Corredor, L. Janssen, K. Nenkov, S. Schönecker, S.-H. Do, K.-Y. Choi, R. Albrecht, J. Hunger, T. Doert, M. Vojta, and B. Büchner, Phys. Rev. B 96, 041405 (2017).
- Hentrich et al. (2018) R. Hentrich, A. U. B. Wolter, X. Zotos, W. Brenig, D. Nowak, A. Isaeva, T. Doert, A. Banerjee, P. Lampen-Kelley, D. G. Mandrus, S. E. Nagler, J. Sears, Y.-J. Kim, B. Büchner, and C. Hess, Phys. Rev. Lett. 120, 117204 (2018).
- Kasahara et al. (2018a) Y. Kasahara, T. Ohnishi, Y. Mizukami, O. Tanaka, S. Ma, K. Sugii, N. Kurita, H. Tanaka, J. Nasu, Y. Motome, T. Shibauchi, and Y. Matsuda, Nature 559, 227 (2018a).
- Banerjee et al. (2017) A. Banerjee, J. Yan, J. Knolle, C. A. Bridges, M. B. Stone, M. D. Lumsden, D. G. Mandrus, D. A. Tennant, R. Moessner, and S. E. Nagler, Science 356, 1055 (2017).
- Sandilands et al. (2015) L. J. Sandilands, Y. Tian, K. W. Plumb, Y.-J. Kim, and K. S. Burch, Phys. Rev. Lett. 114, 147201 (2015).
- Nasu et al. (2016) J. Nasu, J. Knolle, D. Kovrizhin, Y. Motome, and R. Moessner, Nature Physics 12, 912 (2016).
- Banerjee et al. (2016) A. Banerjee, C. A. Bridges, J.-Q. Yan, A. A. Aczel, L. Li, M. B. Stone, G. E. Granroth, M. D. Lumsden, Y. Yiu, J. Knolle, S. Bhattacharjee, D. L. Kovrizhin, R. Moessner, D. A. Tennant, D. G. Mandrus, and S. E. Nagler, Nature Mater. 15, 733 (2016).
- Knolle et al. (2014) J. Knolle, D. L. Kovrizhin, J. T. Chalker, and R. Moessner, Phys. Rev. Lett. 112, 207203 (2014).
- Song et al. (2016) X.-Y. Song, Y.-Z. You, and L. Balents, Phys. Rev. Lett. 117, 037209 (2016).
- Do et al. (2017) S.-H. Do, S.-Y. Park, J. Yoshitake, Y. Motome, Y. Kwon, D. Adroja, D. Voneshen, K. Kim, T.-H. Jang, J.-H. Park, K.-Y. Choi, and S. Ji, Nature Physics 13, 1079 (2017).
- Little et al. (2017) A. Little, L. Wu, P. Lampen-Kelley, A. Banerjee, S. Patankar, D. Rees, C. A. Bridges, J.-Q. Yan, D. Mandrus, S. E. Nagler, and J. Orenstein, Phys. Rev. Lett. 119, 227201 (2017).
- Wang et al. (2017) Z. Wang, S. Reschke, D. Hüvonen, S.-H. Do, K.-Y. Choi, M. Gensch, U. Nagel, T. Rõ om, and A. Loidl, Phys. Rev. Lett. 119, 227202 (2017).
- Ponomaryov et al. (2017) A. N. Ponomaryov, E. Schulze, J. Wosnitza, P. Lampen-Kelley, A. Banerjee, J.-Q. Yan, C. A. Bridges, D. G. Mandrus, S. E. Nagler, A. K. Kolezhuk, and S. A. Zvyagin, Phys. Rev. B 96, 241107 (2017).
- Shi et al. (2018) L. Y. Shi, Y. Q. Liu, T. Lin, M. Y. Zhang, S. J. Zhang, L. Wang, Y. G. Shi, T. Dong, and N. L. Wang, Phys. Rev. B 98, 094414 (2018).
- Reschke et al. (2018) S. Reschke, F. Mayr, S. Widmann, H.-A. Krug von Nidda, V. Tsurkan, M. V. Eremin, S.-H. Do, K.-Y. Choi, Z. Wang, and A. Loidl, ArXiv e-prints (2018), arXiv:1803.04887 [cond-mat.str-el] .
- Wu et al. (2018) L. Wu, A. Little, E. E. Aldape, D. Rees, E. Thewalt, P. Lampen-Kelley, A. Banerjee, C. A. Bridges, J. Yan, S. Patankar, D. Goldhaber-Golden, D. Mandrus, S. E. Nagler, E. Altman, and J. Orenstein, Phys. Rev. B 98, 094425 (2018).
- Binnewies et al. (2012) M. Binnewies, R. Glaum, M. S. Schmidt, and P. Schmidt, Chemical Vapor Transport Reactions (Walter de Gruyter GmbH & Co. KG, Berlin.Boston, 2012).
- Johnson et al. (2015) R. D. Johnson, S. C. Williams, A. A. Haghighirad, J. Singleton, V. Zapf, P. Manuel, I. I. Mazin, Y. Li, H. O. Jeschke, R. Valentí, and R. Coldea, Phys. Rev. B 92, 235119 (2015).
- (27) See Supplemental Material at http://link.aps.org/supplemental/10.1103/PhysRevB.98.184408 for technical details of the MWA measurements.
- Eilers et al. (1994) G. Eilers, M. von Ortenberg, and R. Galazka, Int. J. Infrared Millimeter Waves 15, 695 (1994).
- Kullmann et al. (1984) W. Kullmann, K. Strobel, and R. Geick, J. Phys. C 17, 6855 (1984).
- Brunel et al. (2002) L. Brunel, A. Caneschi, A. Dei, D. Friselli, D. Gatteschi, A. Hassan, L. Lenci, M. Martinelli, C. Massa, L. Pardi, F. Popescu, I. Ricci, and L. Sorace, Res. Chem. Intermed. 28, 215 (2002).
- Sosin et al. (2008) S. S. Sosin, L. A. Prozorova, A. I. Smirnov, P. Bonville, G. Jasmin-Le Bras, and O. A. Petrenko, Phys. Rev. B 77, 104424 (2008).
- Majumder et al. (2015) M. Majumder, M. Schmidt, H. Rosner, A. A. Tsirlin, H. Yasuoka, and M. Baenitz, Phys. Rev. B 91, 180401 (2015).
- Kubo and Tomita (1954) R. Kubo and K. Tomita, J. Phys. Soc. Jpn 9, 888 (1954).
- Baek et al. (2017) S.-H. Baek, S.-H. Do, K.-Y. Choi, Y. S. Kwon, A. U. B. Wolter, S. Nishimoto, J. van den Brink, and B. Büchner, Phys. Rev. Lett. 119, 037201 (2017).
- (35) Recent (quantum) thermal Hall effect measurements Kasahara et al. (2018a, b) as well as combined thermal conductivity and magnetic torque measurements Leahy et al. (2017) support a scenario with unconventional fractionalized excitations.
- Bulaevskii et al. (2008) L. N. Bulaevskii, C. D. Batista, M. V. Mostovoy, and D. I. Khomskii, Phys. Rev. B 78, 024402 (2008).
- Potter et al. (2013) A. C. Potter, T. Senthil, and P. A. Lee, Phys. Rev. B 87, 245106 (2013).
- Bolens et al. (2018) A. Bolens, H. Katsura, M. Ogata, and S. Miyashita, Phys. Rev. B 97, 161108 (2018).
- Winter et al. (2017) S. M. Winter, K. Riedl, P. A. Maksimov, A. L. Chernyshev, A. Honecker, and R. Valenti, Nature Comm. 8, 1152 (2017).
- Winter et al. (2018) S. M. Winter, K. Riedl, D. Kaib, R. Coldea, and R. Valentí, Phys. Rev. Lett. 120, 077203 (2018).
- Janša et al. (2018) N. Janša, A. Zorko, M. Gomilšek, M. Pregelj, K. Krämer, D. Biner, A. Biffin, C. Rüegg, and M. Klanjšek, Nature Physics 14, 786 (2018).
- Zheng et al. (2017) J. Zheng, K. Ran, T. Li, J. Wang, P. Wang, B. Liu, Z.-X. Liu, B. Normand, J. Wen, and W. Yu, Phys. Rev. Lett. 119, 227208 (2017).
- Kasahara et al. (2018b) Y. Kasahara, K. Sugii, T. Ohnishi, M. Shimozawa, M. Yamashita, N. Kurita, H. Tanaka, J. Nasu, Y. Motome, T. Shibauchi, and Y. Matsuda, Phys.Rev.Lett. 120, 217205 (2018b).
- Leahy et al. (2017) I. Leahy, C. Pocs, P. Siegfried, D. Grad, S.-H. Do, K.-Y. Choi, B. Normand, and M. Lee, Phys.Rev.Lett. 118, 187203 (2017).