\marginsize
3cm3cm3cm1cm
3D Simulation of Electron and Ion Transmission of GEM-based Detectors
Purba Bhattacharyaa∗1, Bedangadas Mohantya, Supratik Mukhopadhyayb, Nayana Majumdarb, Hugo Natal da Luzc
a School of Physical Sciences, National Institute of Science Education and Research, Jatni, Bhubaneswar, India
b Applied Nuclear Physics Division, Saha Institute of Nuclear Physics, Kolkata, India
c High Energy Physics and Instrumentation Center, Instituto de Fsica, Universidade de So Paulo, Brazil
Abstract
Time Projection Chamber (TPC) has been chosen as the main tracking system in several high-flux and high repetition rate experiments. These include on-going experiments such as ALICE and future experiments such as PANDA at FAIR and ILC. Different activities were carried out on the adoption of Gas Electron Multiplier (GEM) as the gas amplification stage of the ALICE-TPC upgrade version. The requirement of low ion feedback has been established through these activities. Low ion feedback minimizes distortions due to space charge and maintains the necessary values of detector gain and energy resolution. In the present work, Garfield simulation framework has been used to study the related physical processes occurring within single, triple and quadruple GEM detectors. Ion backflow and electron transmission of quadruple GEMs, made up of foils with different hole pitch under different electromagnetic field configurations (the projected solutions for the ALICE TPC) have been studied. Finally a new triple GEM detector configuration with low ion backflow fraction and good electron transmission properties has been proposed as a simpler GEM-based alternative suitable for TPCs for future collider experiments.
Keywords: Gas Electron Multiplier, Detector Geometry, Electron Transmission, Energy Resolution, Ion Backflow
∗Corresponding Author: Purba Bhattacharya
1 Presently at Department of Particle Physics and AstroPhysics, Weizmann Institute of Science, Herzl St. 234, Rehovot - 7610001, Israel
E-mail: purba.bhattacharya85@gmail.com
1 Introduction
The physics processes aimed at various on-going and future high energy and particle physics experiments, have pushed the detector requirements to an unprecedented level. Owing to the enormous particle multiplicity per event, these requirements include good momentum resolution, high jet energy resolution, excellent particle identification and ability to cope with the harsh radiation environments. Time Projection Chambers (TPC) [1], due to their low material budget and excellent pattern recognition capabilities, are often used for three-dimensional tracking and identification of charged particles. They constitute the main tracking system in many on-going experiments, such as ALICE [2] and are proposed to be used for several future experiments such as PANDA [3] and ILC [4]. Since the ALICE experiment is an on-going one planning for a significant upgrade within a few years time scale, extensive has been carried out for the upgrade part of its TPC.
ALICE (A Large Ion Collider Experiment) is one of the general-purpose heavy-ion experiments at the Large Hadron Collider (LHC) which is designed to study the physics of strongly interacting matter and the Quark Gluon Plasma (QGP) in nucleus-nucleus collisions. In order to identify all the particles that are coming out of the QGP, ALICE is using a set of 18 detectors that gives information about the mass, the velocity and the electrical sign of the particles. A significant increase of the LHC luminosity for heavy ions is expected in RUN 3 after Long Shutdown 2 (LS2), leading to collision rates of about 50 kHz for Pb-Pb collisions. This implies a substantial enhancement of the sensitivity to a number of rare probes that are key observable for the characterization of strongly interacting matter at high temperature. A continuous ungated mode of operation is the only way to run the TPC in 50 kHz Pb-Pb collisions.
The time necessary to evacuate the ion charge (created in the amplification process) from the detector volume is relatively high for the current Multi Wire Proportional Chamber (MWPC) based readout of the present ALICE-TPC. These ions drift back into the TPC volume, create local perturbations in the electric field and, thus, affect the drift behavior of the electrons from a later track. This ion feedback problem restricts the use of MWPCs in high rate experiments. Although this problem can be solved by using an additional plane of gating grid, it leads to an intrinsic dead time for the TPC, implying a rate limitation of the present TPC.
To fully exploit the scientific potential of the LHC at high-rate Pb-Pb collisions, the ALICE collaboration plans an upgrade of many sub-detectors, including the central tracker [5, 6]. Different activities have been carried out and converged to the adoption of Gas Electron Multiplier (GEM) [7] as the gas amplification stage of the ALICE-TPC upgrade version [8] while retaining the present tracking and particle identification capabilities of the TPC via measurement of the specific energy loss (dE/dx). The new readout chambers will employ stacks of four GEM foils for gas amplification and anode pad readout. The configuration consists of a combination of standard (S) and large hole pitch (LP) GEM foils, i.e., S-LP-LP-S. Such quadruple GEM stacks have been found to provide sufficient ion blocking capabilities at the required gas gain of in (). However, further optimization of the experimental parameters (geometry, electrostatic configuration, gas composition, material used to build the detector components) can minimize distortion due to space charge by reducing ion feedback in the drift volume [9] and larger signals through improved electron transmission.
In this work, we have tried to develop a thorough understanding of GEM-based detectors from this point of view and made attempts to explore the appropriateness / suitability of these detectors in the context of the TPC in general. Extensive numerical simulations have been carried out to estimate the effects of detector geometry, electric field configurations and magnetic field on electron transmission and ion backflow fraction. To begin with, single GEM configurations have been studied in detail and compared with available experimental data. A good understanding of this device has allowed us to deal with the quadruple GEM configuration with relative ease. The numerical results for the quadruple GEM have been also compared with the available experimental data of ALICE TPC. Finally, we have worked on a new configuration of a triple GEM detector which allows low ion backflow fraction despite providing good electron transmission and may be suitable for the TPCs in future collider experiments. The stability of the detector behavior and the discharge probability are very important for the operation and most importantly they are affected by the geometry and field configurations. In the present simulation, all these issues are not taken into account. Thus, the proposed solutions may need to be evaluated as regard to the overall stability of the detector.
2 Simulation Tools
The Garfield [10, 11] simulation framework has been used in the present work. The 3D electrostatic field simulation has been carried out using neBEM (nearly exact Boundary Element Method) [12, 13, 14] toolkit. Besides neBEM, HEED [15, 16] has been used for primary ionization calculation and Magboltz [17, 18] for computing drift, diffusion, Townsend and attachment coefficients.
3 Simulation Models
| Polymer substrate | |
|---|---|
| Copper coating thickness | |
| Hole diameter (copper layer) | |
| Hole diameter (Polymer substrate) | |
| Hole to hole pitch | |
| Drift Gap | |
| Transfer gap 1 | |
| Transfer gap 2 | |
| Transfer gap 3 | |
| Induction gap |
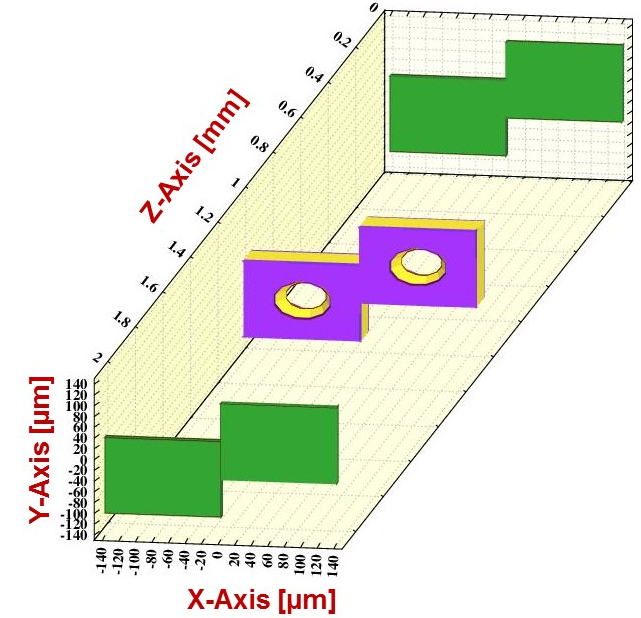
The design parameters of GEM-based detectors considered in the numerical work, are listed in Table 1. The model of a basic GEM cell, built using Garfield, is shown in Fig. 1. It represents a GEM foil, having two bi-conical shaped holes placed in a staggered manner along with a readout anode and a drift plane on either sides of the foil. The distance between top surface of the GEM and the drift plane is called the drift gap whereas that between the lower surface and the readout plate is named induction gap. The GEM foil separates these two volumes and is responsible for the transfer and amplification of the primary electrons generated in the drift volume. A potential difference and are maintained in the drift volume and the induction volume, respectively. The electric fields, both in the drift () and induction () volumes, are uniform and the magnitudes have been kept at a value to meet the requirements of the electron drift and diffusion only. The large potential difference () between the upper and lower GEM electrodes creates a strong field inside the holes () which causes the amplification of the primary electrons.
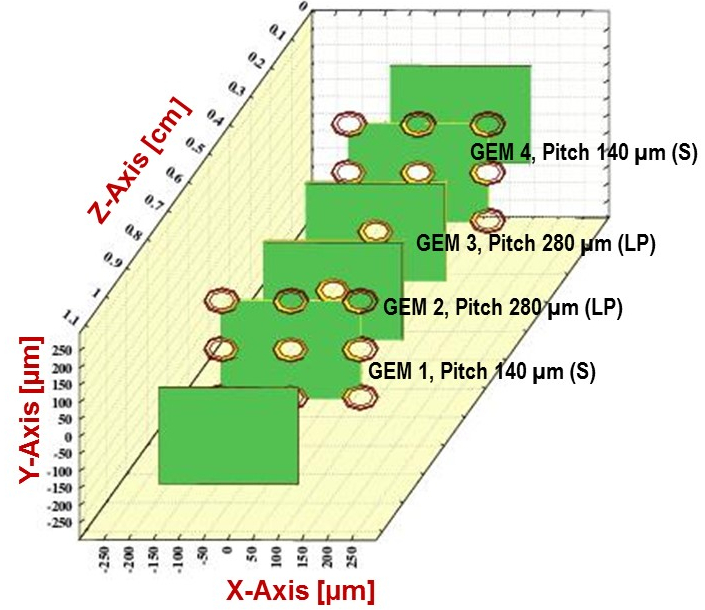
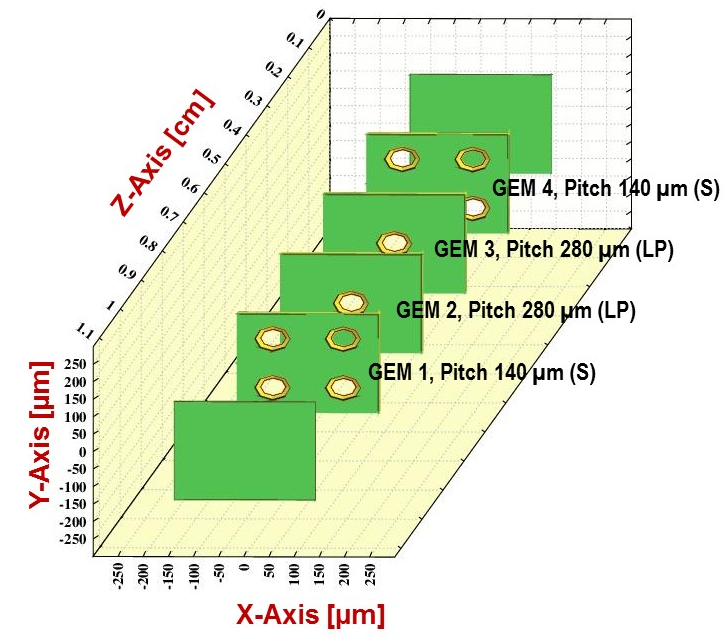
In comparison to single GEM, in case of multi GEM detector, several GEM foils are placed in between the drift and the read-out plane. The naming scheme used in this work numbers the foils in the order of the passage of electrons coming from the drift region. The first GEM after the drift plane is called GEM 1 and the others are GEM 2, GEM 3 and so on. The gap in between GEM 1 and 2 is called Transfer gap 1 and that between GEM 2 and 3 is called Transfer gap 2 etc. The field in the transfer gap is uniform and the magnitudes have been kept in a range suitable for the requirements of electron drift and diffusion. For example, the simulation models of two different quadruple GEM devices are shown in Fig. 1. Among the four foils, GEM 1 and GEM 4 have the pitch of (denoted as S), whereas the middle two foils have a larger pitch of (denoted as LP). This arrangement is denoted as S-LP-LP-S. In the first case (QGemI), the central hole of the basic unit from all the four GEM foils are perfectly aligned (Fig. 1). In the other case (QGemII), as shown in Fig. 1, the first and the last foils (S) are aligned with each other whereas the second and third foils (LP) are misaligned with them. The basic cell structure then has been repeated along both positive and negative X and Y-Axes to represent a real detector. With the help of these models, the field configuration of the detectors have been simulated using appropriate voltage settings. These are followed by the simulation of electron transmission and ion backflow fraction in (90/10/5) gas mixture.
For estimating electron transmission within a GEM detector, electron tracks generated by photon have been considered in the drift volume. The primary electrons created in the drift region are then made to drift towards the GEM foil using the Microscopic tracking routine [10]. In this procedure, a typical drift path proceeds through millions of collisions and each collision can be classified as elastic or inelastic collision, excitation, ionization, attachment etc.
The electrons during their drift produce avalanche inside the GEM foil. For this calculation Monte Carlo routine has been used. The procedure first drifts an initial electron from the specified starting point. At each step, a number of secondary electrons is produced according to the local Townsend and attachment coefficients and the newly produced electrons are traced like the initial electrons. In parallel, the ion drift lines are also traced. The primary ions in the drift region and the ions created in the avalanche have been considered for the estimation of the backflow fraction.
4 Results
4.1 Electron Transmission
Electron transmission can be presented as a function of two mechanisms: electron focusing and transverse diffusion. The field configuration has a strong impact on electron focusing. Due to the high field gradient between the drift volume and the GEM hole, the field lines are compressed, resulting in a characteristic funnel shape. The decrease of for a particular or the increase of at a fixed affects the funneling, resulting in the termination of the field line on the top surface of the GEM foil. Again, the ratio between the and controls the field lines inside the GEM foil as well as in the induction volume. Since is lower than the field inside the GEM hole, the field lines emerging from the hole spread uniformly and finally end at the readout plane. Depending on the field ratio, the field lines emerging from the holes spread further away, promoting an increase of the number of electrons, while some field lines end on the bottom copper surface of the GEM foil. In order to ensure the collection of a good percentage of electrons on the readout plate, a proper optimization of the field in these three different regions is necessary. Other important parameters such as attachment, diffusion depend on the gas mixture composition and . All these factors have important role in determining the final transmission.
4.1.1 Single GEM
For a single GEM detector, the total electron transmission () can be identified as the multiplication of two efficiencies, the collection efficiency () and the extraction efficiency (). The collection efficiency has been defined as:
| (1) |
The extraction efficiency has been defined as:
| (2) |
Finally, the total transmission can be defined as:
| (3) |
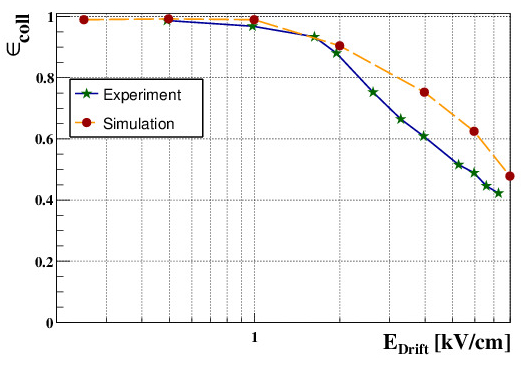
We compared our numerical estimates with the experimental data available from [19]. The detector geometry in [19] is same as described in Table 1. The gas mixture was (70/30). In Fig. 2, the collection efficiency has been plotted with , whereas and have been fixed to and , respectively. At lower drift field, for example at , the simulation result agrees to experimental data within , whereas at , the agreement is within . The manufacturing tolerances and defects in the GEM foil, the uncertainties in applied voltage, the possible impurities in the gas mixture may be the main reasons behind the discrepancy between the experimental and numerical estimates.
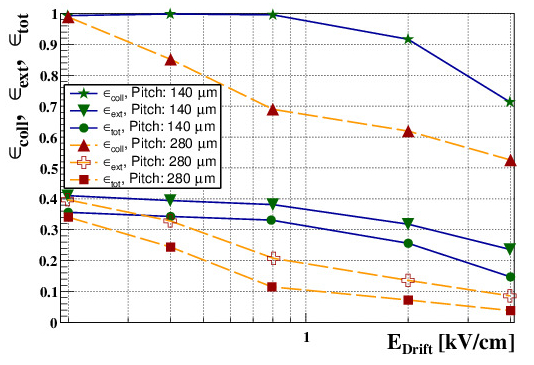
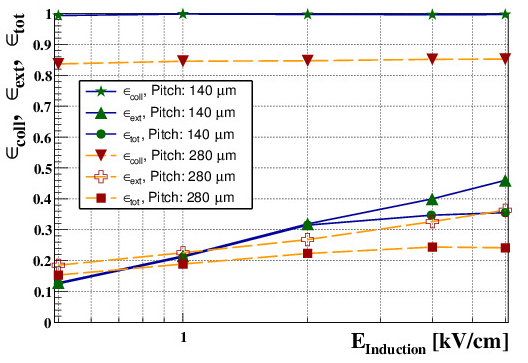
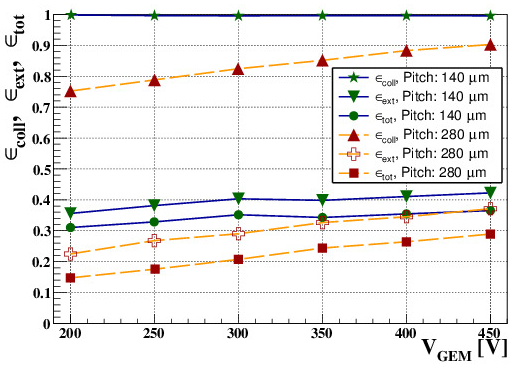
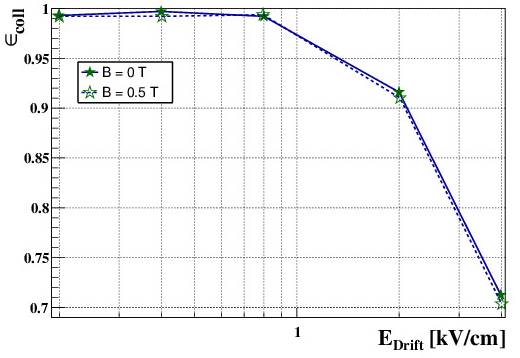
For the configuration, discussed in this paper, the variations of , and under different field configurations have been plotted in Fig. 3. For a fixed and , and thus , decrease with the increase of the drift field, whereas no significant effects of drift field on has been observed (Fig. 3). Similarly, at a fixed and , the increase of induction field, increases as shown in Fig. 3. From Fig. 3 and 3, it is also obvious that the hole pitch has a strong impact on and and, thus, on . For the same voltage configuration, the larger pitch gives less and, thus, in comparison to the standard pitch of . This can be understood as follows. For low drift fields, the voltage difference across the GEM have the effect of focusing the field lines towards the holes. However, as increases, some of the field lines are attracted to the copper surface and at some point they end there, leading to a loss of . This effect takes place at lower drift fields when there is more space between holes, such as the case of the pitch. An increase in the ratio results in the termination of the drift lines on the top surface of the GEM foil leading to a loss of . The extraction of electrons from the holes of the GEM increases with higher . For a given a larger value of pitch leads to higher because is relatively more uniform in this case in comparison to the configuration with smaller pitch. The change of on electron efficiencies has been shown in Fig. 3. Since the ALICE TPC will be operated in presence of a magnetic field, the effect of such field on electron transmission has been studied (Fig. 3). The direction of this magnetic field is along positive Z-axis. But, no significant effect on transmission, has been observed.
| Drift Field | 0.4 kV/cm |
|---|---|
| 40 kV/cm | |
| Transfer Field 1 | 4 kV/cm |
| 35 kV/cm | |
| Transfer Field 2 | 2 kV/cm |
| 37 kV/cm | |
| Transfer Field 3 | 0.1 kV/cm |
| 45 kV/cm | |
| Induction Field | 4 kV/cm |
4.1.2 Quadruple GEM
From the study of single GEM detector, it is observed that higher electron transmission can be obtained with higher GEM voltage, lower drift field and higher induction field. GEM foils with standard pitch give better electron transmission. For the present work, the voltage configuration for quadruple GEM detectors are listed in Table 2. The drift field is low and the induction field is high as desired. The has been tuned in such a way so as to keep the overall gain to . Also the highest voltage on the fourth GEM foil and very low field in Transfer Gap 3 help to reduce the ion backflow efficiently.
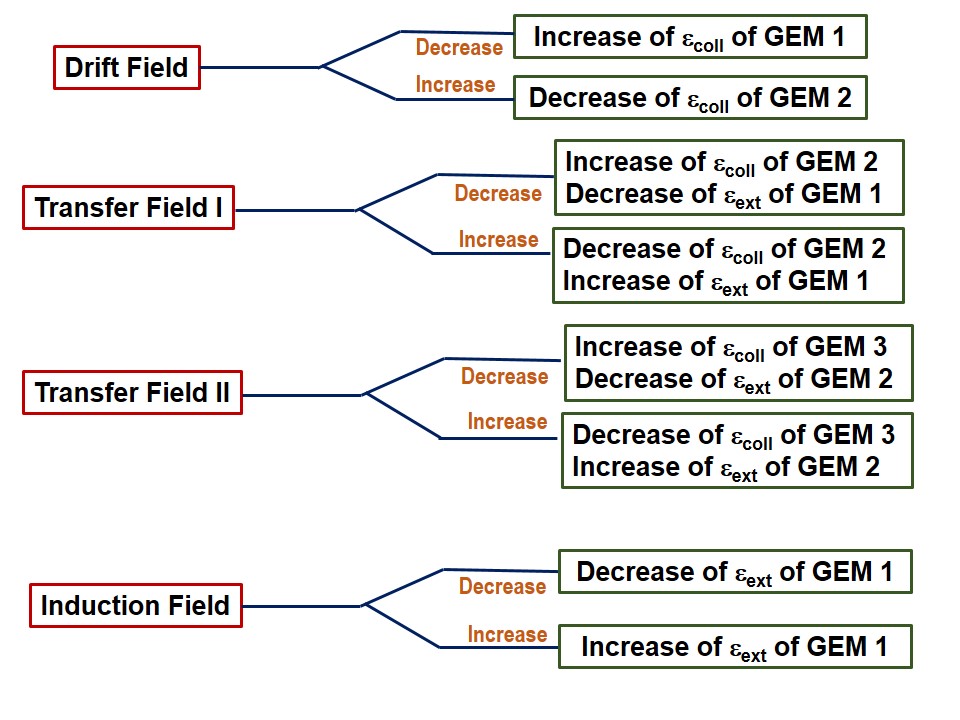
For multi-GEM detectors, the electron transmission can be expressed as the multiplication of collection and extraction efficiencies of the individual GEM foils. Thus, for the quadruple GEM configurations,
| (4) |
For the present voltage configuration these two efficiencies and the total transmission of two different quadruple GEM detectors are listed in Table 3. Fig. 4 illustrates the dependence of and on different fields. The large field in Transfer Gap 1 and 2, which act as an induction field for GEM 1 and GEM 2, respectively, is sufficient for good extraction efficiencies from these two foils. But, at the same time they act as a drift field for GEM 2 and GEM 3, respectively and, thus, affect adversely the collection efficiencies of these two foils. Following similar argument, the low value of Transfer Field 3 is responsible for the low extraction efficiency of the GEM 3 and almost collection efficiency of GEM 4. Finally, the total transmission is affected significantly. The increase of Transfer Field 2 and Transfer Field 3 and the decrease of the Transfer Field 1 can affect the individual efficiencies of the GEM foil, but the total transmission remains unaffected. for the multi-GEM devices is also affected significantly by the variation in geometry.
| Geometry | B | |||||||||
|---|---|---|---|---|---|---|---|---|---|---|
| [T] | [] | [] | [] | [] | [] | [] | [] | [] | [] | |
| QGemI | 0 | 99.30 | 39.56 | 6.73 | 35.43 | 15.1 | 16.02 | 91.53 | 43.98 | 0.0091 |
| QGemI | 0.5 | 99.59 | 40.02 | 6.47 | 36.16 | 14.76 | 16.08 | 90.97 | 45.49 | 0.0092 |
| QGemII | 0.5 | 89.57 | 43.09 | 7.14 | 34.59 | 12.97 | 14.26 | 97.14 | 46.10 | 0.0079 |
4.2 Energy Resolution
4.2.1 Single GEM
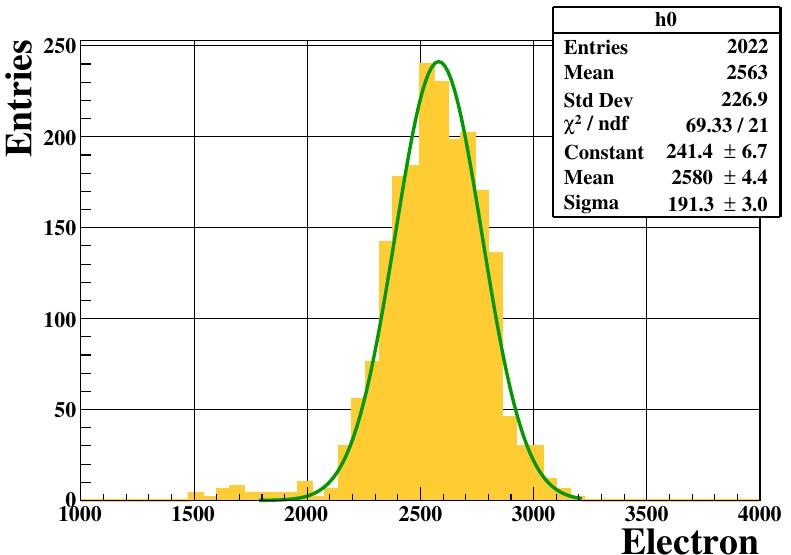
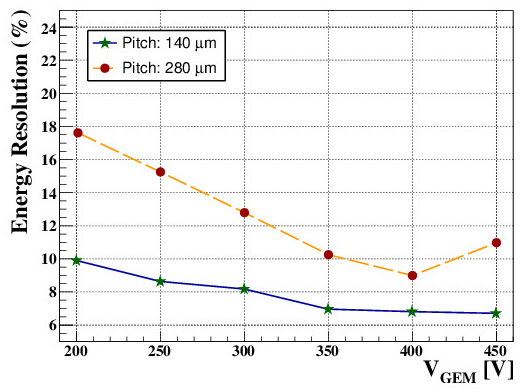
The energy resolution of a single GEM detector and its variation with different field configurations has been computed. In the numerical approach, the primary ionization for photon track has been estimated using HEED. These primary electrons then follow the procedures of drift and amplification. Finally, the electrons have emerged from the hole and drifted towards the readout plane where they have been collected. The photo-peak of the simulated charge spectrum has finally been fitted using a Gaussian distribution, just as it would have been done for an experiment. The distribution of the total electron for the main photo-peak is shown in Fig. 5. From the mean and the r.m.s of this distribution, the energy resolution has been estimated using
| (5) |
where is the peak position and the is the r.m.s of the distribution.
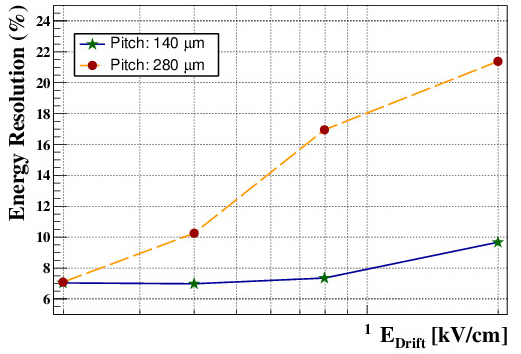
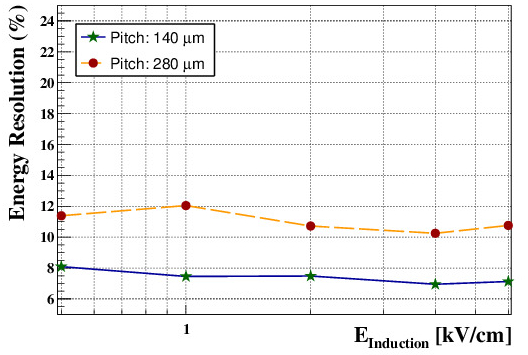
The variation of energy resolution under different field configurations has been plotted in Fig. 5. The dependence on the different fields can be explained with the help of the transmission plot (Fig. 3). For a fixed and , the energy resolution is better at lower drift field due to the higher transmission and then it degrades with the increase of the drift field (Fig. 5). At a fixed and , the rise of induction field, increases the total transmission. Hence, the energy resolution is better at the higher induction field as shown in Fig. 5. On the other hand, the collection efficiency mildly depends on the GEM voltage: between and it increases only , while the resolution improves from to . The increase of by , increases the gain by a factor of , where as the standard deviation of single avalanche changes only by a factor of . The larger amplification at high is the main cause of improvement of the energy resolution (Fig. 5. But in actual experimental condition, at higher field (mainly at higher values of ) there may be some degradation of the resolution due to the secondary avalanches induced by UV photons. Besides that, in an actual experiment, the space charge and charging up of the dielectric may influence the resolution. But, in the present calculation, we have ignored such effects for the time being.
4.2.2 Quadruple GEM
For numerical simulation of energy resolution, the analytical formula as described in the following equation, has been used.
| (6) |
where is the Fano Factor, is the number of primary ionization, is the gain and is the standard deviation of the single avalanche.
Numerically, the gain has been defined as the number of electrons reaching the anode divided by the number of primary electrons in the drift volume. The numerical energy resolution, calculated using Eqn. 6, for the present field configuration in case of QGemI was found to be , whereas for QGemII, it is . This is expected as the transmission in the second case is lower. The value agrees within with the reported experimental data of [8].
4.3 Ion Backflow
As mentioned earlier, the ions drifting back to the drift volume can disturb the homogeneity of the drift field and, thus, distort the behavior of the detector. The electron avalanche and the ion drift lines in case of a single GEM detector for a particular field configuration are shown in Fig. 6. Most of the secondary ions are collected on the top surface of the GEM foil while the rest drift back to the drift volume. In order to prevent those ions from entering the drift volume, a proper optimization of the field in the drift volume, GEM hole and induction region is necessary.
Experimentally, the backflow fraction has been defined as ratio of drift to anode current [9]:
| (7) |
where is the number of back drifting ions coming from the amplification region, per incoming electron. It also includes a contribution from ions created during the ionisation process.
It can be mentioned that in [19], the backflow fraction has been defined as:
| (8) |
where is the current measured from the top electrode.
In the numerical approach, we noted down the number of ions collected on different electrodes and made an estimate of the backflow fraction using both equations.
4.3.1 Single GEM
We have compared our numerical estimates with the experimental data, from [19]. In Fig. 6, the ion backflow fraction has been plotted with . The IBF calculated using Eqn. 8 agrees within with the experimental data. Possible reasons of the discrepancy between the experimental and simulation results have been described in section 4.1.1 and 4.2.1.
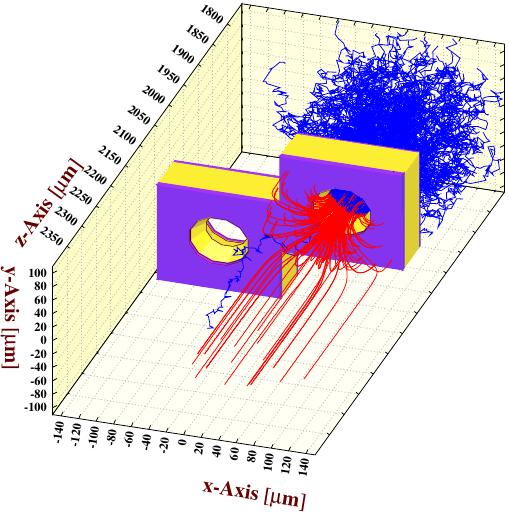
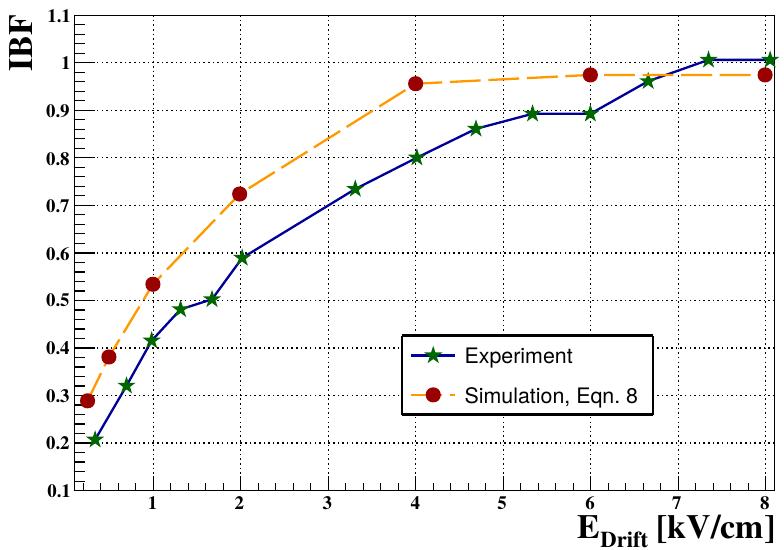
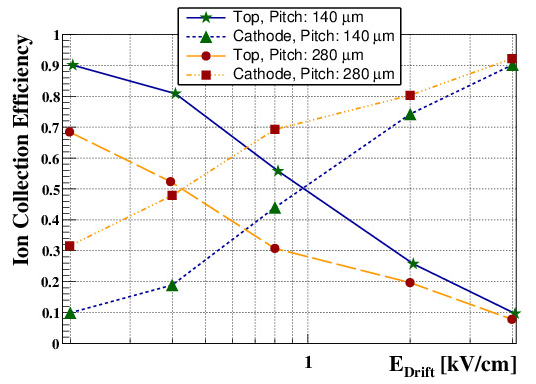
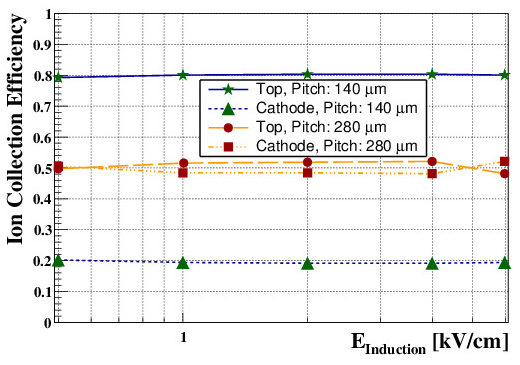
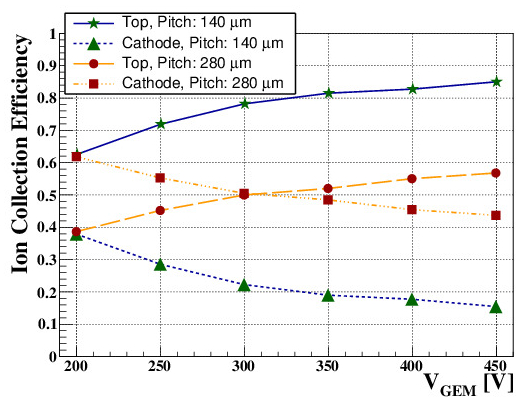
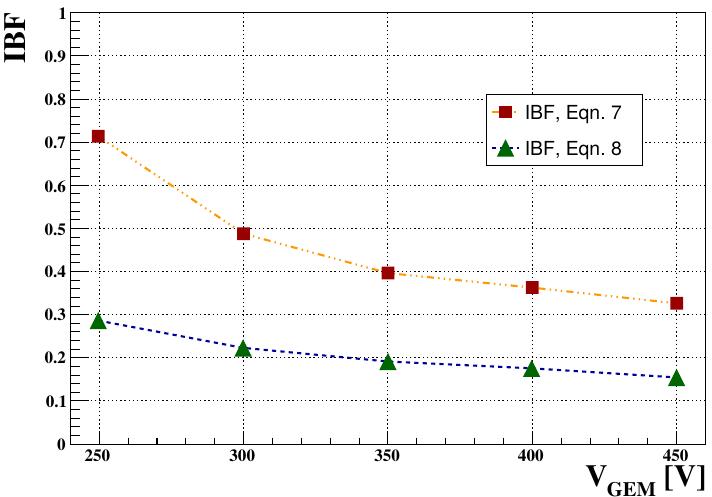
Fig. 7 shows the number of ions that are collected on different electrode under various field configurations. The ions that are collected on the drift plane, contribute to the backflow fraction. This fraction is low when more number of ions are collected on the other electrode. For these calculations, we used Eqn. 8 in order to be consistent with [19]. The ion backflow of a single GEM can be reduced by decreasing because less ions are extracted from the GEM holes (Fig. 7). For the same voltage configuration, for the pitch, due to the relatively higher drift field above the GEM foil, the ratio between and is large and, thus, the backflow fraction is more than that of the standard one. No significant effect of has been observed except at the higher (Fig. 7). At higher , the ratio between and is small and, thus, a large fraction of ions is collected at the top surface of the GEM foil (Fig. 7). Finally, a comparison between IBF estimated using Eqn. 7 and Eqn. 8 has been presented in Fig. 7.
4.3.2 Quadruple GEM
A better suppression of the ion backflow is known to be achieved by using multiple GEM structures. The ion collection efficiency of different electrodes under different configuration is listed in Table 4. The S-LP-LP-S configuration allows to block ions efficiently by employing asymmetric transfer fields and foils with low optical transmission. For the present voltage configuration, the gain is obtained with a Penning Transfer rate of . An increasing sequence of gas gains down the GEM stack helps reducing the ion backflow since ions created in the inner two layers are blocked more efficiently. Besides that, due to the low Transfer Field 3, most of the ions created in the last GEM foils are collected on the top surface of this foil. Using Eqn. 8, for the QGemI geometrical configuration, a backflow fraction of has been obtained, whereas Eqn. 7, gives . An increase of the Transfer Field 2 from to improves the backflow fraction by .
| Geometry | B [T] | GEM1 [] | GEM2 [] | GEM3 [] | GEM4 [] | Drift [] |
|---|---|---|---|---|---|---|
| QGemI | 0 | 2.5 | 0.4 | 1.3 | 93.2 | 2.7 |
| QGemII | 0.5 | 2.3 | 0.4 | 1.3 | 93.0 | 2.8 |
| QGemII | 0.5 | 5.9 | 0.5 | 1.2 | 92.3 | 0.1 |
As in the case of electron transmission, geometrical variation of the model can affect the backflow fraction. For QGemII, the placement of the foils are such that the collection of ions on the first GEM foil increases in comparison to that of the QGemI. Therefore, the backflow fraction reduces to (using Eqn. 8 and using Eqn. 7).
At the present voltage settings, a working point was identified by the ALICE TPC collaboration with an ion backflow of about at an energy resolution of . This value is within the range of the values estimated by simulation for two different geometries, QGemI and QGemII respectively. In the experiment, it is difficult to ensure the exact placement of successive GEM foils. This may be one of the other possible reasons of the discrepancy between the experimental and simulation results. On the other hand, for the quadruple GEM, IBF has been numerically estimated using a single electron avalanche initiated in the middle of the drift region. In reality, experimentally measured IBF is likely to have contribution from ions created throughout the gas volume. This will also lead to a difference between the experimental and the numerical estimates.
5 Novel Configuration of Triple GEM Detector
Though quadruple GEM setup is a very promising solution in terms of backflow fraction, the electron transmission is affected adversely. So, in parallel, a new triple GEM configuration has been studied.
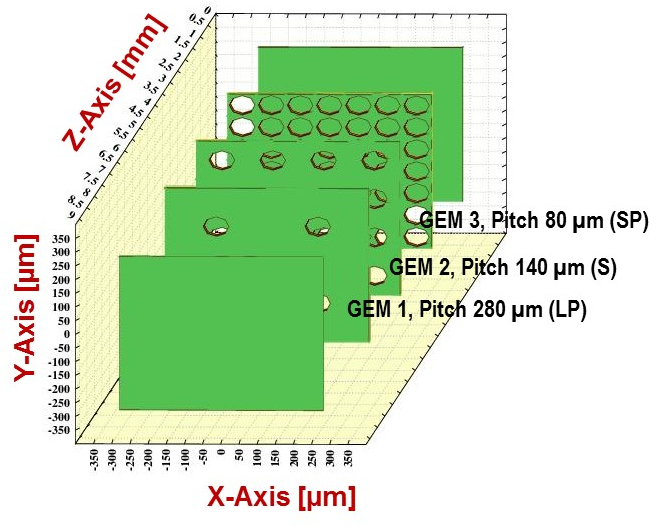
Earlier, in triple GEM systems using standard foils of , ion backflow values of were observed in different gas mixtures [9]. The backflow values exceed the specifications based on the maximum tolerable drift field distortions. In the new configuration, a triple GEM detector, having a configuration of LP-S-SP from top to bottom direction (here LP denotes the larger pitch of , S stands for the standard pitch of and SP is the smaller pitch of ), has been proposed. Currently, the GEM workshop at CERN produces a GEM model with standard active area of and a pitch of . The tests performed with this GEM and a detector with the geometry described in this section are on going and will be reported in a separate paper.
As seen before, the GEM collection efficiency in the same conditions is lower for GEMs with a larger pitch. Taking this into account, the aim of this setup is to apply transfer fields that keep a high collection efficiency for electrons in one GEM, while keeping a low ion collection in the holes of the previous one, that has a larger pitch. The target is to get the backflow fraction less than . Since the new configuration considers a smaller than standard pitch as the third GEM foil, a comparison of its characteristic with the standard one has first been carried out (the comparison between the larger pitch and the standard one has been already presented in the earlier section). This is followed by simulation of the proposed triple GEM detector configuration.
| Drift Field | 0.4 kV/cm |
|---|---|
| 52 kV/cm | |
| Transfer Field 1 | 1.75 kV/cm |
| 40 kV/cm | |
| Transfer Field 2 | 3.6 kV/cm |
| 35 kV/cm | |
| Induction Field | 4 kV/cm |
5.1 Comparison Between Foils
| [] | [] | [] | [] | [] | [] | % |
|---|---|---|---|---|---|---|
| 20.0 | 29.0 | 64.0 | 38.0 | 89.0 | 24.0 | 0.3 |
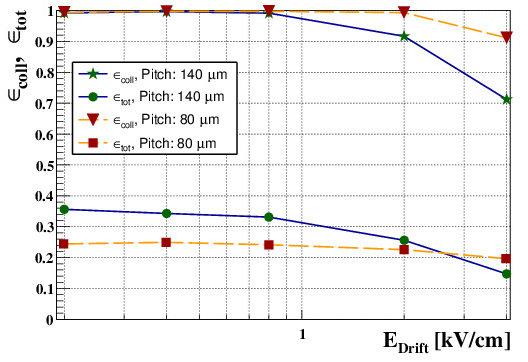
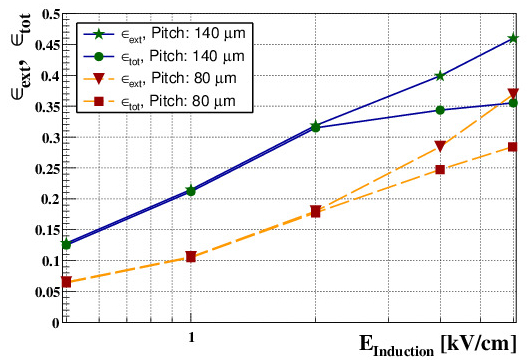
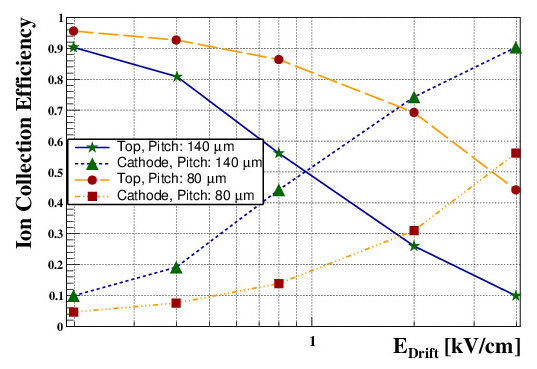
The variation of electron and ion transmission for smaller pitch are shown in Fig. 8. A comparison with the standard one reveals that collection efficiency and ion backflow fraction are better though extraction efficiency is less for this smaller pitch GEM. Due to the larger optical transparency of the smaller pitch GEM, the collection efficiency stays high until much higher drift fields because the copper area between the holes is much smaller, leading to less electrons lost between the holes. At the same time, it is necessary to apply a much higher voltage across the induction gap to assure the uniform field that will provide an extraction efficiency similar to the standard GEM. At the same time, this is favorable for less number of ions to come out.
5.2 Electron and Ion Transmission of Triple GEM Detector
The model of the novel configuration with the triple GEM detector is shown in Fig. 9. The smaller pitch acts as the last GEM foil in order to stop most of the ions. The field configuration considered for the present studies is listed in the Table 5. For the smaller pitch a relatively higher drift field is also suitable for a reasonably good collection efficiency. Therefore, very low field at the transfer region is not required in this configuration. For the present voltage configuration the gain is which is close to the ALICE requirement. The electron transmission efficiencies and the ions collection efficiencies of the individual GEM foil are listed in Table 6 and Table 7, respectively. The total electron transmission is better than the quadruple GEM detector. The backflow fraction is (using Eqn. 8) as desired by the ALICE TPC.
| GEM1 [] | GEM2 [] | GEM3 [] | Drift [] |
|---|---|---|---|
| 8.9 | 12.8 | 77.4 | 0.2 |
6 Conclusion
Time Projection Chambers (TPCs) are ideal devices for three-dimensional tracking, momentum measurement and identification of charged particles. They are used in many on-going experiments, including ALICE. In the upgraded version of the ALICE TPC, the amplification device will be based on the GEM detector. The geometry proposed by the ALICE collaboration has achieved an excellent energy resolution with an ion backflow below , while handling the proposed collision rate. In this work, an attempt has been made to numerically model and analyze the geometrical and electrical configuration of GEM-based TPCs in terms of electron and ion transmission. Study of single GEM detectors shows that higher electron transmission, better energy resolution and lower backflow fraction can be obtained with higher GEM voltage, lower drift field and higher induction field. GEM foils with standard pitch gives better electron transmission, as well as less ion backflow fraction. No significant effect of magnetic field has been observed on electron transmission and ion backflow fraction. Multi-GEM devices are found to be better in terms of lower ion backflow fraction though the electron transmission is affected adversely. Several studies have been performed on quadruple GEM detectors with various geometry and field configuration which are likely candidates for the TPCs in general. Extensive comparison with the ALICE experimental data leads us to believe that the physics processes occurring within these device are reasonably well understood and the tools used for carrying out the investigations in this work are quite mature. Finally, numerical simulation has been performed using three GEM foils having three different pitch but same hole diameter. Initial calculations show that this novel configuration can be suitable in terms of its better electron transmission and less ion backflow fraction.
7 Acknowledgment
We would like to express our sincere gratitude to Prof. Fabio Sauli for his invaluable advice and encouragement to continue this work. We thank the reviewer for the valuable comments and suggestions which helped us to enrich the content of the paper significantly. This work has partly been performed in the framework of the RD51 Collaboration. We wish to acknowledge the members of the RD51 Collaboration for their help and suggestions. We would also like to thank the members of the ALICE-TPC collaboration for their valuable suggestions. H. Natal da Luz acknowledges FAPESP grant 2013/17405-3. We thank our respective Institutions for providing us with the necessary facilities.
References
- [1] D. R. Nygren et al., Phys. Today 31 (1978) 46.
- [2] ALICE Collaboration, Jour. Instr. 3.08 (2008) S08002.
- [3] S. Drheim, Jour. Instr. 7 (2012) C03011.
- [4] R. Diener on behalf of the LCTPC Collaboration, Phys. Procedia 37 (2012) 456.
- [5] ALICE Collaboration, CERN-LHCC-2013-020 (2014).
- [6] P. Gasik, Jour. Instr. 9 (2013) C04035.
- [7] F. Sauli, Nucl. Instr. Meth. A 386 (1997) 531.
- [8] ALICE Collaboration, CERN-LHCC-2015-002 /ALICE-TDR-106-ADD-1 (2014).
- [9] M. Ball et al., Jour. Instr. 9 (2014) C04024.
- [10] http://cern.ch/garfield.
- [11] R. Veenhof, Nucl. Instr., A 419 (1998) 726.
- [12] http://cern.ch/neBEM.
- [13] N. Majumdar et al., Nucl. Instr. Meth. A 566 (2006) 489.
- [14] S. Mukhopadhyay et al., Eng. Anal. Boundary Elem. 30 (2006) 687.
- [15] http://cern.ch/heed.
- [16] I.B. Smirnov, Nucl. Instr. Meth. A 554 (2005) 474.
- [17] http://cern.ch/magboltz.
- [18] S.F. Biagi, Nucl. Instr. Meth. A 421 (1999) 234.
- [19] S. Bachmann et al., Nucl. Instr. Meth. A 438 (1999) 376.