Upper stellar mass limit by radiative feedback at low-metallicities: metallicity and accretion rate dependence
Abstract
We investigate the upper stellar mass limit set by radiative feedback by the forming star with various accretion rates and metallicities. To this end, we numerically solve the structures of both a protostar and its surrounding accretion envelope assuming a spherical symmetric and steady flow. The optical depth of the dust cocoon, a dusty part of the accretion envelope, differs among the direct light from the stellar photosphere and the diffuse light re-emitted as dust thermal emission. As a result, varying the metallicity qualitatively changes the way that the radiative feedback suppresses the accretion flow. With a fixed accretion rate of , the both direct and diffuse lights jointly operate to prevent the mass accretion at . At , the diffuse light is no longer effective, and the direct light solely limits the mass accretion. At , the HII region formation plays an important role in terminating the accretion. The resultant upper mass limit increases with decreasing metallicity, from a few to over . We also illustrate how the radiation spectrum of massive star-forming cores changes with decreasing metallicity. First, the peak wavelength of the spectrum, which is located around at , shifts to at . Second, a characteristic feature at due to the amorphous silicate band appears as a dip at , but changes to a bump at . Using these spectral signatures, we can search massive accreting protostars in nearby low-metallicity environments with up-coming observations.
keywords:
accretion, accretion disks – stars: formation – stars: Population II – stars: massive star1 Introduction
Massive stars play pivotal roles in the formation and evolution of galaxies. They impact mechanical feedback to the interstellar medium, such as the formation and development of HII regions, wind-driven bubbles, and supernova remnants, which regulates the galactic-scale star formation activities. They also control the cosmic chemical evolution by forging and ejecting heavy elements in supernova explosions. Their roles would be more significant in young, low-metallicity galaxies. For instance, copious ionizing photons from massive stars in such galaxies may have caused the reionization of the universe. In understanding various aspects of the early structure formation, detailed knowledge of massive star formation in low-metallicity environments is essential.
The standard scenario postulates that the star formation begins with the cloud collapse which eventually produces an embryo protostar. The protostar then accretes the gas from a surrounding envelope, and grows in mass. The evolution in such a late accretion stage is vital for understanding the massive star formation (e.g., Zinnecker & Yorke, 2007), because the stellar luminosity also rapidly increases and potentially impacts the strong feedback which may halt the accretion. Since the final stellar mass is determined when the accretion ceases, understanding of the interplay between the radiative feedback and accretion flow is indispensable to derive how massive the star finally becomes. Regarding the present-day massive star formation, previous studies have shown that radiation pressure exerted on dust grains becomes strong enough to disturb the accretion flow (e.g., Larson & Starrfield, 1971; Kahn, 1974; Yorke & Krügel, 1977). In particular, under the assumption of the spherical symmetry, the accretion is terminated by such an effect before the stellar mass exceeds with , i.e., typical rates for the low-mass star formation (so-called “radiation pressure barrier”; Wolfire & Cassinelli, 1987). McKee & Tan (2003) proposed that the massive star formation actually occurs under some non-standard conditions such as massive dense cores supported by turbulence and/or magnetic fields, where the rapid accretion with is realized. Recent multi-dimensional simulations also show that the radiation pressure is less powerful than previously thought, because photons predominantly escape through less dense parts in the accretion envelope, e.g., polar directions in the case of the disk accretion (e.g., Yorke & Bodenheimer, 1999; Krumholz et al., 2009; Kuiper et al., 2010; Klassen et al., 2016; Rosen et al., 2016).
In the primordial star formation, on the other hand, there is no radiation-pressure barrier because of the lack of dust grains. A plausible mass limiting mechanism will be due to an HII region created around the protostar, as it expands through the accretion envelope owing to the excess gas pressure. Following pioneering studies assuming the spherical symmetry (e.g., Yorke, 1986; Omukai & Inutsuka, 2002, and references therein) , particular attention is paid to how the feedback operates in realistic situations such as the disk accretion in recent studies (e.g., Hollenbach et al., 1994; McKee & Tan, 2008; Hosokawa et al., 2011, 2016). Hosokawa et al. (2011) show that, once an HII region begins to expand dynamically through the accretion envelope, the gas infalling toward the disk is blown away, so that the mass supply onto the protostar is eventually suppressed. Note that the expansion of the HII region is driven by its gas pressure excess, and thus the resulting feedback essentially differs from that caused by the radiation pressure described above. The UV feedback potentially works also in the present-day cases (e.g., Yorke & Welz, 1996), but it is still uncertain how the radiation-pressure barrier and UV feedback jointly operate.
Although still in debate, the studies above clearly suggest that the radiative feedback works differently among the present-day and primordial massive star formation, implying its variations over metallicities. Hosokawa & Omukai (2009b) (hereafter HO09b) presented a study on such metallicity-dependence with a full coverage of assuming the spherical symmetry. They estimate the upper mass limits set by each feedback effect with simple analytic arguments. The accretion histories onto the protostar are obtained from the thermal evolutionary tracks of a collapsing core at various metallicities (Omukai et al., 2005). Their results are briefly summarized as follows. Since the average accretion rate is higher with the lower metallicity, the resulting protostellar evolution also differs with different metallicities. In addition, the accretion envelope has lower dust opacity for lower metallicity, the dominant feedback mechanism changes depending on metallicity. H09b have derived the upper mass limit as a function of the metallicity, which are set by the radiation pressure on dust grains for and by the expansion of the HII region for .
In this paper, we further improve our treatments to derive the metallicity-dependent upper stellar mass limits set by the protostellar feedback. First, our calculation covers a much broader range of the different accretion rates for a given metallicity, reflecting the fact that such diversity is commonly expected at both the solar and zero metallicities (e.g., McKee & Tan, 2003; Hirano, 2015). Second, in addition to the analytic approach employed in HO09b, we also investigate the radial structure of the accretion envelope by numerically solving the frequency-dependent radiation transport consistently through it. This allows us to derive radiation spectrum of massive star-forming cores at low metallicities, with which we predict their observational signatures. For instance, a low-metallicity massive protostar exhibits a broader and harder radiation spectrum than its solar-metallicity counterpart. Such characteristic features will be useful for future observational surveys for nearby low-metallicity massive protostars.
We organize the rest of the paper as follows. In Section 2, we first overview the protostellar evolution under different accretion rates and metallicities. We then analytically estimate the upper mass limits set by radiative feedback for a wide range of the accretion rates and metallicities in Section 3. Next, we construct numerical models of an accretion envelope around the protostar, through which the frequency-dependent radiative transfer is solved. Sections 4 and 5 are devoted to describe the method and results of such numerical modeling. In Section 6, we apply our numerical modeling to the typical accretion histories expected at each metallicity, and compare the results to our previous work H09b. Finally, our basic results are summarized with related discussions in Section 7. We also briefly describe methods used in our numerical modeling in Appendixes A and B.
2 Protostellar evolution
The strength of the protostellar radiation feedback depends on the stellar luminosity and effective temperature, which are given by solving the stellar interior structure. We have developed numerical models of the protostellar evolution in our previous studies (e.g., Hosokawa & Omukai, 2009a, for full details), which are briefly reviewed in what follows.
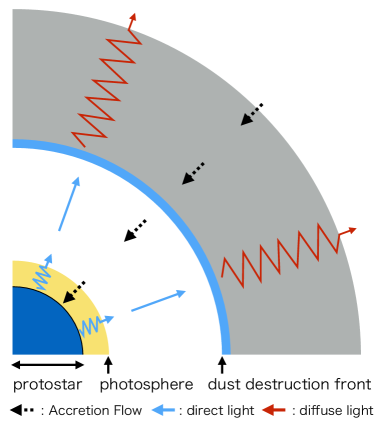
Figure 1 schematically shows the structure of an accretion envelope around a protostar at non-zero metallicity. The outermost part is the dust cocoon, where the gas falls toward the star together with dust grains. We assume that, throughout the paper, dust grains are perfectly coupled with the gas in their motion. In an inner side of the dust cocoon, the grains are heated up by the stellar irradiation and sublimate at the dust destruction front. The envelope is dust-free within this radius, where the gas is mostly optically thin for the stellar light owing to the small gas opacity. In a very vicinity of the star, however, even the dust-free flow becomes optically thick if the accretion rate is high enough. The photosphere appears where the gas is still in free-fall. For such a case, the position of the photosphere differs from that of the stellar surface, where the accreting gas hits on the star forming a shock front.
In the calculations of the protostellar evolution, we only solve the structure of the stellar interior and, if any, optically-thick part of the dust-free accretion flow. The structure of the outer accretion envelope is separately considered from the inner part (Section 4). We solve the so-called four stellar structure equations, i.e., continuity, hydrostatic balance, energy conservation and transport with taking account of effects of the mass accretion (e.g., Hosokawa & Omukai, 2009a). The outer boundary conditions are provided by the jump condition at the surface shock front (Stahler et al., 1980a; Hosokawa & Omukai, 2009a). If the dust-free flow remains optically thin until hitting the surface, we just assume a free-fall profile. Otherwise, we guess the position of the photospheric radius that satisfies , and solve the flow structure for using the diffusion approximation for the radiation transport. We construct a model which satisfies the outer boundary condition by an iterative shooting method (e.g., Stahler et al., 1980a; Hosokawa & Omukai, 2009a). Assuming the free-fall for the optically-thin part is not accurate because in the dust cocoon the flow may be substantially decelerated by the radiation pressure to deviate from the free-fall flow (see Section 5 below). Even for such a case, however, the gas is accelerated again by the gravitational pull once passing through the dust destruction front because the opacity is substantially reduced. As a result, the free-fall velocity is easily recovered.
We start an evolutionary calculation with an initial model with constructed following Stahler et al. (1980b). With a high accretion rate such as , we adopt the larger initial mass to facilitate the numerical convergence of the iterative process. The protostellar evolution does not differ with different initial models except in an early stage immediately after starting calculations.
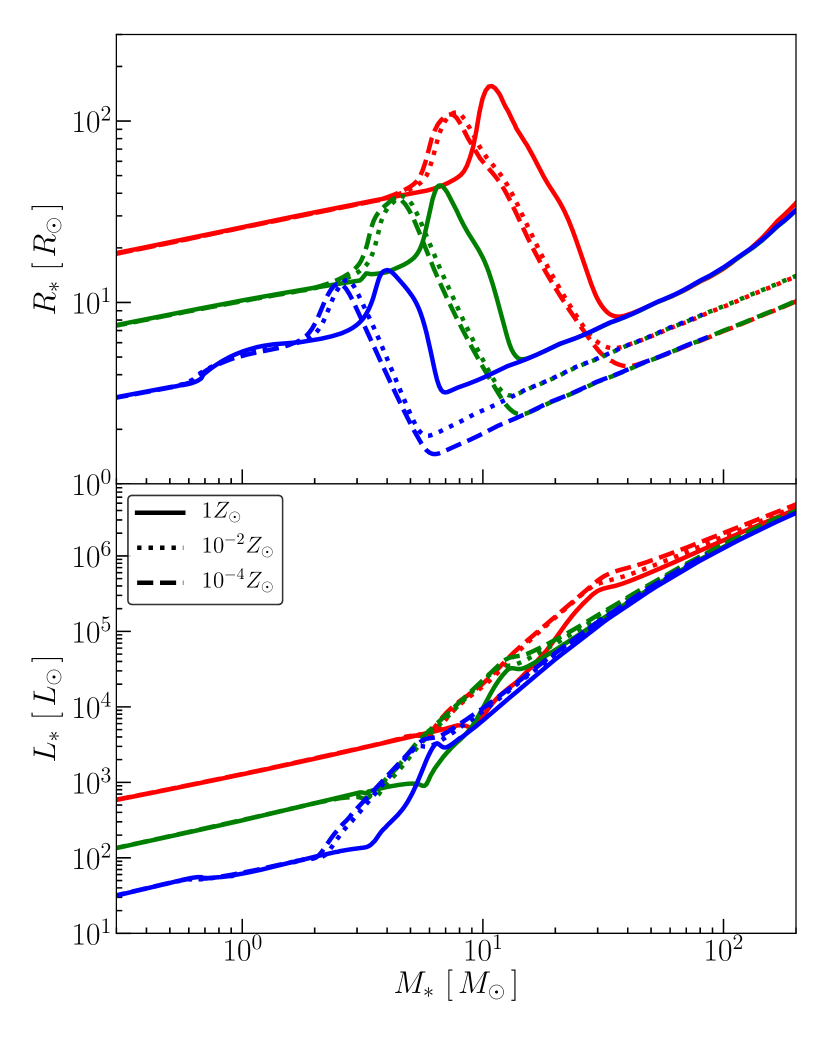
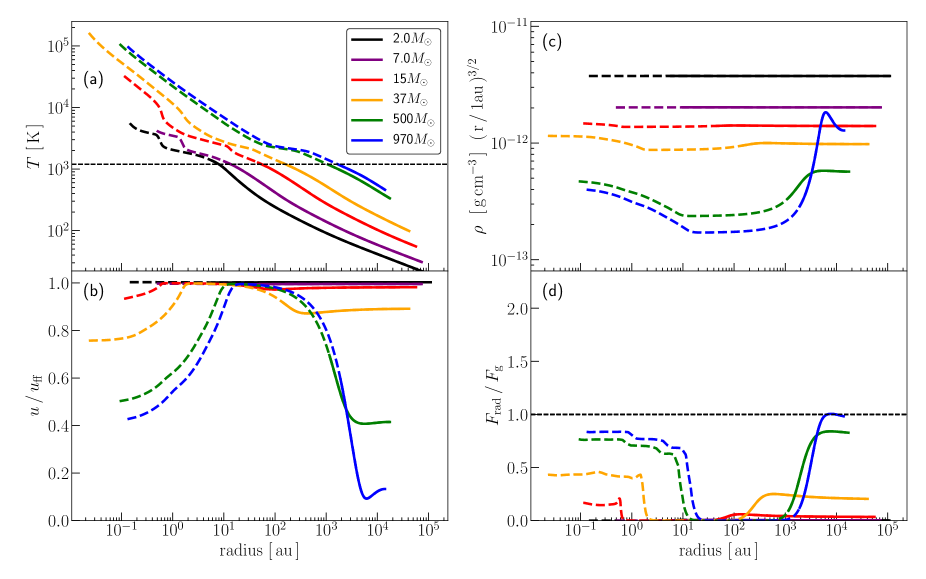
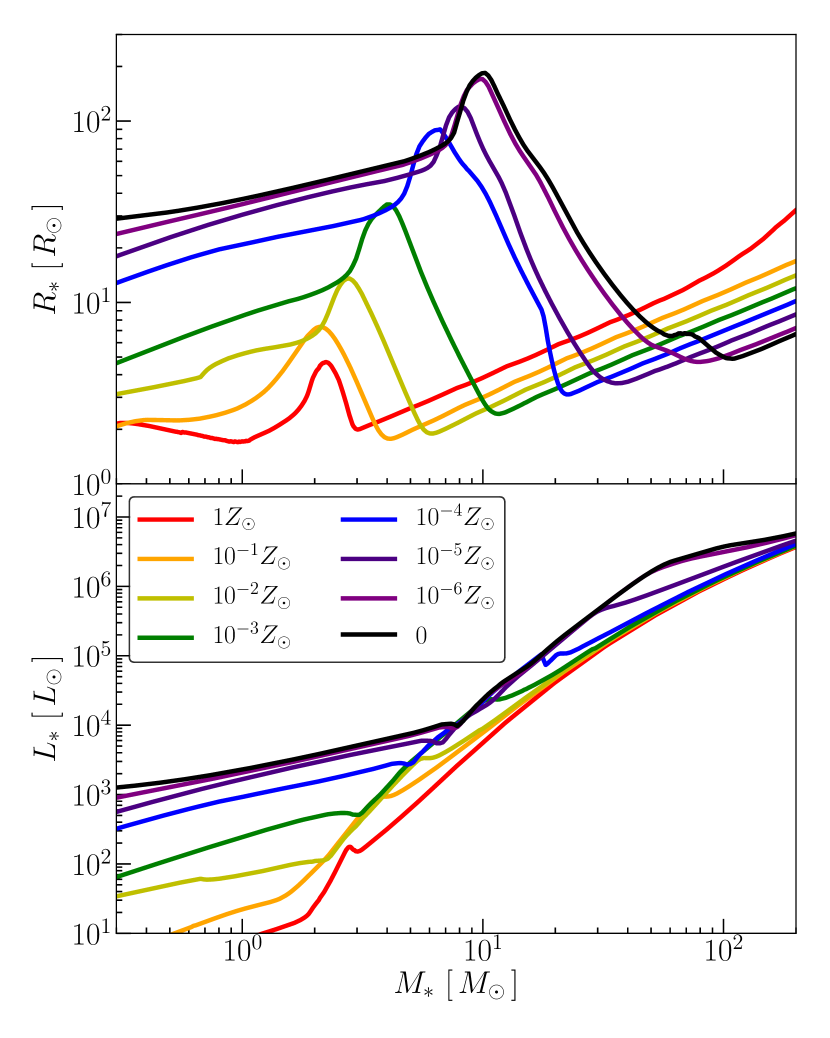
The evolution of the stellar luminosity and radius are shown in Figure 2 for some representative cases. Note that the total luminosity is the sum of the stellar interior luminosity and accretion luminosity . The protostellar evolution is divided into four characteristic stages (e.g., Hosokawa & Omukai, 2009a): (1) the adiabatic accretion (), (2) swelling (), (3) Kelvin-Helmholtz contraction (), and (4) main sequence accretion (), where the mass ranges are for the case with and . With lower metallicity, the transitions among the stages occur at lower stellar masses, except the arrival to the stage (4). The evolution in each stage is briefly described as follows:
-
(1)
adiabatic accretion: In the early stage where the protostar mass is small, the accretion time is smaller than Kelvin-Helmholtz time . The protostar evolves adiabatically because the amount of entropy brought into the star with the accretion flow is larger than that emitted by radiation. The evolution of the radius and luminosity shows no metallicity-dependencies.
-
(2)
swelling: The stellar radius temporarily increases to exceed at maximum, which is caused by the outward transport of the accumulated entropy in the stellar deep interior by the so-called luminosity wave (Stahler et al., 1986). With the same accretion rate, the swelling occurs at lower stellar mass with lower metallicity (top panel of Figure 2).
-
(3)
Kelvin-Helmholtz contraction: With the timescale balance of , the protostar is able to emit the internal energy by radiation and then contracts. This contraction continues until the interior temperature becomes high enough to commence hydrogen burning.
-
(4)
main sequence accretion: After the star enters this stage where the hydrogen burning takes place near the stellar center, the protostar radius becomes independent of the accretion rates. The low-metallicity stars cannot achieve efficient hydrogen burning via the CNO cycle with its original small abundance of metals. The protostar then continues to contract until CNO elements are additionally provided by the 3- reactions. At the lower metallicities, the radius of the main sequence star is thus smaller than its solar-metallicity counterpart.
3 Analytical estimate for upper mass limits
We first analytically estimate the upper stellar mass limits for various metallicities and accretion rates , using the protostellar evolution presented in the previous section. We consider the two feedback effects caused by the radiation pressure exerted on dust grains, and the formation of an HII region by ionizing photons.
Our calculation covers a broad range of the metallicity of . The mean accretion rate onto the protostar scales approximately with the temperature of a collapsing dense core as
| (1) |
where , , and are the Jeans mass, the free fall time, the sound speed and the gas temperature. Since the typical core temperature varies over the range depending on metallicity, the corresponding accretion rate covers (Omukai et al., 2005, HO09b). In this paper, we also consider that, even at the same metallicity, the mean accretion rates can be different to some extent. Recall that very rapid accretion with is postulated in high-mass star formation in the Milky Way, where the typical value for low-mass star formation is less than (e.g., McKee & Tan, 2003). In order to take such additional diversity into account, we examine the cases with different accretion rates , , and for each metallicity.
3.1 Optical depth of dust cocoon
In order to investigate the feedback caused by the radiation pressure, we first estimate the optical depth of the dust cocoon at a frequency by integrating outward from the dust destruction radius as
| (2) |
where we have used the continuity equation for spherically symmetric steady flow
| (3) |
and assumed the free-fall velocity for as
| (4) |
The radial position of the dust destruction front , which is still unknown in Equation (2), is estimated as follows. We assume that the temperature of dust grains is determined by the balance between the absorption and emission of photons. Since the dust evaporates at the sublimation temperature , such energy balance at is given by
| (5) |
Neglecting small opacity between the stellar photosphere and the dust destruction front, the mean intensity is written as
| (6) |
where is the stellar photosphere radius, and is effective temperature. We can derive by substituting Equation (5) into (6),
| (7) |
where the Planck mean opacity is defined by
| (8) |
and is
| (9) |
which is well approximated as because the effective temperature is sufficiently higher than .
3.2 Suppression mechanisms of mass accretion
3.2.1 Radiation pressure in dust cocoon
If the dust cocoon is optically thick for the stellar irradiation, most of photons coming from the stellar photosphere are absorbed and re-emitted as the dust thermal emission. Hereafter we call the former as the direct light, and the latter as the diffuse light. The optical depths of the dust cocoon for such direct and diffuse lights control how the radiation pressure affects the dusty accretion flow. For the direct light, we use the opacity at the frequency (or the wavelength ), where the Planck function with the typical stellar effective temperature, , takes the maximum value. For the diffuse component, on the other hand, the Rosseland mean opacity at K provides a good approximation. The numerical values for the direct and diffuse lights are and respectively, i.e., the former is 70 times larger than the latter.
The conditions for suppressing the mass accretion by the radiation pressure can be classified as in the following (i), (ii), and (iii), depending on whether the optical depths of the dust cocoon for the direct and diffuse lights, and , exceed the unity or not:
-
(i)
:
In this case, the direct light is absorbed and re-emitted in a thin layer near the dust destruction front. Since the dust cocoon is also optically thick for the diffuse light, the re-emitted IR photons proceed outward via diffusion. The total momentum received by the dust cocoon is(10) while the momentum carried by the absorbed direct light is . Hence, with , the radiation pressure caused by the diffuse light dominates the contribution from the direct light. The mass accretion is terminated when the stellar luminosity exceeds the Eddington value defined with the IR opacity (HO09b),
(11) -
(ii)
:
Although the direct light is absorbed near the dust destruction front as in case (a), the re-emitted IR diffuse light now escapes through the cocoon freely. The accretion flow receives the radiation pressure dominantly from the direct light. In a spherical shell near the dust destruction front where the direct light is totally absorbed, the accretion flow receives the momentum flux from the radiation. The accretion flow will be in stall if this momentum flux exceeds that by the accretion flow (Wolfire & Cassinelli, 1987), which is written as(12) Substituting equations (3) and (4), equation (12) becomes
(13) -
(iii)
:
Because the dust cocoon is optically thin, the direct light travels through the dust cocoon without being absorbed. In this case, the mass accretion can be hindered if the stellar luminosity exceeds the Eddington value defined with the UV opacity (HO09b), which is written as(14)
3.2.2 HII region formation
Ionizing photons emitted from a protostar create an HII region in its surroundings. When the HII region expands dynamically, mass accretion is terminated by the pressure gradient. The epoch when such strong feedback is impacted can be estimated by measuring the size of the HII region as follows.
First, the stellar emissivity of ionizing photons is given by
| (15) |
where , , and are the stellar effective temperature, radius, and the Lyman limit frequency. The radius of the HII region is determined by setting the supply rate of the ionizing photons equal to the consumption rate (e.g., Omukai & Inutsuka, 2002),
| (16) |
where is the case-B recombination coefficient. In Equation (16), the first term on the right hand side represents the recombination rate of ionized hydrogen, and the second term is the supply rate of neutral hydrogen carried into the HII region by the accretion flow. Since the second term is much smaller than the first term with the accretion rates considered in this paper, we ignore this term. The radial density distribution within the HII region, which is necessary in performing the integration in equation (16), is calculated in a following way. Since the gas receives the radiation pressure via the electron scattering within the HII region, the equation of motion is given by
| (17) |
where , and is the Eddington luminosity defined with the electron scattering opacity. We derive the density profile within the HII region using Equations (3), (4), and (17),
| (18) |
where we have assumed that the accretion flow is well described as the free-fall outside the HII region. Substituting Equation (18) into Equation (16) using for the fully ionized gas, we obtain
| (19) |
which is further transformed as
| (20) |
This equation suggests that the HII region rapidly expands once the stellar emissivity of ionizing photons exceeds a critical value (Yorke, 1986; Omukai & Inutsuka, 2002),
| (21) |
As a critical size of the HII region, we consider the gravitational radius for the ionized gas
| (22) |
where is the sound velocity of the photoionized gas. When the HII region is smaller than the gravitational radius, the gas plunges into the HII region at the supersonic velocity. The presence of the large pressure excess of the HII region never propagates to the outer neutral flow, so that the accretion is not hindered. Once the radius of the HII region exceeds the gravitational radius, however, the accretion flow has only subsonic velocity at the ionizing front. At this moment, the HII region begins to expand dynamically forming a preceding shock front, blowing away the accreting gas. Therefore, the condition for terminating the accretion by the formation of the HII region is given by
| (23) |
In this paper, in order to calculate and , we assume that the HII region temperature is , and use the recombination rate of hydrogen (Hummer & Storey, 1987), the electron scattering opacity and .
3.3 - and -dependence of upper stellar mass limits
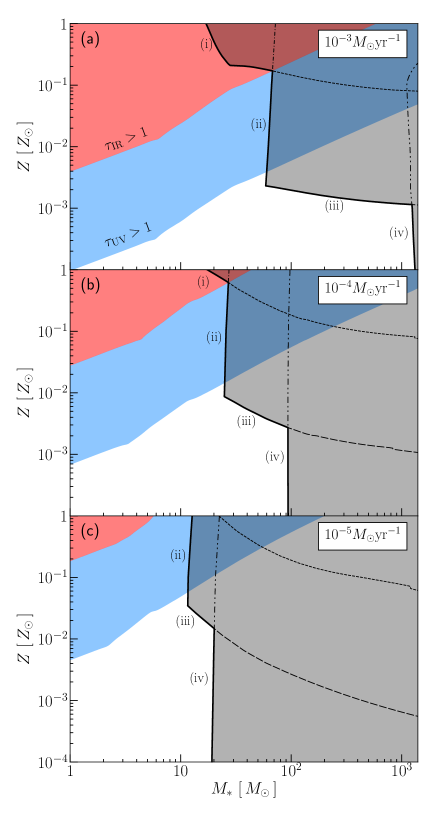
Figure 3 shows the analytically-estimated upper stellar mass limits for each metallicity with different accretion rates , , and . In each panel, the solid line represents the upper limits set by the feedback, i.e., the radiation pressure exerted on dust grains or the formation of an HII region. The grey shaded area indicates that the steady accretion is not allowed by such feedback effects. We can also see the contributions from the individual feedback effects: (i) radiation pressure on to the entire cocoon by the diffuse light (Eq. 11, short dashed lines), (ii) radiation pressure on to the dust destruction front (Eq. 13, dot-dashed lines), (iii) radiation pressure on to the entire cocoon by the direct light (Eq. 14, long dashed lines), and the formation of the HII region (Eq. 23, dot-dot-dashed lines).
First, we focus on the cases with the accretion rate (Fig. 3-a), which occur in the present-day high-mass star formation or low-metallicity environments where the accretion envelope has relatively high temperature. In this case, for , the radiation pressure caused by the diffuse light (e.g., Eq. 11) is most effective to limit the stellar mass. The upper mass limit is at , which increases with decreasing metallicity because the cocoon’s IR optical depth decreases. At the lower metallicities of , the radiation pressure at the dust destruction front provides the most stringent upper limits, which do not vary with at . The dust cocoon becomes optically thin for the stellar direct light even for at even lower metallicities in the range . The direct light is not absorbed at the dust destruction front any more, but travels freely through the dust cocoon. The radiation pressure by the direct light over the whole cocoon causes the strongest feedback at such metallicities. At , where the radiation pressure on dust grains becomes ineffective, the HII region formation is the primary feedback mechanism to terminate the mass accretion. In this case, the upper mass limit is about from Equation (23), and is hardly dependent on the metallicity. In summary, with the accretion rate , we can divide the metallicity range into three regions according to the dominant feedback mechanism : with the radiation pressure by the diffuse light through the dust cocoon, with the radiation pressure by the direct light at the dust destruction front, and with the HII region formation. We have ignored the narrow range where the radiation pressure through the cocoon by the direct light is most effective. The upper mass limit changes almost stepwise as , , and over these three ranges of metallicity.
Next, we consider the cases with the ten times lower accretion rate presented in Figure 3 (b). As in panel (a), the upper mass limit varies almost stepwise over different metallicities: (), (), and (). Mechanism of terminating the mass accretion changes with decreasing metallicity, in the same ordering as in the case of . At a fixed metallicity and stellar mass, the optical depths over the dust cocoon and are lower for the lower accretion rate. Therefore, the dominant feedback mechanism switches each other at higher metallicity than in the case of shown in panel (a). We also see that the upper mass limit is somewhat smaller than in panel (a), especially for , reflecting the -dependencies in the conditions given by equations (13) and (23).
In the same manner, Figure 3 (c) shows the cases with . In this case, at even , the dust cocoon is optically thin for the diffuse light (i.e., ) when the radiation feedback becomes strong enough to limit the accretion. As a result, the full range of the metallicity is divided into the two regions where the upper mass limits are for and for . With such a accretion rate, the formation of massive stars with is not allowed by the feedback effects even at the lowest metallicity .
Note that there is a critical metallicity , below which the radiation pressure becomes ineffective to terminate the mass accretion. Since the stellar luminosity never exceeds the usual Eddington value defined with the electron scattering opacity, radiation pressure on dust grains does not surpass the gravitational pull if the dust opacity for the direct light is smaller than the electron scattering opacity, i.e.,
| (24) |
This critical metallicity becomes important in the cases with , where the formation of the HII region sets the upper mass limits at . With the lower rates , however, the HII region formation is more effective than the radiation pressure at , and limits the accretion at the lower stellar masses (Eq. 23). As a result, the HII region formation sets the upper mass limits also at higher metallicities, .
In what follows, we present in more detail our numerical models of the accretion envelope fully coupled with frequency-dependent radiation transport. We derive the upper mass limits from such numerical modeling, and compare them to the analytic estimates above.
4 METHOD OF CALCULATIONS of accretion envelopes
In this section, we describe how we construct the numerical models of the accretion envelope, with which we investigate the upper stellar mass limits for various metallicities and accretion rates in Section 5. We determine the envelope structure consistently with the stellar evolution calculations presented in Section 2, i.e., with the stellar luminosity and radius for a given stellar model with the mass . For simplicity, we assume the spherically symmetric and steady accretion flows.
In the modeling of the accretion envelope, we construct solutions where the radial distributions of the density and temperature and those of the radiation energy density and flux are consistent with each other. The procedures are divided into the following two steps:
-
1.
For given radial profiles of the density and temperature , we calculate the radiative transfer to obtain the radiative energy-density and flux distributions.
-
2.
We then update the density and temperature distributions using the radiation field distribution obtained above.
We iterate the above two steps until we get numerical convergence, i.e., the distributions no longer change anywhere in the envelope.
4.1 Radiative transfer
We solve the frequency-dependent radiative transfer equation using the variable Eddington factor method (e.g., Mihalas & Weibel-Mihalas, 1984). Our calculation covers the wavelength range of ( in frequency) with 50 bins equally distributed on a logarithmic scale.
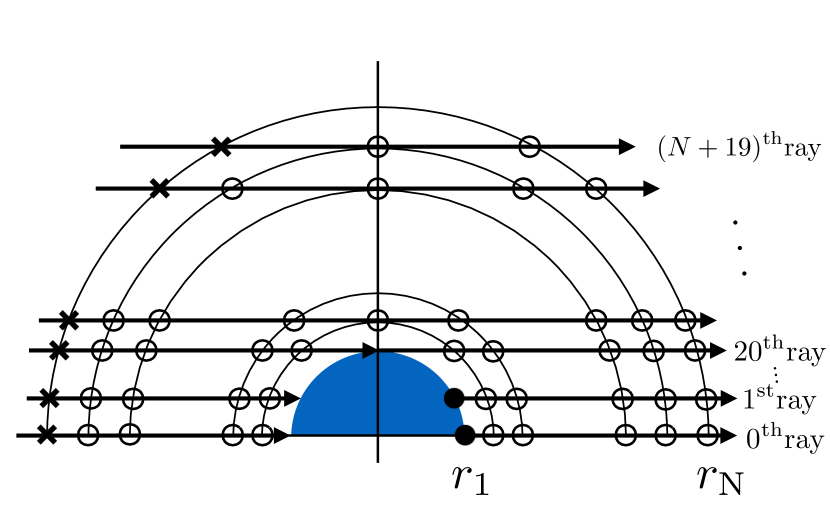
Figure 4 shows the geometry of rays along which we solve the radiative transfer equation
| (25) |
where is the intensity, the distance along a ray, the cosine between the ray and the line connecting a given point and the center, and the source function defined as
| (26) |
where and are the absorption and scattering opacity, and is the mean intensity. We set 20 rays passing through the protostar, and also put rays on the all spherical grids oriented in the tangential directions. To solve equation (4.1), is obtained with a given temperature distribution. With a guessed distribution of . we can solve the ray-tracing equations with the following boundary conditions. For the inner boundary condition, we assume the diffusion approximation
| (27) |
which is valid near the stellar surface except in a brief evolutionary stage where the protostar swells and the optical depth decreases. The temperature gradient in equation (27) is given by
| (28) |
where is written as
| (29) |
As for the outer boundary condition, we assume that no radiation comes into the computational domain. We calculate the Eddington factor with the intensity obtained by the ray-tracing,
| (30) |
with which we integrate the moment equations of the radiation transfer equation (4.1),
| (31) | |||
| (32) |
where and are the zeroth and the first moment of intensity. We construct the solution which satisfies the boundary conditions with a small number of iterations (typically dozens), by transforming the term in the source function (Eq. 26) into the form only including (see Appendix A for more details).
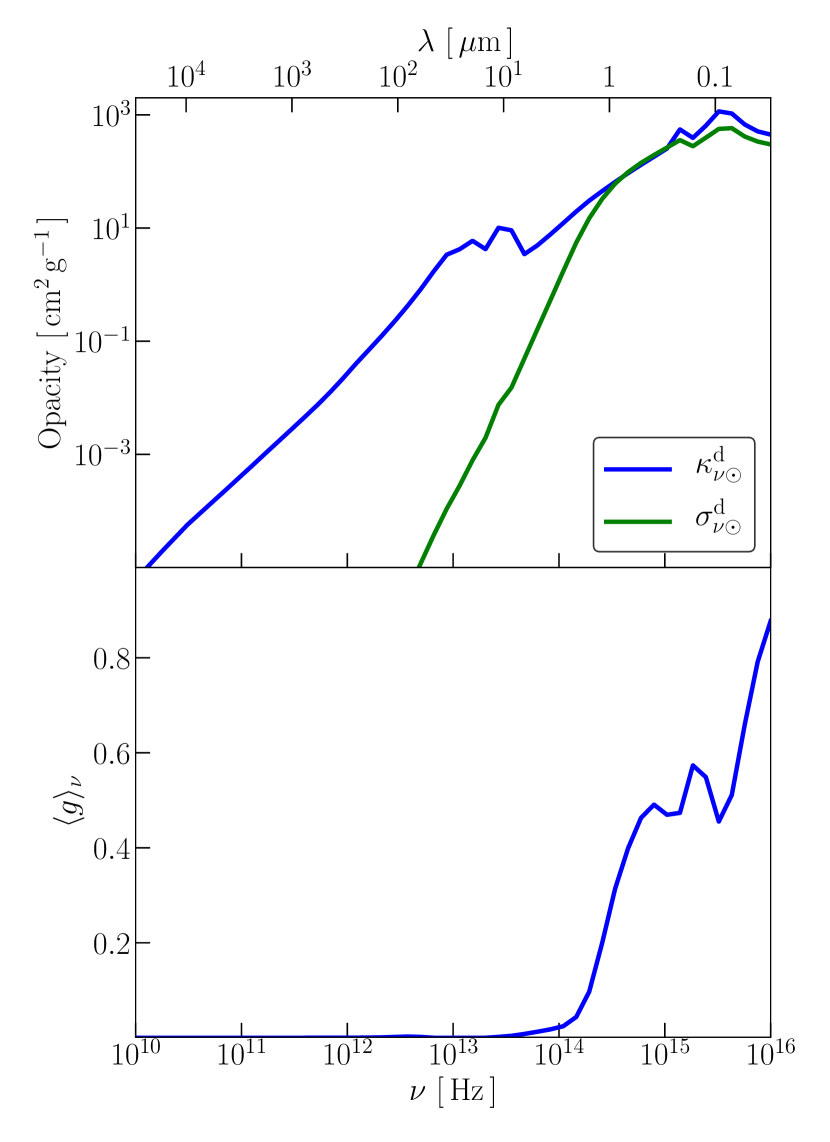
Figure 5 shows the frequency-dependent dust absorption and scattering opacity we adopt. Since the dust opacity has the strong frequency-dependence, the radiation pressure on the dust cocoon cannot be evaluated accurately without frequency-dependent radiative transfer calculations. (Wolfire & Cassinelli, 1986; Edgar & Clarke, 2003). We assume that the dust opacity is simply in proportion to the metallicity,
| (33) |
| (34) |
where is the rate of forward scattering. We use the interstellar values for , and as in Wolfire & Cassinelli (1986), also assuming the two components of graphite and silicate grains. The dust cross sections are calculated by means of the Mie theory (Bohren & Huffman, 1983; Wolfire & Cassinelli, 1986), using the dielectric functions given by Draine & Lee (1984) and Draine (2003). We assume the so-called MRN mixture (Mathis et al., 1977) for the grain size distribution,
| (35) |
where is the scale factor also by Draine & Lee (1984). The maximum and minimum grain sizes are and respectively.
The grains evaporate above the sublimation temperature
| (36) |
where , and (Isella & Natta, 2005). Since is small, the sublimation temperature depends only weakly on the density and typically K. We incorporate this effect by multiplying the opacity by a reduction factor ,
| (37) |
following Kuiper et al. (2010). Since we consider the gas opacity only for the absorption, we use
| (38) |
where is the gas opacity, and for the scattering
| (39) |
We use the grey gas opacity because it does not strongly depend on frequency in the relevant range in the stellar photosphere where the gas component dominates the opacity. We use the same opacity tables as in Hosokawa & Omukai (2009a): the OPAL tables for K (Igresias et al., 1996), and the tables given by Alexander et al. (1994) for K with modifications of removing the contribution from the dust grains (Asplund et al., 2005; Cunha et al., 2006).
4.2 Calculation of accretion flow structures
Next, we describe how to solve the flow structure, i.e., the radial distributions of density and temperature for the radiation field obtained by solving the radiative transfer equations (Sec. 4.1). Under the assumption of the spherical symmetry, the equation of motion is
| (40) |
where we ignore the term of the thermal pressure gradient which is sufficiently smaller than the radiation pressure and gravity terms (Wolfire & Cassinelli, 1987). With a constant accretion rate, the velocity distribution is translated into the density distribution using the continuity equation (3). The energy equation is
| (41) |
where is the internal energy per unit mass, and is the adiabatic exponent. We also assume the equation of state for the ideal gas. The radiative cooling rate is given by
| (42) |
where and represent the contributions by the continuum and H2 line emission,
| (43) |
where is the absorption opacity, and
| (44) |
where is the cooling rate via optically thin H2 emission, the line-averaged escape probability, and the continuum optical depth for the line emission. We approximate using a fitting formula given by Glover (2015). The escape probability is given as a function of the column density of hydrogen molecules
| (45) |
where is the number density of hydrogen molecules and is the outermost radius within which the Doppler shift caused by the flow velocity is less than the line width, (also see Appendix B for more details). The line cooling with other molecules such as and is ignored because its contribution is minor in comparison to the dust continuum cooling with the non-zero metallicities. In our models, in fact, the H2 line cooling is only effective in the primordial case. We calculate the chemical cooling rate as
| (46) |
where is chemical binding energy. We consider the species of and , whose abundances are obtained by solving the Saha equations.
We set the outer boundary at , where the density is assuming the free-fall profile (Wolfire & Cassinelli, 1987),
| (47) |
The velocity at is given as , where is the effective gravitational constant considering the radiation-pressure effect,
| (48) |
where . The temperature at the outer boundary is determined by the thermal balance between the compression heating and radiative cooling
| (49) |
Since the temperature in the dust cocoon is mostly determined by the local thermal balance between the absorption and emission of the continuum emission, i.e., in Equation (43), structure of the dust cocoon is actually insensitive to the outer boundary condition of the temperature.
5 Results for cases with constant accretion rates
We here see the evolution of envelope structures with constant accretion rates , , , and estimate the upper mass limits. We consider the variation of metallicities covering , , , , and for each accretion rate. Since the radiation pressure exerted on dust grains is not efficient for terminating the accretion flow at (Eq. 24), we only consider the cases with in our numerical calculations. Note that only the effect of the radiation pressure on the dust cocoon is consistently taken into account here. The effect of the feedback caused by an expanding HII region just follows our analytic consideration presented in Section 3.
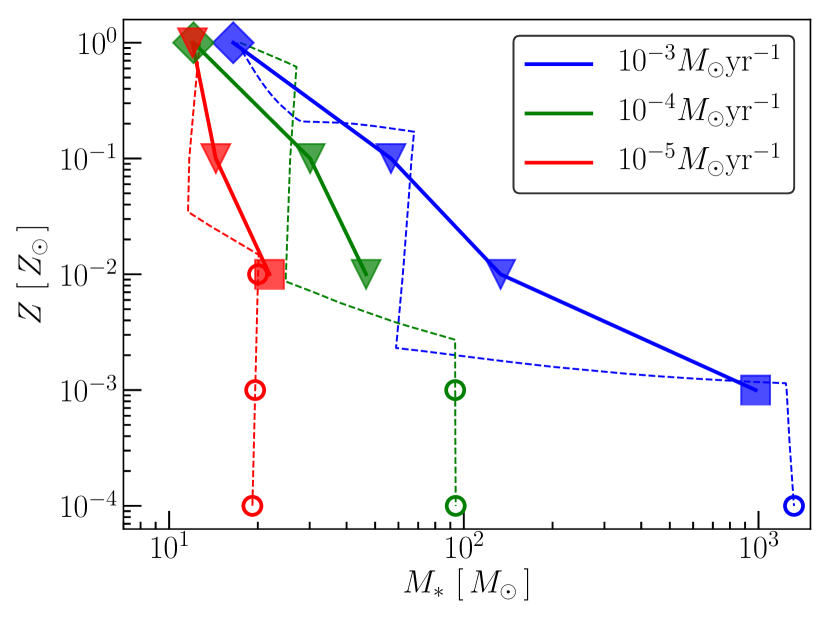
Before examining the numerical results in more detail, we overview the resulting upper mass limits for the various cases in Figure 6 (marked by the symbols , , and ). At lowest metallicities where the upper mass limits are set by the growth of HII regions, the limits by the analytic argument are indicated by circles . The analytical estimates given in Section 3 are also shown by the dashed lines for comparison. We see quite good agreements between the numerical and analytical results. The dominant feedback mechanisms are identical for almost all of the examined parameter space. Some disagreement appears only for the cases where the envelope is optically thick for the direct light but optically thin for the diffuse light (marked by the symbols ): the analytic argument tells that the upper limit should not depend on metallicity, while it actually increases with decreasing metallicity according to our numerical results.
Below we see the evolution of envelope structures in the order of decreasing the optical depth of the dust cocoon, where the radiation pressure operates in different ways to terminate the accretion flow.
5.1 Cases that the dust cocoon is optically thick to the diffuse light
We begin with the case of and . Our analytic model predicts that the accretion terminates at by the diffuse radiation pressure in this case, where the envelope remains optically thick to the diffuse light throughout the accretion stage (see Section 3).
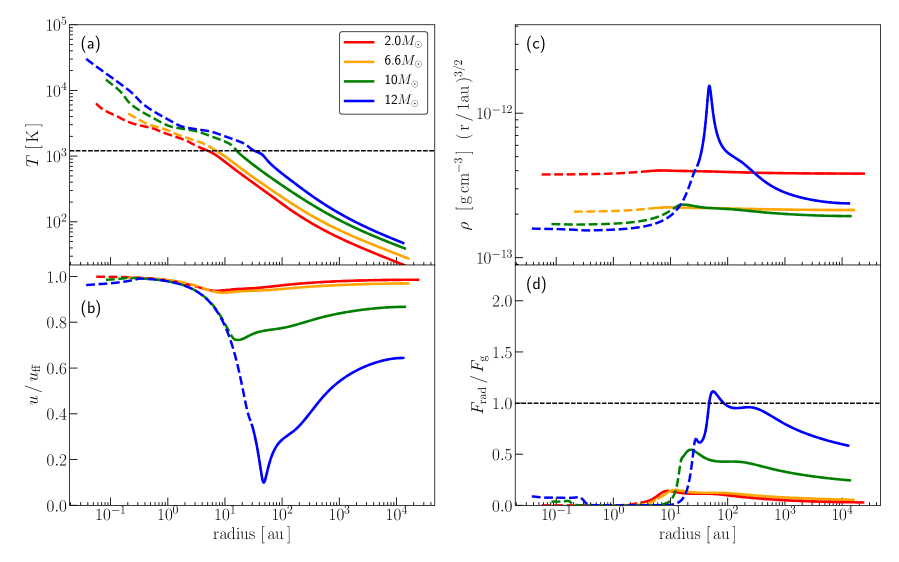
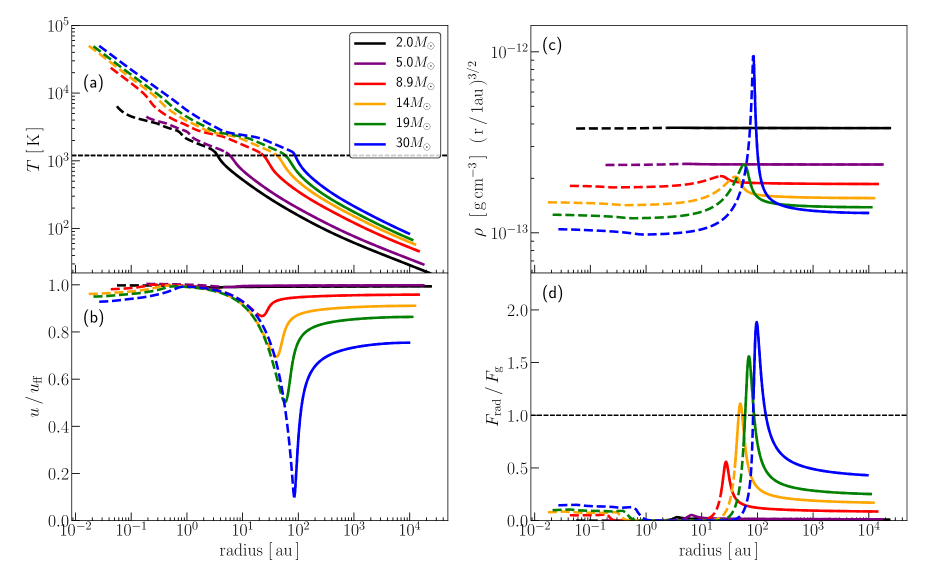
Figure 7 shows the distributions of the temperature, density, infall velocity, and the ratio of radiation pressure to the gravity force at different epochs in this case. The infall velocity is normalized by the free-fall velocity. The density distribution is plotted as to emphasize the deviation from that in the free-fall case (i.e., ). The solid part of the lines corresponds to the region where the dust is present, while the dashed part to the region where it has already been evaporated. Here, we consider the dust destruction radius as the point where the dust reduction factor defined by Equation (37) takes the value of 0.1. The four lines in each panel correspond to the different stages of the protostellar evolution: the adiabatic accretion (), swelling () and KH contraction phases (). Also at the final snapshot for , the accretion flow is being stopped by the radiation pressure.
Temperature is relatively low with around the outer boundary, but increases in the inner region. It reaches the dust sublimation value of at radius , depending on the protostellar mass. The temperature continues to rise inward also in the dust-free region up to the stellar surface. With increasing the protostellar mass and so the luminosity, the temperature is higher at a fixed radius because of the higher radiative heating. Note that the dust destruction front moves outwards with increasing the stellar mass since the dust sublimation temperature is constant at .
Radiation pressure to the accretion flow increases with growing stellar luminosity. While the protostar is still small ( and ), the flow is close to the free fall (Figure 7 b and d) due to negligible radiation pressure. Once the stellar mass exceeds , the radiation pressure effect becomes remarkable. Especially, when the stellar mass reaches , radiation pressure almost balances with the gravity within , and eventually exceeds it around . As a consequence, the flow is decelerated to 10 % of the free-fall velocity around . The slow-down of the flow also affects the density distribution. As seen in Figure 7 b, the density follows the free-fall law of at early epochs with and . At , however, the radiation pressure effect becomes conspicuous and a shell-like structure is formed at , where the radiation pressure effect is the most prominent.
Recall that, in Section 2, we have assumed the free-fall flow at the photosphere as the outer boundary condition for our numerical models of the accreting protostars. We note that this is always justified even if the accretion flow is greatly decelerated through the dust cocoon. For example, at the epoch of where the flow is remarkably decelerated at au, the flow accelerates again after passing through the dust destruction front owing to very small gas opacity. As a result, the velocity recovers the free-fall value before reaching . Our modeling of the accreting protostar and surrounding dust cocoon is thus consistent each other.
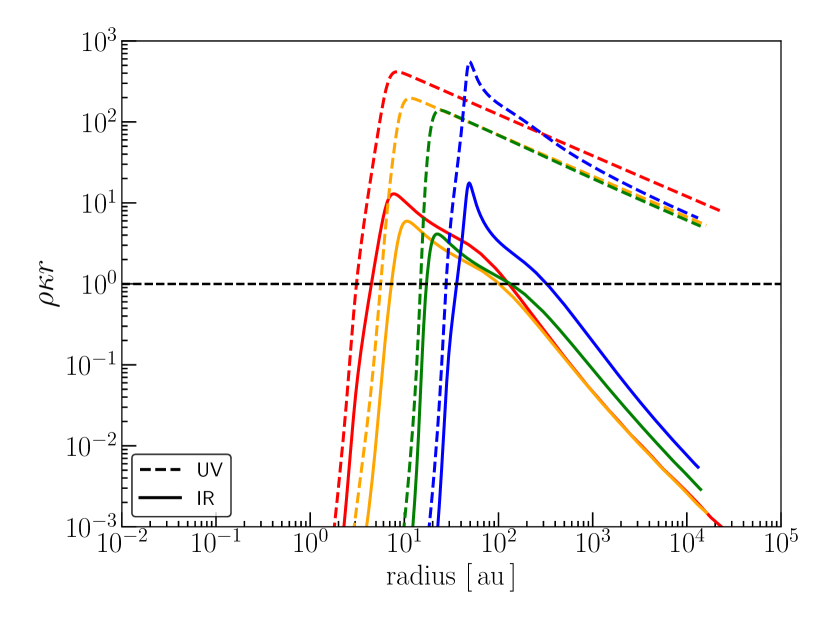
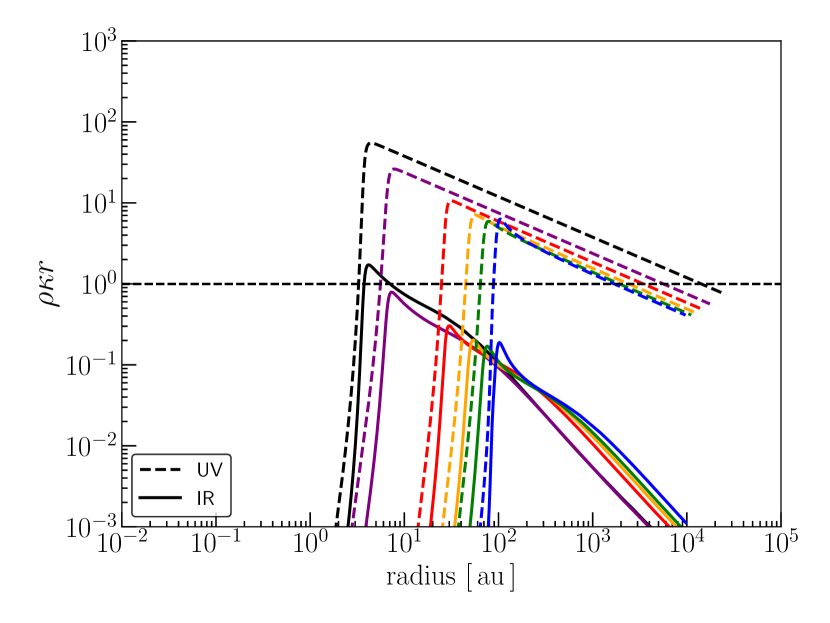
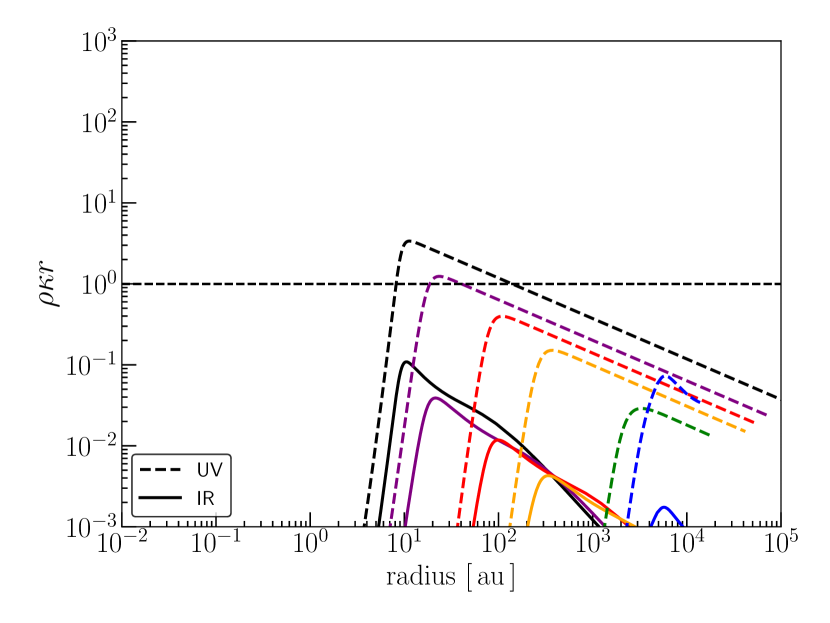
Figure 8 shows the radial distributions of the local optical depths for direct and diffuse light and , for the same epochs as in Figure 7. Here, the opacity for the direct light is estimated in the same way as in Section 3.1 and that for the diffuse light is given by the Rosseland mean opacity at each radius. The local optical depth is the ratio of the photon mean free path to the local physical scale, and also represents the contribution to the optical depth from each region on the logarithmic scale as . The cocoon is optically thick both to the direct and diffuse light near the dust destruction front, and the peak values of the local optical depths are and . Except the final epoch of , the peak values of and gradually decrease as the stellar mass increases, because the density decreases and the dust destruction front moves outward. In contrast, the peak becomes higher for than in the previous epochs since the density around the dust destruction front sharply increases due to the deceleration of the accretion flow.
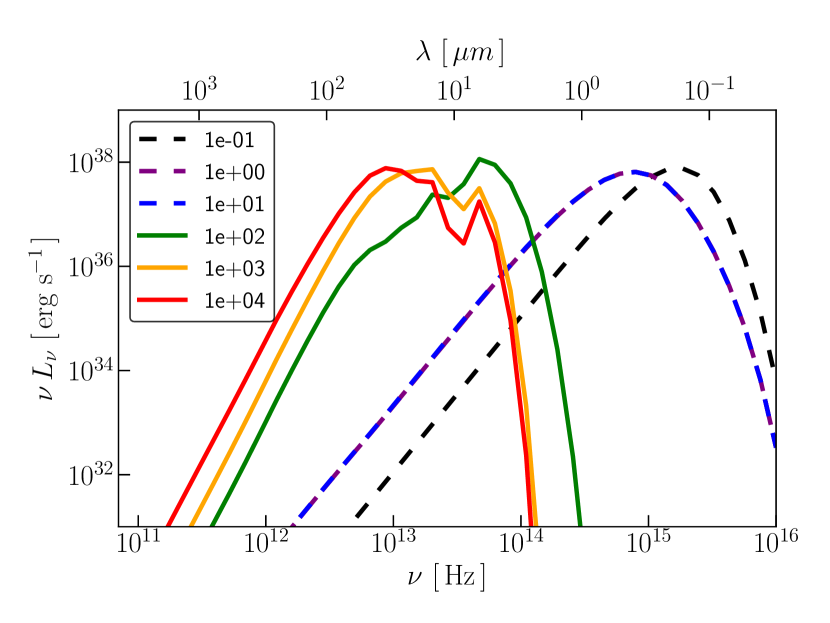
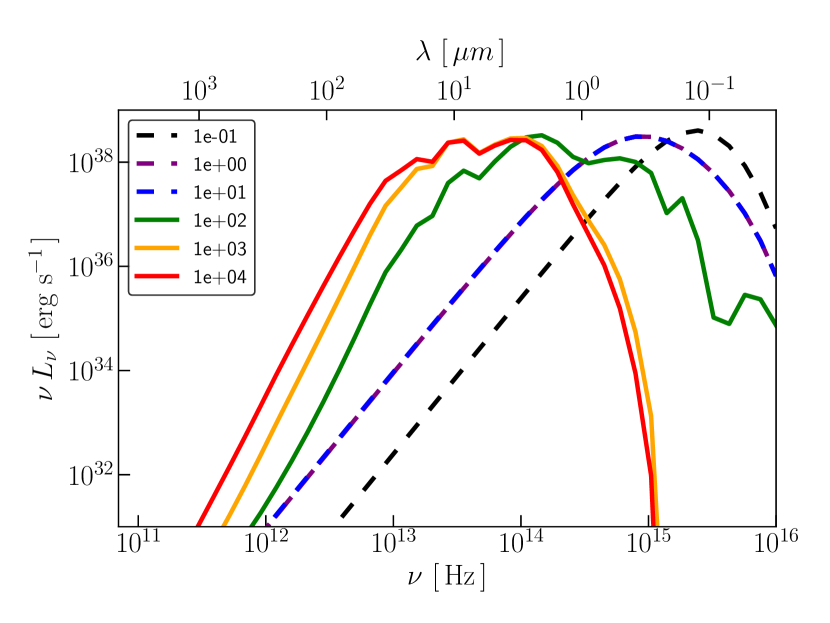
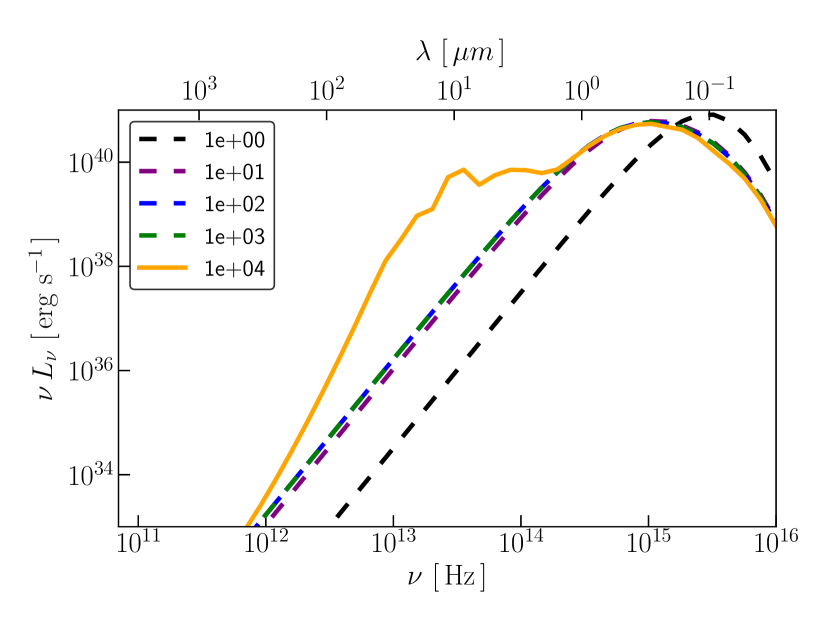
Next we show in Figure 9 the radiative energy distribution inside the envelope at the different radii and at the epoch of , when the radiation pressure almost halts the accretion flow. The dust destruction front locates at in this moment, and the solid (dashed) lines in this figure indicates those in the region where the dust is present (absent), respectively. Since the gas opacity is large in a hot environment near the protostar, the gas photosphere appears at . Inside the photosphere, the spectral peak shifts to the higher frequency as the measuring point approaches the star because the temperature rises. For example, the peak shifts from () at 1au, outside the gas photosphere, to () at , inside the photosphere. Between the gas photosphere and the dust destruction front (), the envelope is optically thin and the radiation field is dominated by the direct light from the photosphere, which is the blackbody at . Around the dust destruction front, the envelope is very optically thick and the direct light is absorbed and re-emitted by the dust grains. The main radiation component outside the dust destruction front () is the diffuse light, peaking at the infrared (). Outside the dust destruction front, the optical depth exceeds unity even for the diffuse light up to , and the absorption and re-emission repeatedly occurs. The radiation pressure almost balances the gravity in this region, and the flow velocity is nearly constant. We can see that the flow is mostly decelerated around outside the dust destruction front, where re-emitted diffuse light is the dominant radiation component. Finally, observed from outside, the spectrum peaks around , corresponding to the dust photospheric temperature of . The dip around comes from the presence of the silicate feature in the absorption opacity in this wavelength range (Figure 5). Owing to the large absorption opacity, only photons emitted from outer cold regions can escape from the cocoon, so the radiation intensity becomes weak in this band.
5.2 Cases that the envelope is optically thick to the direct light but thin to the diffuse light
Next, we see the case of and as an example. According to the analysis in Section 3, the dust cocoon is always optically thick to the direct light while it becomes optically thin to the diffuse light for . Also, it is predicted that the accretion flow is halted at by radiation force by the direct light exerted on the dust destruction front (Eq. 13 and Sec. 3.2.1).
As in Figure 7, Figure 10 shows the envelope structure in this case at six different evolutionary stages: the adiabatic accretion (), swelling (), KH contraction (), and main sequence accretion ( and ) phases. At the final epoch at , the accretion flow is being stopped by the radiation force.
As in the case seen in Section 5.1, the flow is almost the free fall when the protostar is small ( and ; Figure 10 b and d). For , the radiation force becomes as large as the gravitational attraction near the dust destruction front. When the protostellar mass exceeds , the radiation force exceeds the gravity around and decelerates the flow. At , the radiation force reaches about twice the gravity at , and the accretion flow is decelerated to 10% of the free fall velocity. Unlike the case in Section 5.1 (at ), here the radiation force by the diffuse light, which is dominant outside a few 10 au, is only half of the gravity. But more inside, the deceleration by the direct light sharply occurs in a narrow region around the dust destruction front. As a result, the density rises more steeply, and a thinner shell-like structure is formed than seen in Section 5.1 (Figure 10 c).
The local optical depths to the direct () and diffuse light () are shown in Figure 11. The peak values of both and decrease with the protostellar mass, except for the final phase of , where the density is enhanced around the dust destruction front due to the deceleration. The cocoon is always optically thick to the direct light, with maximum . To the diffuse light, on the other hand, while the cocoon is marginally optically thick with at early stages ( and ), it becomes optically thin for .
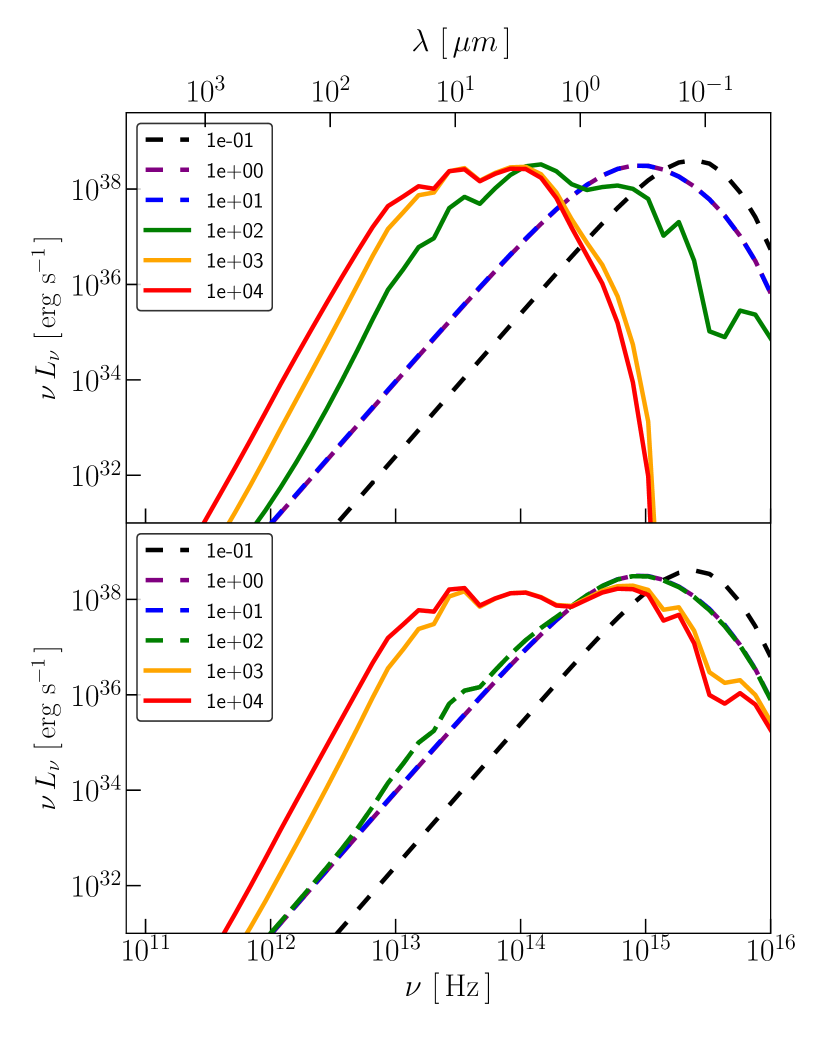
Next, in Figure 12, the radiative energy distribution is shown at different radii (, and ) at the protostellar mass of , where the accretion flow is decelerated remarkably by the radiation force. The dust destruction front is around : the inner three spectra () are those inside the dust free region and the rest () are in the dusty region. In the inner optically thin region (), the spectrum is of the black-body at emitted from the gas photosphere, peaking at (). This direct light is absorbed and re-emitted at the dust destruction front. In the spectrum at we can see that the direct light at has been absorbed and re-emitted as the diffuse light. Since the dust cocoon is optically thin to the diffuse light, photons re-emitted at the dust destruction front escapes freely without absorption. In the outer dusty region ( and ), the radiation field is dominated by that re-emitted component at the dust destruction front, which peaks at () corresponding to the dust sublimation temperature . Since the dust cocoon is optically thin to the diffuse light, the spectrum is hardly modified and can be directly observed from outside. Contrary to those shown in Figure 9, a bump appears around in the spectrum. This is because more radiation is re-emitted at this frequency range due to the higher value of opacity (Figure 5).
5.3 Cases that the envelope is optically thin also to the direct light
Finally, we see the case of and . According to the analytic argument in Section 3, the dust cocoon is always optically thin both to the diffuse and direct light. The upper mass limit is predicted as (Sec. 3.2.1) due to radiation force by the direct light in the optically thin envelope and also to the expansion of the HII region. Note that the effect of the HII region formation is not included in the current numerical model but is estimated by the analytic argument.
The evolution of the envelope structure is shown in Figure 13, where the six lines correspond to epochs of the adiabatic accretion (), swelling (), KH contraction () and main sequence accretion ( and ), respectively. At , accretion flow is being stopped by the radiation pressure.
The radiation force becomes conspicuous when the protostar becomes more massive than . Unlike the cases seen above in Sections 5.1 and 5.2, radiation pressure becomes strong near the inner and outer boundaries (Figure 13 d). Around the outer boundary, the dust grains work as the opacity source. Since the envelope is very optically thin and the direct light is hardly attenuated, the ratio of radiation pressure to gravity remains constant. On the other hand, the opacity in the inner region is dominated by the electron scattering. For , although the photoionization is not taken into account in this calculation, thermal ionization proceeds in the region where the temperature exceeds near the star (Figure 13 a, b and d). This ionized region expands with the growth of the protostar owing to the increasing radiative heating. Next, we see the case of , where the flow is remarkably decelerated by the radiation force. Already at the outer boundary, the inflow is slow with only 20% of the free-fall velocity. Subsequently, the flow is decelerated to 10% of the free-fall velocity by the radiation force at . Since the envelope is very optically thin, the radiation force is dominated by the direct radiation. Further inside, although the flow is once accelerated after the dust sublimation and reaches almost the free fall velocity around as a result of the decrease of opacity and so radiation pressure, the ionization of gas raises the opacity near the star () and the flow becomes as slow as 40% of the free fall again. Note also the density enhancement accompanying the slow down of the flow in the outer () and inner () regions (Figure 13 c).
Figure 14 shows the local optical depths for the direct and diffuse light. Again those values decrease with the protostellar mass except for the final epoch of . The envelope is optically thin to the diffuse light for any mass range and also to the direct light for .
Figure 15 shows the radiative energy distribution at different radii for the final epoch . The dust destruction front locates at and the inner three radii shown () correspond to the dust-free region and the outermost one () is in the dusty region. In the inner dust-free region, the radiation field is dominated by the direct light in the black-body shape peaking at (). From the comparison between the spectra in the dust-free () and in the dusty () regions, we see that the direct light is hardly absorbed in the envelope although with slight modification. For example, the bump around in the spectrum at is due to the re-emitted radiation by the dust grains as in Figure 12.
5.4 Comparison between numerical and analytical results
In our spherically symmetric steady-flow framework, we cannot follow the evolution until the flow completely halts. Here, as a guide, we choose the epoch when the flow velocity falls to 1/10 of the free-fall velocity as the end of the accretion and obtain the stellar upper mass limit. The upper mass limit obtained in this way has been presented in Figure 6. Somewhat different choice of this criterion changes the result only moderately since the protostellar luminosity and thus its radiation pressure on to the flow increases rapidly beyond this mass. If we continued calculation after this point, the flow would be ever decelerated and more gas accumulates in a shell-like structure. In such a situation, the thermal pressure, which is neglected here, can be important as the flow becomes subsonic (see Figures 7 and 10). Although we can imagine the flow solutions where thermal pressure force in the shell pushes the gas inward against the radiation force, this is an artifact of spherical symmetry assumption. The shell-like structure would not be maintained in realistic multi-dimensional situation by growth of non-spherical perturbation (e.g., Krumholz et al., 2009) . Here, since our aim is to estimate the epoch when the stellar radiation feedback on to the flow becomes remarkable and we are not interested in detailed shell structure when the flow is very decelerated, our neglect of thermal pressure is justified.
The different symbols in Figure 6 represent difference in the way the radiation force works on the flow in the final stage, i.e., (i) the dust cocoon is optically thick also to the diffuse light and deceleration of the flow is mainly caused by diffuse light, (ii) the dust cocoon is optically thick to the direct light but thin to the diffuse light, and deceleration is mainly by the direct light at the dust destruction front, and (iii) the dust cocoon is optically thin also to the direct light and deceleration by direct light occurs in the entire dust cocoon. In addition, at very low metallicities where the HII region expansion is predicted by the analytic argument to be more effective than the radiation force in halting the accretion, the analytic estimate by Equation (23) is plotted instead as the upper limit. Here, when the cocoon is optically thick to the direct light, we have classified the cases (i) or (ii) according to whether the contribution to the radiation force is dominated by the direct light or by the diffuse light at the radius where the ratio of radiation pressure and gravity becomes maximum. Since the former is , where, is the optical depth between the dust destruction front and for direct light, and the latter is , the case (i), i.e., the former is higher than the latter, corresponds to , and vice versa. Here, we have used from Section 3.2.1.
The numerical and analytical results shown in Figure 6 are in good agreement each other in the cases that (i) the dust cocoon is optically thick for diffuse light and (iii) optically thin for direct light, but there is some discrepancy in the case (ii) where the flow is stopped by radiation pressure of direct light at the dust destruction front. In particular, in the case (ii), the analytic estimate for the upper mass limit does not depend on the metallicity (Eq. 13), while the numerical ones increase toward lower metallicities. This comes from breakdown of the assumption in the analytical estimate that all the direct light is absorbed at the dust destruction front (Eq. 12). In reality, a part of the radiation escapes without being absorbed in low-metallicity cases, where the optical depth is relatively small. Toward the lower metallicity, the momentum received by the accretion flow from the direct light thus decreases so that the upper mass limits increases. To illustrate this effect, we show the radiative energy distributions in the two cases where , , and in Figure 16. In both cases, the dominant radiative feedback is by the radiation force at the dust destruction front. For , we can see that the direct light peaking at () is totally absorbed and re-emitted in the dust cocoon, and the radiation field outside consists only of the diffuse component (top panel of Figure 16). On the other hand, in the case of , as seen in the spectra at and , a part of the direct light escapes from the dust cocoon without absorption (bottom panel of Figure 16 ). The dust opacity has frequency-dependence as shown in Figure 5 and decreases toward longer wavelengths from where energy distribution of the direct light becomes maximum, e.g., the absorption opacity becomes at . This value is 1/5 smaller than the opacity, , used for the analytical estimate for the optical depth, , in Section 3. Therefore, the cocoon becomes optically thin for the direct light at even if the optical depth is in our analytical framework. In this case, radiation pressure becomes weaker than estimated in Equation (12) because longer-wavelength photons can escape through the cocoon. In the analytical estimate, Equation (12) is only applicable when the dust cocoon becomes optically thick for all main components of the direct light. For the cocoon to be optically thick also to those long-wavelength photons around and Equation (12) to be usable, is required in the analytical estimate.
6 Results for cases with metallicity-dependent accretion histories
So far, the accretion rate is treated as a free parameter and arbitrarily chosen for a given metallicity. In reality, the accretion rate should depend on the temperature during the pre-stellar collapse (Eq. 1), which is controlled by the amount of dust grains and heavy elements, i.e., metallicity.
In this section, we use accretion history derived from temperature evolution during the collapse for each metallicity and estimate the upper mass limit as a function of metallicity. The accretion rates adopted here are shown in Figure 17, which is the same as in HO09b, who derived those rates from the temperature evolution by the one-zone calculation of Omukai et al. (2005). With those accretion histories, we solve protostellar evolution as in Section 2. The obtained evolution of the stellar radii and luminosities are summarized in Figure 18.
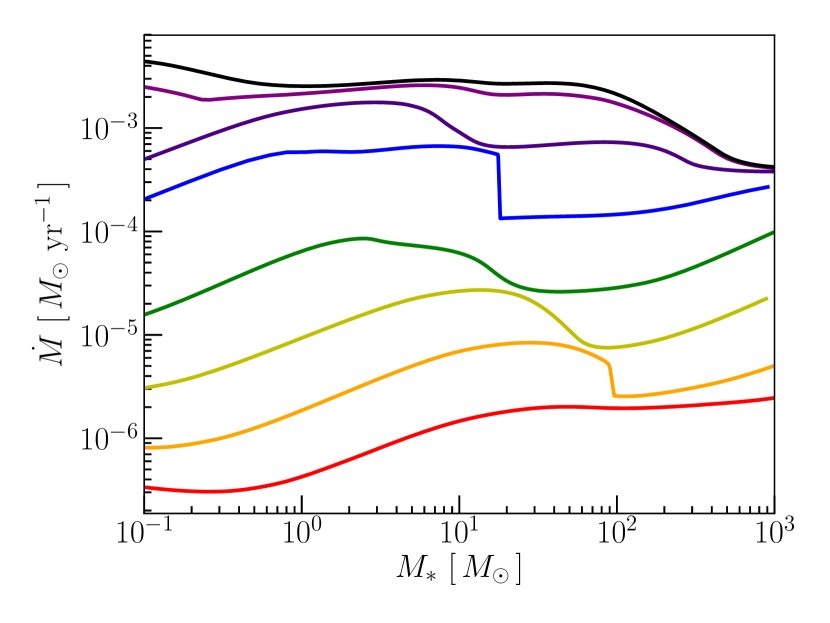
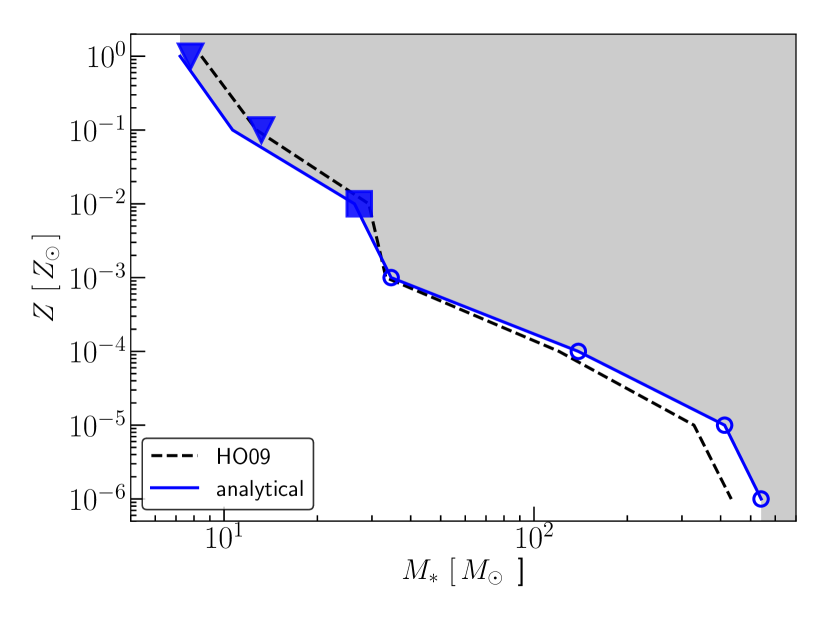
The upper mass limit by the analytical argument in Section 3.2 is presented in Figure 19 for the accretion histories shown in Figure 17. The meaning of lines are the same as in Figure 3, but the limits are calculated only at metallicities where the accretion histories are given. In Section 3 (Figure 3), at relatively high metallicity, the diffuse radiation force is important in terminating accretion. Here, however, such a situation does not appear for any metallicity since the accretion rate is very small in cases with relatively high metallicity () and the envelope is optically thin to the diffuse light. In such cases, the dust cocoon is optically thick to the direct light and the radiation force at the dust destruction front sets the upper mass limit at by Equation (13). With metallicity as low as , the dust cocoon becomes transparent also to the direct light. Thus, the direct light exerts the radiation force in the entire dust cocoon, setting the upper mass limit at by Equation (14). With even lower metallicity of , the dominant feedback is by the expansion of the HII region, and the upper limit is given by Equation (23), which depends only on the accretion rate. With lower metallicity, the accretion rate becomes higher and the upper mass limit by the HII-region expansion increases, which is at , and at , respectively. In Figure 19, the analytic estimate by HO09 is also shown (dashed line). This is very close to our numerical estimate, but there is slight differences. Firstly, HO09 set the dust destruction front radius at , which is smaller than the value used here. This results in slightly lower upper limit than ours (Eq. 13) at . Secondly, HO09 assumed the free-fall density distribution in estimating the effect of the HII region expansion, while we here take into account the radiation pressure effect on to the flow and so the density is enhanced from theirs (Eq. 20). Thus, the upper mass limit becomes higher in our case because more ionizing photons are needed for the expansion of HII region. However, both of the above have just minor effects.
As in Section 5, we calculate the envelope evolution numerically to find the upper mass limits, which are shown in Figure 19 by the same symbols as in Figure 6. With relatively high metallicities of and , the upper limits are and respectively, set by the radiation pressure at the dust destruction front. At metallicity of , the dust cocoon becomes transparent also to the direct light, which finally limits the accretion at via the radiation pressure working on the entire dust cocoon. At metallicity , the radiation feedback does not become significant before reaching , the analytical estimate for the maximum mass by the HII region expansion. With even lower metallicities, the upper limits are all set by the HII region feedback. Note that the upper limits by the radiative feedback agree surprisingly well with the analytical estimates in all the metallicity range. At metallicity , although the optical depth to the direct light is close to unity, and so the numerical result is larger than the analytical value as mentioned in Section 5.4, this difference remains very small.
7 Conclusion and Discussion
We have calculated the evolution of accreting protostars and its envelope structures for different metallicities assuming the spherically symmetric steady accretion. By regarding the moment when the strong radiative feedback decelerates the accretion flow down to 10% of the free-fall velocity as the epoch when the accretion ceases, we have derived the upper stellar mass limits. First we have investigated the cases with various parameter sets of accretion rates ,, and metallicities , , , , . We then have studied the cases where the accretion histories are determined by the thermal evolution in the prestellar collapse, which varies with different metallicities. We have also compared the numerical results to our previous analytic estimates , and found that the analytical estimates are in good agreement with the numerical results. Our findings can be summarized as follows.
-
–
The upper mass limit is set by the radiation force on to the dust cocoon in relatively metal-enriched cases with , and increases toward lower metallicity for a fixed constant accretion rate. At even lower metallicities, the HII region expansion terminates the mass accretion and the upper limit in this case does not depend on the metallicity for the same accretion rate.
-
–
At the constant accretion rate of , which is roughly the typical value for the present-day high-mass star formation as well as in primordial star formation, the radiation force on to the dust cocoon terminates the protostellar accretion when the protostar becomes massive enough in cases with metallicity higher than . The upper mass limit increases with decreasing metallicity from (at ), (at ) to (at ). The radiative feedback can be classified in to three cases according to the optical thickness of the dusty envelope. With high enough metallicity (), the dusty envelope is optically thick not only to the direct stellar light but also to the re-emitted infrared light. In such cases, the radiation feedback is dominated by the re-emitted light and its effect on the flow is most important outside the dust destruction front. With lower metallicity (), the dusty envelope becomes optically thick to the direct light but is still thin to the diffuse light. In this case, the radiation force by direct light at the dust destruction front works as the dominant feedback mechanism to terminate the accretion. With metallicity below , the envelope becomes optically thin also to the diffuse light and the direct radiation force is exerted to the entire dusty envelope. At such low metallicities, the expansion of the HII region is actually more effective in terminating the accretion. The upper mass limit by this mechanism is for this accretion rate and does not depend on the metallicity.
- –
-
–
When the accretion-rate history estimated from the prestellar thermal evolution at each metallicity is used, the maximum mass increases more rapidly toward lower metallicities than in the case of constant accretion rate since the accretion rate also becomes higher at lower metallicities. In this case, the radiation feedback to the dust cocoon sets the maximum mass for and this limit increases from (at ) to (at ). Below , the HII-region expansion instead limits the stellar mass growth and the maximum mass increases from at to at as a result of the increase in the accretion rate. Our numerical results in this case are in very good agreement with the analytic estimate by HO09.
Although with simplistic assumptions of the spherically symmetric and steady state accretion, the upper mass limits obtained here would give a rough guide for the epoch when accretion growth of stars is strongly hindered by the stellar feedback. Based on this result, we here discuss possible variations of the stellar mass as a function of metallicity. At metallicity as high as , regardless of the accretion rate, stars more massive than cannot be formed by the spherical accretion. In contrast, for metallicity , stars more massive than dozens of the sun can easily be formed as long as the accretion rate is higher than . Somewhat dramatic jump in the maximum mass occurs at metallicity between and : it is in the range of , but reaches at (see Figures 3 and 6). This jump in the upper mass limit might also be imprinted in the shape of the stellar IMF at this metallicity range. Observationally, the slope of the IMF of star clusters and OB associations in low-metallicity environments such as in the Magellanic Clouds is very similar to that in the Milky Way (e.g., Bastian et al., 2010). The metallicity effects on IMF might just be masked or compensated by other factors affecting the stellar mass as well such as the fragmentation properties during the prestallar collapse, turbulence etc. (Kroupa, 2001). Also, while no star with the initial mass higher than has not been found in our Galaxy, those with more than appear to exist in the Large Magellanic Cloud (Crowther et al., 2010). This difference in the cut-off in the IMF may come from the metallicity effect on the stellar feedback.
With even lower metallicity of , the maximum mass is limited by the HII-region expansion and depends only on the accretion rate, rather than on the metallicity. In this case, the accretion evolution of protostars becomes almost identical to that of the primordial stars, for which three dimensional simulations predict that very massive stars with can be formed (Hosokawa et al., 2016). Nonetheless, the effects of finite metallicity may change the evolution. For instance, presence of a small amount of heavy elements will modify the structure of the HII region, via additional cooling and absorption of UV photons. We will take these effects into account in future studies.
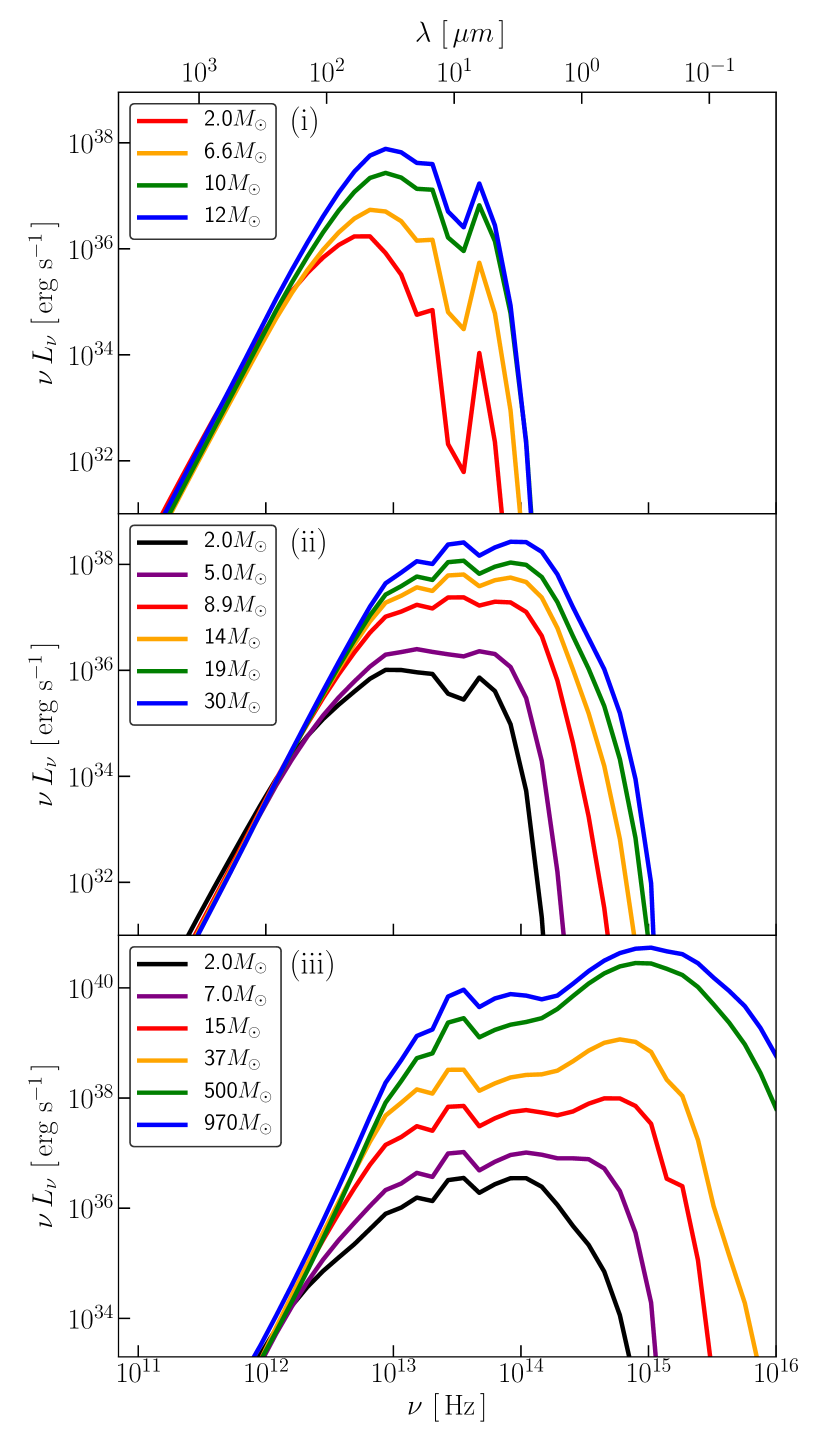
The way that the radiation force disturbs the accretion flow qualitatively differs with different optical depths of the dust cocoon, as seen in this paper. We can investigate whether the stellar direct light is converted to the diffuse light through the dust cocoon to terminate the accretion by observing the spectral energy distributions of protostars. Figure 20 shows such spectral features of accreting protostars seen from outside for three optical-depth regimes: (i) , (ii) , and (iii) . In the optically thick case shown in the panel (i), the temperature of the dust photosphere is low at a few 100 K and the spectral peak is around through the protostar phase. The silicate feature by the stretching mode of the Si-O bond appears as a dip in the spectrum. In the intermediate optical depth case shown in panel (ii), the radiation is emitted from the dust destruction front at and the spectrum peaks at . In the mid-infrared, the spectrum is very flat with the feature appearing as a bump, unlike in panel (i). In the optically thin case shown in panel (iii), the direct light from the protostar dominates the spectrum, peaking at the UV to optical bands. The feature appears as a bump as in (ii).
Finally, we discuss a few effects which were not included in our numerical modeling. Although we have regarded the moment that the flow velocity in the envelope falls below 1/10 of the free-fall value at some radius as the termination epoch of the accretion, strictly speaking the stars can continue to grow even after that in our spherical accretion framework. From the fact that the luminosity increases rapidly and radiation feedback becomes correspondingly intense toward higher masses, we expect that the accretion rate is greatly reduced slightly after the stellar mass exceeds our upper limit and the accretion will be stopped before long. Nonetheless, multi-dimensional effects must be important. In fact, stars much larger than our spherical limits are found even in the solar neighborhood. This discrepancy is just the radiation-pressure barrier described in Section 1, and will be attributable to the three-dimentional nature of the accretion. In a realistic situation, a circumstellar disk is formed due to the finite angular momentum and accretion proceeds through the disk. Radiation thus escapes preferentially in the polar directions perpendicular to the disk, and the radiative feedback to the matter behind the disk becomes weaker. In addition, even the gas in the polar direction, which receives more direct light, might be able to accrete owing to the Rayleigh-Taylor instability at the dust destruction front (Rosen et al., 2016; Krumholz et al., 2009, but see Klassen et al. 2016; Kuiper et al. 2012). As a result of these processes, stars much more massive than the spherical limit could be formed (Yorke & Bodenheimer, 1999; Krumholz et al., 2009; Kuiper et al., 2012; Tanaka et al., 2017). Those multi-dimensional studies are mostly for , and further studies are still awaited for the cases with the lower metallicities.
We have assumed that dust grains are dynamically coupled with the gas. The radiation force on dust grains is transferred to the gas via drag force by collision. The assumption of the gas and dust coupling breaks down if the velocity offset between the dust and the gas becomes comparable to the flow velocity. We here estimate their velocity offset considering the balance between the radiation and drag forces on the grains (Wolfire & Cassinelli, 1987). Note that the gravity on grains is negligible compared to the radiation force. Radiation force onto a grain with radius is
| (50) |
where is the extinction efficiency factor and . Drag force is given by (Draine & Salpeter, 1979),
| (51) |
where . When the grains completely decouple from the gas, the relative velocity becomes supersonic and so . From , the relative velocity becomes
| (52) |
or in terms of the ratio with the free-fall velocity (Eq. 4),
| (53) |
The value of differs greatly between the direct and the diffuse light. For example, graphite grains of have for the direct light at , while for the diffuse light at . This means that the decoupling between the dust and gas occurs when the dust envelope is optically thin for the direct light. In this case, radiation force on to the flow is reduced from our estimate because the grains are removed from the envelope and the opacity decreases. Without radiation feedback onto the dust cocoon, the maximum mass in this case would be set by the HII-region expansion. Recall, however, that optically-thin direct light terminates the accretion only in a very limited range in metallicity (see Figs. 6 and 19). Note also that the drift velocity by Equation (53) is an upper limit since the Coulomb drag effect (Draine & Salpeter, 1979) is not considered. For charged grains, larger drag by this effect keeps the gas-dust coupling well. For those reasons, we expect that the gas-dust decoupling does not affect the upper mass limit in most of the metallicity range.
Acknowledgements
The authors wish to express our cordial thanks to Prof. Takahiro Tanaka for his continual interest and advice. We also thank Daisuke Nakauchi, Kazu Sugimura, Sanemichi Takahashi, Hidekazu Tanaka and Hide Yajima for fruitful discussions. This work is supported in part by MEXT/JSPS KAKENHI Grant Number (KO:25287040, 17H01102, TH:16H05996).
| Temperature ( K ) | ||||||
|---|---|---|---|---|---|---|
| T < 1000 | ||||||
| 1000 < T < 4000 | ||||||
| 4000 < T |
References
- Alexander et al. (1994) Alexander D. R., Ferguson J. W., 1994, ApJ, 437, 879
- Asplund et al. (2005) Asplund M., Grevesse N., Sauval A. J., 2005, in ASP Conf. Ser. 336, Transiting Extrasolar Planets Workshop, ed. C. Alfonso, D. Weldrake, Th. Henning (San Francisco; CA: ASP), 25
- Bastian et al. (2010) Bastian N., Covey K. R., Meyer M. R., 2010, ARA & A, 48, 339
- Bohren & Huffman (1983) Bohren C. F., Huffman D. R., 1983, Absorption and Scattering of Light by Small Particles (New York: Wiley)
- Borysow et al. (1989) Borysow A., Frommhold L., Moraldi M., 1989, ApJ, 336, 495
- Cunha et al. (2006) Cunha K., Hubeny I., Lanz T., 2006, ApJ, 647, L143
- Crowther et al. (2010) Crowther P. A., Schnerr O., Hirschi R., Yusof N., Parker R. J., Goodwin S. P., Kassim H. A., 2010, MNRAS, 408, 731
- Draine & Lee (1984) Draine B. T., Lee H. M., 1984, ApJ, 285, 89
- Draine & Salpeter (1979) Draine B. T., Salpeter E. E., 1979, ApJ, 231, 77
- Draine (2003) Draine B. T., 2003, ApJ, 598, 1026
- Edgar & Clarke (2003) Edgar R., Clarke C., 2003, MNRAS, 338, 962
- Glover (2015) Glover S. C. O., 2015, MNRAS, 453, 2901
- Hirano (2015) Hirano S., Hosokawa T., Yoshida N., Omukai K., Yorke H. W., 2015, MNRAS, 448, 568
- Hummer & Storey (1987) Hummer D. G., Storey P. J., 1987, MNRAS, 224, 801
- Hollenbach et al. (1994) Hollenbach D., Johnstone D., Lizano S., Shu F., 1994, ApJ, 428, 654
- Hosokawa & Omukai (2009a) Hosokawa T., Omukai K., 2009a, ApJ, 691, 823
- Hosokawa & Omukai (2009b) Hosokawa T., Omukai K., 2009b, ApJ, 703, 1810 (HO09b)
- Hosokawa et al. (2011) Hosokawa T., Omukai K., Yoshida N., Yorke H. W., 2011, Science, 334, 1250
- Hosokawa et al. (2016) Hosokawa T., Hirano S., Kuiper R., Yorke H. W., Omukai K., Yoshida N., 2016, ApJ, 824, 119
- Igresias et al. (1996) Igresias C. A., Rogers F. J., 1996, ApJ, 464, 943
- Isella & Natta (2005) Isella A., Natta A., 2005, A&A, 438, 899
- Kahn (1974) Kahn F. D., 1974, A&A, 37, 149
- Klassen et al. (2016) Klassen M., Pudritz R. E., Kuiper R., Peters T., Banerjee R., 2016, ApJ, 823, 28
- Kroupa (2001) Kroupa P., 2001, MNRAS, 322, 231
- Krumholz et al. (2009) Krumholz M. R., Klein R. I., McKee C. F., Offner S. S. R., Cunningham A. J., 2009, Science, 323, 754
- Kuiper et al. (2010) Kuiper R., Klahr H., Beuther H., Henning T., 2010, ApJ, 722,1556
- Kuiper et al. (2012) Kuiper R., Klahr H., Beuther H., Henning T., 2012, A&A, 537, A122
- Larson & Starrfield (1971) Larson R. B., Starrfield S., 1971, A&A, 13, 190
- Mathis et al. (1977) Mathis J. S., Rumpl W., Nordsieck K. H., 1977, ApJ, 217, 425
- McKee & Tan (2003) McKee C. F., Tan J. C., 2003, ApJ, 585, 850
- McKee & Tan (2008) McKee C. F., Tan J. C., 2008, ApJ,681,771
- Mihalas & Weibel-Mihalas (1984) Mihalas D., Weibel-Mihalas B., 1984, Foundations of Radiation Hydrodynamics (New York: Oxford Univ. Press)
- Omukai (2000) Omukai K., 2000, ApJ, 534, 809
- Omukai & Inutsuka (2002) Omukai K., Inutsuka S., 2002, MNRAS, 332, 59
- Omukai et al. (2005) Omukai K., Tsuribe T., Schneider R., Ferrara A., 2005, ApJ, 626, 627
- Rosen et al. (2016) Rosen L. A., Krumholz M. R., McKee C. F., Klein R. I., 2016, MNRAS, 463, 2553
- Stahler et al. (1986) Stahler S. W., Palla F., Salpeter E. E., 1986, ApJ, 302, 590
- Stahler et al. (1980a) Stahler S. W., Shu F. H., Taam R. E., 1980a, ApJ, 241, 637
- Stahler et al. (1980b) Stahler S. W., Shu F. H., Taam R. E., 1980b, ApJ, 242, 226
- Stahler et al. (1980b) Stahler S. W., Shu F. H., Taam R. E., 1980b, ApJ, 242, 226
- Tanaka et al. (2017) Tanaka K. E. I., Tan J. C., Zhang Y., 2017, ApJ, 835, 32
- Wolniewicz et al. (1998) Wolniewicz L., Simbotin I., Dalgarno A., 1998, ApJS, 115, 293
- Wolfire & Cassinelli (1986) Wolfire M. G., Cassinelli J. P., 1986, ApJ, 236,201
- Wolfire & Cassinelli (1987) Wolfire M. G., Cassinelli J. P., 1987, ApJ, 319, 850
- Yorke & Krügel (1977) Yorke H. W., Krügel E., 1977, A&A, 54, 183
- Yorke (1986) Yorke H. W., 1986, ARA&A, 24, 49
- Yorke & Bodenheimer (1999) Yorke H. W., Bodenheimer P., 1999, ApJ, 525, 330
- Yorke & Welz (1996) Yorke H. W., Welz A., 1996, A&A, 315, 555
- Zinnecker & Yorke (2007) Zinnecker H., Yorke H. W., 2007, ARA&A, 45, 481
Appendix A Method for radiative transfer calculation
The source function in the momentum equation (31) is given by Equation (26), which contains . To accelerate the convergence of iterative calculation, we need to give the source function as an explicit function of in the following way (Mihalas & Weibel-Mihalas, 1984). By rewriting Equation (41) as
| (54) |
and using Equation (54), we can write the source function (Eq. 26) as
| (55) |
With Equation (55), the source function is evaluated to satisfy Equation (54) about when we integrate the moment equations of the radiation transfer equations (Eq. 31 and 32). In this method, the effect of changing the value of is instantly reflected to the source function , so the convergence of solution becomes faster.
We calculate the envelope structure in the following way. For a guessed radial distributions of the density and temperature , we solve the radiative transfer equation (Eq. 4.1) by the ray-tracing method and obtain the Eddington factor (Eq. 30). For this distribution, the terms on the right hand side of Equation (55) except , i.e., , , and , are evaluated. Using obtained and expression for (Eq. 55 ), we calculate the zeroth and the first moments of intensity, , by Equations (31) and (32). We then solve Equations (3), (40) and (41) and update the guess for the density and temperature distributions using obtained . We repeat this procedure until the guessed and obtained distributions converge anywhere in the envelope.
Appendix B Escape probability for the H2 line photons
The escape probability of H2 line photons in Equation (44) is given by product of that by self-absorption and by the continuum absorption:
| (56) |
where is the optical depth of the continuum component . The average escape probability for the lines is calculated for a slab of the H2 column density and temperature . We consider rovibrational levels in the range and , whose energy levels are taken from Borysow et al. (1989) and the spontaneous radiative transition coefficients between them are from Wolniewicz et al. (1998). The level populations are assumed to be in the local thermodynamic equilibrium and the photon escape fraction in individual lines is given by (see e.g., Omukai, 2000). The result is fitted in a functional form as
| (57) |
where
| (58) |
and
| (59) |