Ultrafast Electronic Dynamics of a Weyl Semimetal MoTe2 Revealed by Time and Angle Resolved Photoemission Spectroscopy
Abstract
A Weyl semimetal is a new type of topological quantum phase with intriguing physics near the Weyl nodes. Although the equilibrium state of Weyl semimetals has been investigated, the ultrafast dynamics near the Weyl node in the nonequilibrium state is still missing. Here by performing time and angle resolved photoemission spectroscopy on type-II Weyl semimetal MoTe2, we reveal the dispersion of the unoccupied states and identify the Weyl node at 70 meV above EF. Moreover, by tracking the ultrafast relaxation dynamics near the Weyl node upon photo-excitation with energy, momentum and temporal resolution, two intrinsic recovery timescales are observed, a fast one of 430 fs and a slow one of 4.1 ps, which are associated with hot electron cooling by optical phonon cascade emission and anharmonic decay of hot optical phonons respectively. The electron population shows a metallic response, and the two temperature model fitting of the transient electronic temperature gives an electron-phonon coupling constant of . Our work provides important dynamic information for understanding the relaxation mechanism of a Weyl semimetal and for exploiting potential applications using ultrafast optical control.
I INTRODUCTION
Three-dimensional (3D) Weyl semimetal WanXG ; WeylRMP is a novel topological phase hosting 3D Weyl fermions originally proposed in high-energy physics. Their electronic structures are characterized by conical dispersion near the Weyl nodes and open Fermi arcs connecting Weyl nodes with opposite chiralities xu2015discovery ; lv2015experimental ; FangZTaAs . Weyl semimetals exhibit novel quantum phenomena such as chiral anomaly ChenGFPRX ; JiaSNatComm2016 and interesting optical properties governed by chirality, e.g., light induced photocurrent ishizuka2016PRL ; chan2017photocurrents ; de2017QPGE ; ma2017WeylChirality , giant anisotropic nonlinear optical response OrensteinSHG and photoinduced topological phase transition chan2016Weyl ; hubener2017FloquetWSM . Moreover, it has been reported that the Weyl nodes can be selectively excited and controlled by circularly polarized light DaiXTRARPES ; ma2017WeylChirality . Such selective control of the Weyl nodes may provide new opportunities for device applications in analogy to the selective control of valley polarizations in valleytronics CuiXDValley ; HeinzValley ; FengJ . Understanding the dynamic evolution of photo-excited carriers near the Weyl node is critical for revealing the intriguing physics and for exploiting potential applications using ultrafast optical control zhu2017Cd3As2 . So far experimental research on Weyl semimetals has been focused on the equilibrium states, while dynamic information about the relaxation of charge carriers upon transient photo-excitation is still missing.
Recently, type-II Weyl semimetal with Weyl Fermions emerging at the topologically protected touching points between electron and hole pockets has been proposed soluyanov2015type and realized experimentally in the Td phase of MoTe2 kedeng2016MoTe2 ; huang2016spectroscopic . Signatures of the topological Fermi arcs have been revealed by angle resolved photoemission spectroscopy (ARPES) kedeng2016MoTe2 ; huang2016spectroscopic and quasi-particle interference (QPI) pattern in scanning tunneling microscopy (STM) kedeng2016MoTe2 ; zheng2016atomic ; russmann2017STM . However, the Weyl nodes are above the Fermi energy EF, making it challenging for conventional ARPES to resolve the dispersion near the Weyl node. Here by performing time and angle resolved photoemission spectroscopy (TR-ARPES), we reveal the electronic dispersion near the Weyl node and confirm the Weyl node at 70 meV above EF. Furthermore, by tracking the nonequilibrium states in the momentum space upon photo-excitation, we reveal the ultrafast relaxation dynamics near the Weyl node. Two intrinsic timescales are observed in the relaxation process with 430 femtoseconds (fs) and 4.1 picoseconds (ps), indicating two distinct relaxation channels. In addition, the electron population shows a metallic response and the two temperature model (TTM) fitting gives the second moment of Eliashberg electron-phonon (-) coupling function, 32 1.2 . Our work provides important information for understanding the ultrafast dynamics of a photo-excited Weyl semimetal.
II EXPERIMENTAL RESULTS
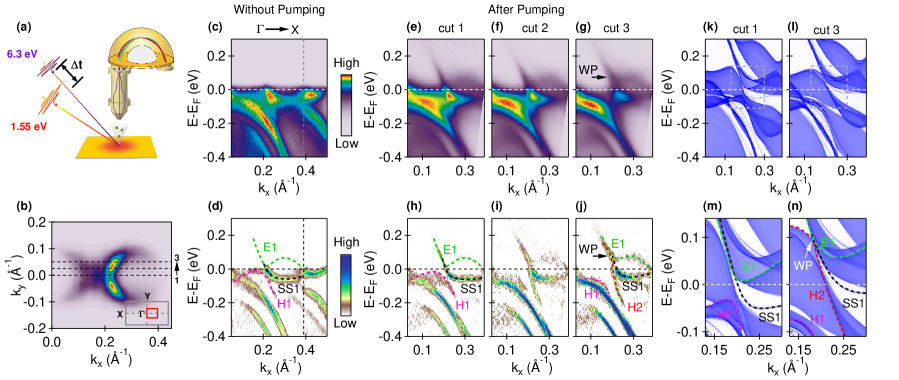
Figure 1(a) shows a schematic illustration of our TR-ARPES experimental setup. A pump pulse of 1.55 eV photon energy is used to excite the sample to a nonequilibrium state, and subsequently a probe pulse of 6.3 eV photon energy is used to capture the transient electronic structures at different time delays. By performing ARPES measurements in the pump-probe scheme, TR-ARPES can map out dispersions of the unoccupied states ShenBi2Se3PRL2013 . Moreover, by changing the time delay between the pump and probe pulses, we can directly capture the dynamic evolution of photo-excited charge carriers with energy, momentum and time resolved information Lanzara2011NPhy and thus disentangle the different relaxation processes in the time domain.
TR-ARPES allows to measure the electronic structure near the Weyl node, which is above EF and not accessible using conventional ARPES. Figure 1(b) shows the Fermi surface map of Td-MoTe2 and Figure 1(c) shows the measured ARPES dispersion along the -X direction (cut 1 in Fig. 1(b)) without pumping. Figure 1(d) shows the corresponding curvature plot, which has been applied to the ARPES data to enhance visualization of the dispersion DingRsi . A hole band (H1) and a surface state (SS1) are observed, while the portion of conduction band (E1) above EF is undetectable. Figure 1(e) and 1(h) show the TR-ARPES transient image and curvature plot after photo-excitation, where the entire W-shaped conduction band E1 becomes observable. In order to search for the signature of Weyl node at the boundary between the electron and hole pockets, the evolution of these bands is shown in Fig. 1(e)-1(g) with the corresponding curvature plots in Fig. 1(h)-1(j). From cut 1 to cut 3, the small hole band (H1) shrinks and an additional hole band (H2) emerges. This hole band gradually approaches the electron band E1, and they eventually touch at the Weyl node (indicated by arrows in Fig. 1(g) and 1(j)), in agreement with main features in the calculated spectra shown in Fig. 1(k)-1(l) and zoom-in images (Fig. 1(m)-1(n)). By using TR-ARPES, we directly identify the location of the Weyl node to be at 70 15 meV above EF, and further establishes Td-MoTe2 as a type-II Weyl semimetal phase.
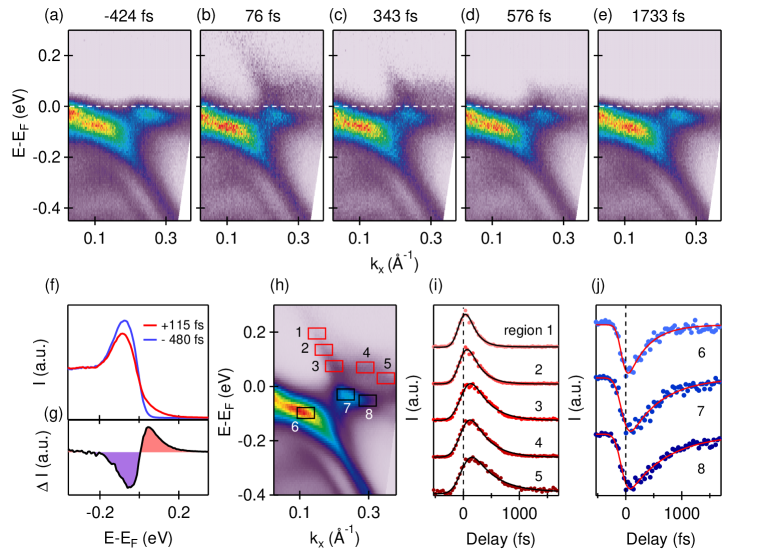
The relaxation dynamics near the Weyl node is revealed by taking snapshots of the transient spectra at different pump-probe delays. Figure 2(a) shows data taken at negative delay, i.e., before the pump excitation. Upon photo-excitation, electrons are immediately populated into the electronic states above EF (Fig. 2(b)), and subsequently relax into the equilibrium state within a few hundred fs (Fig. 2(c)-2(e)). Figure 2(f) and 2(g) show the transient momentum-integrated intensity curve at 115 fs and -480 fs delay and the differential intensity plot. A dramatic increase and decrease of intensity are clearly observed within 200 meV above and below EF, respectively. To further investigate the energy dependence, we show in Fig. 2(i) and 2(j) the temporal evolution of transient photoemission intensity for the conduction band and valence bands at energy and momentum positions marked in Fig. 2(h). For the W-shaped conduction band (E1), higher energy electrons (region 1 in Fig. 2(i)) relax faster while lower energy electrons near EF (region 5) survive for slightly longer time. The rising edge shifting toward positive time delay from high energy to low energy in Fig. 2(i) is usually caused by the cascade relaxation processes ShenBi2Se32012 , in which electrons relax from high energy states to low energy states in sequence. These observations suggest that the relaxation is mainly through intraband scattering. Similar trend with longer relaxation time for states near EF is also observed in the valence band (Fig. 2(j)). The recovery process can be further fitted using an empirical formula by including an error function for the rising edge and an exponential decay, convoluted with a Gaussian function to account for the temporal resolution. The extracted relaxation time in Fig. 2(i) varies from 150 fs at high energy to more than 400 fs at low energy. Such recovery time is much faster than the few ps observed in topological insulator Bi2Se3 ShenBi2Se32012 ; GedikBi2Se3PRL2012 , ZrTe5 manzoni2015ZrTe5 and Bismuth PerfettiBi2012 . Since hot electrons can cool down on a sub-picosecond timescale by coupling with optical phonons as reported in other materials kampfrath2005PRL ; Perfetti2007 ; Hofmann2013 , we tentatively attribute the observed ultrafast electron relaxation process to the intraband scattering mediated by - interaction.
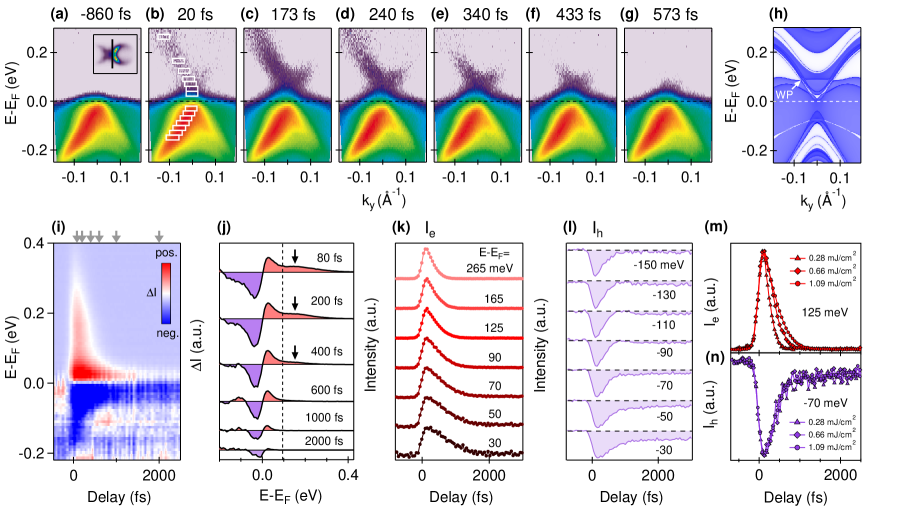
To further reveal the relaxation mechanism of photo-excited carriers near the Weyl node, we show in Fig. 3(a)-3(g) snapshots of the band structure through the Weyl node measured parallel to -Y direction at different delays, in which simpler band dispersion can be resolved. A conical dispersion similar to the theoretical calculation (Fig. 3(h)) is observed after transient photo-excitation and relaxes within a few hundred fs. The timescale is consistent with that measured along the -X direction. Figure 3(i) shows the momentum-integrated differential intensity relative to negative delay as a function of energy and delay. The relaxation dynamics is strongly dependent on energy. Within the first few hundred fs after photo-excitation, two relaxation components with one near EF (bright red in Fig. 3(i)) and one extending to higher energies (light red) are clearly observed. Figure 3(j) shows the selected differential energy profiles extracted from Fig. 3(i). For the population gains above EF, in addition to the peak as commonly seen in pump-probe measurements, there is a hump indicated by arrows between 0.1 and 0.3 eV within 400 fs, which further confirms the existence of the second component. At delay beyond 400 fs, the fast component almost disappears and the nonvanishing differential intensity between -0.1 eV to 0.1 eV decays with the slow component. Therefore there are two contributions to the population relaxation dominated at different timescale and at different energy range.
The relaxation dynamics of photo-excited electrons and holes can be resolved separately with both energy and momentum resolved information. We first focus on the evolution of photo-excited electrons in the conduction band shown in Fig. 3(k). Above 90 meV, the relaxation time is fast (within 200 fs), while below 90 meV, it shows pronounced energy dependent and quickly increases from 200 fs at 90 meV to 500 fs at 30 meV. A more notable change is also observed in the dynamics of photo-excited holes shown in Fig. 3(l). At energy below -90 meV, the relaxation occurs within 200 fs and is almost energy independent, while above -90 meV, an additional slower relaxation component extending up to several ps is observed. A similar abrupt change in the energy dependence of population dynamics has been also reported in optimally-doped Bi-2212 ZXShen2015BSCCO . The photo-excited electrons and holes also show different pump fluence dependence. The relaxation time for photo-excited electrons increases with fluence (Fig. 3(m)). In contrast to electrons, photo-excited holes in the valence band remains almost fluence independent (Fig. 3(n), see more details in Fig. S2 in the supplementary information). Such distinctive relaxation dynamics suggest strong electron-hole asymmetry. A possible reason is the extremely low density of states near the top of the valence band, which hinders the electronic relaxation from conduction band to valence band and results in a nearly fluence independent recovery time.
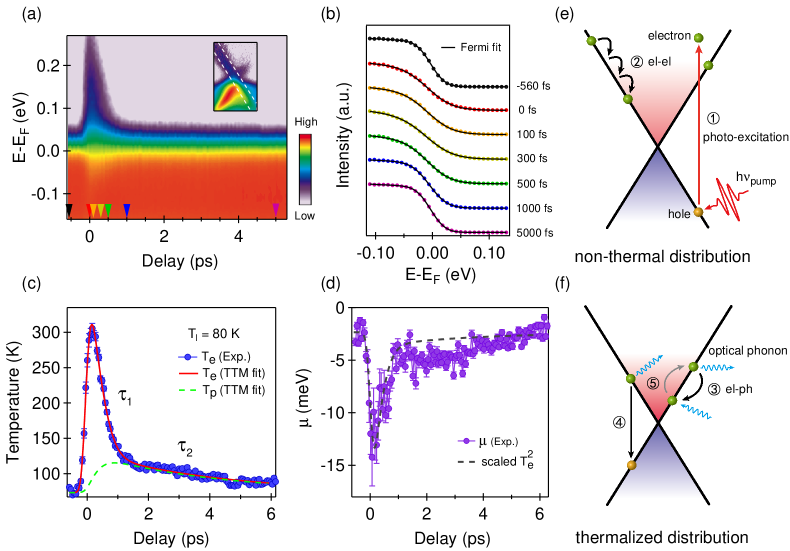
In addition to the transient populations discussed above, we further extract the effective electronic temperature by analyzing the integrated spectral intensity which is effectively the transient statistical distribution of the carriers along the dispersing band GedikBi2Se3PRL2012 ; gierz2013 ; Hofmann2013 . Figure 4(a) shows the temporal evolution of momentum-integrated intensity for the conical dispersion (region marked by white broken lines in the inset). At all time delays, the electron distribution can be well fitted by Fermi-Dirac distribution convoluted with a Gaussian resolution function (Fig. 4(b)), indicating a metallic response as observed in graphene Hofmann2013 . This suggests that thermalization of hot electrons occurs on an extremely short time scale within our temporal resolution. Such thermal-equilibrium distribution allows us to extract an effective electronic temperature and chemical potential , as shown in Fig. 4(c)-4(d). The maximum electronic temperature is two times smaller than the estimated value (see supplementary information), suggesting that the spatial heat diffusion is fast in the lattice. Two distinct relaxation components are observed in both and , with two characteristic timescales of = 430 30 fs and = 4.1 0.5 ps, respectively (Fig. S4 in the supplementary information). These are significant hints for taking into account the hot phonons in the relaxation process Hofmann2013 ; Perfetti2007 . The fast recovery component is attributed to hot electron cooling through coupled optical phonons, while the slow component is determined by the anharmonic decay of hot optical phonons. The anharmonic behavior in bulk Td-MoTe2 is also observed by temperature dependent Raman spectroscopy joshi2016phonon , in which an optical phonon decay into multiple acoustic phonons.
III DISCUSSIONS
To quantitatively examine the - mediated relaxation, we employ a minimal two temperature model (TTM) allen1987 to fit the electronic temperature. Considering the lattice as a large phonon bath, we assume that the lattice temperature remains at = 80 K after photo-excitation, and the TTM model involves two important temperatures: the electronic temperature , the hot optical phonon temperature . Based on the above assumption, the TTM is simplified into two coupled differential equations:
where and are the specific heat of electrons and phonons; is the driven term by the pump pulse with a Gaussian profile of FWHM 50 fs and an absorbed energy density of 130 ; and represent the - coupling constant and coupled optical phonon energy; is the decay time of hot nonequilibrium phonons; and are the Boltzmann and Planck constants, respectively. The TTM simulation of the photo-excited electronic temperature and hot optical phonon temperature is shown as red and green curves in Fig. 4(c) respectively. Such good fitting further supports the hot phonon involved relaxation scenario. The average - coupling strength = 32 1.2 and the phonon decay time = 3.8 0.4 ps are extracted from the TTM fitting, where is the second moment of the Eliashberg spectral function allen1987 . Such is much smaller than that observed in graphite ( 0.028 ) sugawara2007 and Bi-2212 ( 360 ) Perfetti2007 . Since the electronic relaxation time is determined by the - coupling strength with , this results in a larger electronic cooling time in MoTe2 ( 430 fs) compared to that in graphite ( 150-200 fs) Hofmann2013 ; breusing2009 and Bi-2212 ( 110 fs) Perfetti2007 . Furthermore, taking the - coupling constant 0.3 reported in bulk Td-MoTe2 takahashi2017EPC and assuming that the coupling is dominated by one phonon mode, i.e., , the mean phonon energy coupled to the hot electrons is estimated to be 10.3 meV. This energy is close to the optical phonon mode vibrating in the ac-plane with a calculated wavenumber of 78 zhang2016raman . For such phonon energy, the - scattering phase space is vanishingly small owing to the accessible electronic structure in the relaxation process, while acoustic phonons need a larger momentum window at such energy chen2016Raman and thus excludes acoustic phonon emission as the dominant cooling mechanism. Consequently, photo-excited hot electrons cool down within 400 fs through optical phonon cascade relaxation kovalev1996GaN and generate a large number of optical phonons. When the temperature of hot electrons and hot phonons reaches quasi-equilibrium, these hot optical phonons can be reabsorbed by electrons, thereby slowing down the hot electron cooling process. Therefore, the relaxation of the hot electrons is dominated by the decay of optical phonons, which serves as the hot phonon bottleneck langot1996GaAs . Similar behavior is also observed in the chemical potential (Fig. 4(d)). After photo-excitation, decreases immediately and recovers as electrons cool down. The changes of can be qualitatively understood as a result of elevated effective electronic temperature by , as expected in simple metals ashcroft1976 . The dashed curve in Fig. 4(d) is a scaled curve plot of in Fig. 4(c), which overall shows similar temporal evolution to in the electron cooling process.
Figure 4(e) and 4(f) show a schematic summary of the thermalization and relaxation process. After photo-excitation (process ① in Fig. 4(e)) and thermalization through direct electron-electron scattering (Process ②), hot electrons reach a quasi-equilibrium distribution shortly, with an elevated electronic temperature . The hot electrons cool down fast by generating a large number of hot optical phonons () through intraband cascade scattering (③ in Fig. 4(f)) or interband electron-hole recombination (process ④). The hot nonequilibrium phonons then dissipate their energy to other lattice vibrations () through anharmonic phonon-phonon interaction, and the reabsorption of hot phonons slows down the electron cooling process, and leads to the slower relaxation component determined by the lifetime of optical phonons (process ⑤ in Fig. 4(f)).
IV CONCLUSIONS
In summary, we reveal the unoccupied electronic states of Td-MoTe2 and confirm the Weyl node located at energy 70 meV above . Moreover, the dynamic evolution of photo-excited electrons and holes is revealed with energy, momentum and time resolution. Two intrinsic relaxation timescales are observed, with the faster component of 430 fs attributed to the hot electron cooling through optical phonon emission, while the slow component of 4.1 ps is determined by the anharmonic decay of hot optical phonons. The - coupling strength is extracted by TTM simulation. Our work provides dynamic information on this new type of topological phase, and highlights the significant role of - interaction in the relaxation process of quasiparticles near the Weyl node upon photo-excitation.
Methods
High quality MoTe2 single crystals were synthesized by chemical vapor transport (CVT) method as detailed in our previous work kedeng2016MoTe2 ; zhang2016raman . TR-ARPES measurements were performed in our home laboratory at Tsinghua University using a Ti: sapphire regenerative amplifier producing femtosecond pulses at 800 nm (1.55 eV) at 30 kHz repetition rate with an overall temporal resolution of 205 fs and energy resolution of 42 meV (see Fig. S1 in the supplementary information). The infrared laser was frequency quadrupled to produce ultraviolet probe laser. The pump beam and probe beam were focused onto the sample with a FWHM (full width at half maximum) beam size of 220 m and 120 m, respectively. The tunable pump-probe delay was achieved by varying the pump optical path with a motorized delay stage of 6.7 fs precision. In order to minimize the space-charge effect Graf2010spacecharge , the flux of the probe beam was lowered to make the shift and broadening of Fermi edge of the ARPES spectra negligible (5 meV). Multi-photon photoemission from the pump beam was absent in our measured data for all chosen pump fluence. TR-ARPES measurements were performed on freshly cleaved MoTe2 single crystals at 80 K with a base pressure better than 510-11 Torr.
The ab-initio calculations are carried out in the framework of the Perdew-Burke-Ernzerhof-type generalized gradient approximation of the density functional theory through employing the Vienna Ab initio simulation package (VASP) kresse1996 with the projected augmented wave (PAW) method. The k-point mesh is taken as 12106 for the bulk calculations. The spin-orbit coupling effect is self-consistently included.
References
- (1) Wan, X., Turner, A. M., Vishwanath, A. & Savrasov, S. Y. Topological semimetal and Fermi-arc surface states in the electronic structure of pyrochlore iridates. Phys. Rev. B 83, 205101 (2011).
- (2) Armitage, N. P., Mele, E. J. & Vishwanath, A. Weyl and Dirac semimetals in three dimensional solids. Preprint at arXiv: 1705.01111 (2017).
- (3) Xu, S.-Y. et al. Discovery of a Weyl fermion semimetal and topological Fermi arcs. Science 349, 613 (2015).
- (4) Lv, B. et al. Experimental discovery of Weyl semimetal TaAs. Phys. Rev. X 5, 031013 (2015).
- (5) Weng, H., Fang, C., Fang, Z., Bernevig, B. A. & Dai, X. Weyl semimetal phase in noncentrosymmetric transition-metal monophosphides. Phys. Rev. X 5, 011029 (2015).
- (6) Huang, X. et al. Observation of the chiral-anomaly-induced negative magnetoresistance in 3D Weyl semimetal TaAs. Phys. Rev. X 5, 031023 (2015).
- (7) Zhang, C.-L. et al. Signatures of the Adler–Bell–Jackiw chiral anomaly in a Weyl fermion semimetal. Nat. Commun. 7, 10735 (2016).
- (8) Ishizuka, H., Hayata, T., Ueda, M. & Nagaosa, N. Emergent electromagnetic induction and adiabatic charge pumping in noncentrosymmetric Weyl semimetals. Phys. Rev. Lett. 117, 216601 (2016).
- (9) Chan, C.-K., Lindner, N. H., Refael, G. & Lee, P. A. Photocurrents in Weyl semimetals. Phys. Rev. B 95, 041104(R) (2017).
- (10) de Juan, F., Grushin, A. G., Morimoto, T. & Moore, J. E. Quantized circular photogalvanic effect in Weyl semimetals. Nat. Commun. 8, 15995 (2017).
- (11) Ma, Q. et al. Direct optical detection of Weyl fermion chirality in a topological semimetal. Nat. Phys. Published online DOI: 10.1038/NPHYS4146 (2017).
- (12) Wu, L. et al. Giant anisotropic nonlinear optical response in transition metal monopnictide Weyl semimetals. Nat. Phys. 13, 350 (2017).
- (13) Chan, C.-K., Oh, Y.-T., Han, J. H. & Lee, P. A. Type-II Weyl cone transitions in driven semimetals. Phys. Rev. B 94, 121106(R) (2016).
- (14) Hübener, H., Sentef, M. A., De Giovannini, U., Kemper, A. F. & Rubio, A. Creating stable Floquet–Weyl semimetals by laser-driving of 3D Dirac materials. Nat. Commun. 8, 13940 (2017).
- (15) Yu, R., Weng, H., Fang, Z., Ding, H. & Dai, X. Determining the chirality of Weyl fermions from circular dichroism spectra in time-dependent angle-resolved photoemission. Phys. Rev. B 93, 205133 (2016).
- (16) Zeng, H., Dai, J., Yao, W., Xiao, D. & Cui, X. Valley polarization in MoS2 monolayers by optical pumping. Nat. Nano. 7, 490 (2012).
- (17) Mak, K. F., He, K., Shan, J. & Heinz, T. F. Control of valley polarization in monolayer MoS2 by optical helicity. Nat. Nano. 7, 494 (2012).
- (18) Cao, T. et al. Valley-selective circular dichroism of monolayer molybdenum disulphide. Nat. commun. 3, 887 (2012).
- (19) Zhu, C. et al. A robust and tuneable mid-infrared optical switch enabled by bulk Dirac fermions. Nat. commun. 8, 14111 (2017).
- (20) Soluyanov, A. A. et al. Type-II Weyl semimetals. Nature 527, 495 (2015).
- (21) Deng, K. et al. Experimental observation of topological Fermi arcs in type-II Weyl semimetal MoTe2. Nat. Phys. 12, 1105 (2016).
- (22) Huang, L. et al. Spectroscopic evidence for type II Weyl semimetal state in MoTe2. Nat. Mater. 15, 1155 (2016).
- (23) Zheng, H. et al. Atomic-scale visualization of quasiparticle interference on a type-II Weyl semimetal surface. Phys. Rev. Lett. 117, 266804 (2016).
- (24) Rüßmann, P. et al. Universal response of the type-II Weyl semimetals phase diagram. Preprint at arXiv: 1706.00456 (2017).
- (25) Sobota, J. A. et al. Direct optical coupling to an unoccupied Dirac surface state in the topological insulator Bi2Se3. Phys. Rev. Lett. 111, 136802 (2013).
- (26) Graf, J. et al. Nodal quasiparticle meltdown in ultrahigh-resolution pump-probe angle-resolved photoemission. Nat. Phys. 7, 805 (2011).
- (27) Zhang, P. et al. A precise method for visualizing dispersive features in image plots. Rev. Sci. Instrum. 82, 043712 (2011).
- (28) Sobota, J. A. et al. Ultrafast optical excitation of a persistent surface-state population in the topological insulator Bi2Se3. Phys. Rev. Lett. 108, 117403 (2012).
- (29) Wang, Y. H. et al. Measurement of intrinsic Dirac fermion cooling on the surface of the topological insulator Bi2Se3 using time-resolved and angle-resolved photoemission spectroscopy. Phys. Rev. Lett. 109, 127401 (2012).
- (30) Manzoni, G. et al. Ultrafast optical control of the electronic properties of ZrTe5. Phys. Rev. Lett. 115, 207402 (2015).
- (31) Papalazarou, E. et al. Coherent phonon coupling to individual Bloch states in photoexcited Bismuth. Phys. Rev. Lett. 108, 256808 (2012).
- (32) Kampfrath, T., Perfetti, L., Schapper, F., Frischkorn, C. & Wolf, M. Strongly coupled optical phonons in the ultrafast dynamics of the electronic energy and current relaxation in graphite. Phys. Rev. Lett. 95, 187403 (2005).
- (33) Perfetti, L. et al. Ultrafast electron relaxation in superconducting Bi2Sr2CaCu2O8+δ by time-resolved photoelectron spectroscopy. Phys. Rev. Lett. 99, 197001 (2007).
- (34) Johannsen, J. C. et al. Direct view of hot carrier dynamics in graphene. Phys. Rev. Lett. 111, 027403 (2013).
- (35) Yang, S.-L. et al. Inequivalence of single-particle and population lifetimes in a cuprate superconductor. Phys. Rev. Lett. 114, 247001 (2015).
- (36) Gierz, I. et al. Snapshots of non-equilibrium Dirac carrier distributions in graphene. Nat. Mater. 12, 1119 (2013).
- (37) Joshi, J. et al. Phonon anharmonicity in bulk Td-MoTe2. Appl. Phys. Lett. 109, 031903 (2016).
- (38) Allen, P. B. Theory of thermal relaxation of electrons in metals. Phys. Rev. Lett. 59, 1460 (1987).
- (39) Sugawara, K., Sato, T., Souma, S., Takahashi, T. & Suematsu, H. Anomalous quasiparticle lifetime and strong electron-phonon coupling in graphite. Phys. Rev. Lett. 98, 036801 (2007).
- (40) Breusing, M., Ropers, C. & Elsaesser, T. Ultrafast carrier dynamics in graphite. Phys. Rev. Lett. 102, 086809 (2009).
- (41) Takahashi, H. et al. Anticorrelation between polar lattice instability and superconductivity in the weyl semimetal candidate MoTe2. Phys. Rev. B 95, 100501(R) (2017).
- (42) Zhang, K. et al. Raman signatures of inversion symmetry breaking and structural phase transition in type-II Weyl semimetal MoTe2. Nat. Commun. 7, 13552 (2016).
- (43) Chen, S.-Y., Goldstein, T., Venkataraman, D., Ramasubramaniam, A. & Yan, J. Activation of new Raman modes by inversion symmetry breaking in type II Weyl semimetal candidate T’-MoTe2. Nano Lett. 16, 5852 (2016).
- (44) Kovalev, D. et al. Free exciton emission in GaN. Phys. Rev. B 54, 2518 (1996).
- (45) Langot, P., Del Fatti, N., Christofilos, D., Tommasi, R. & Vallée, F. Femtosecond investigation of the hot-phonon effect in GaAs at room temperature. Phys. Rev. B 54, 14487 (1996).
- (46) Ashcroft, N. W. & Mermin, N. D. Solid State Physics (Thomson Learning, New York, 1976).
- (47) Graf, J. et al. Vacuum space charge effect in laser-based solid-state photoemission spectroscopy. J. of Appl. Phys. 107, 014912 (2010).
- (48) Kresse, G. & Furthmüller, J. Efficient iterative schemes for ab initio total-energy calculations using a plane-wave basis set. Phys. Rev. B 54, 11169 (1996).
Acknowledgments This work is supported by the National Natural Science Foundation of China (Grant No. 11334006 and 11427903), Ministry of Science and Technology of China (Grant No. 2015CB921001 and 2016YFA0301004), Science Challenge Project (No. 20164500122) and the Beijing Advanced Innovation Center for Future Chip (ICFC).