Tuning the antiferromagnetic helical pitch length and nanoscale domain size in \ceFe3PO4O3 by magnetic dilution
Abstract
The insulating magnetic material \ceFe3PO4O3 features a non-centrosymmetric lattice composed of \ceFe^3+ triangular units. Frustration, due to competing near neighbor () and next nearest neighbor () antiferromagnetic interactions, was recently suggested to be the origin of an antiferromagnetic helical ground state with unusual needle-like nanoscale magnetic domains in \ceFe3PO4O3. Magnetic dilution is shown here to tune the ratio of these magnetic interactions, thus providing deeper insight into this unconventional antiferromagnet. Dilution of the \ceFe^3+ lattice in \ceFe3PO4O3 was accomplished by substituting non-magnetic \ceGa^3+ to form the solid solution series \ceFe_3-xGa_xPO4O3 with . Magnetic susceptibility and neutron powder diffraction data from this series are presented. A continuous decrease of the both the helical pitch length and the domain size is observed with increasing dilution up to at least , while for , the compounds lack long range magnetic order entirely. The decrease in the helical pitch length with increasing can be qualitatively understood by reduction of the ratio of in the Heisenberg model, consistent with mean field considerations. Intriguingly, the magnetic correlation length in the plane remains nearly equal to the pitch length for each value of , showing that the two quantities are intrinsically connected in this unusual antiferromagnet.
I Introduction
Magnetic frustration, arising from competing interactions, can lead to a variety of interesting phenomena. The roster of frustration-induced effects includes noncollinear spin structuresYoshimori (1959); Kaplan (1959), spin glassesItoh et al. (1994), multiferroicsBlake et al. (2005), and spin liquidsBalents (2010). In each case, the delicate balance of interactions means that small perturbations, such as magnetic dilution, can lead to dramatic effects.
When frustration leads to helical magnetic structures, the possibility of the formation of Skyrmions, or other topological objects such as vortices or magnetic bubbles, arises Okubo et al. (2012). Skyrmions in particular are of current interest for their possible uses in spintronics applicationsSampaio et al. (2013). They can form a thermodynamically stable Skyrmion-lattice phaseAdams et al. (2012); Münzer et al. (2010); Pfleiderer et al. (2009); Nagaosa and Tokura (2013) (also describable as a multi- magnetic structure), or they can be generated as single defects by combining helical magnetic domain walls Zhou and Ezawa (2014); Zhang et al. (2016). The presently-known materials forming Skyrmions are based on the competition of Dzyaloshinskii-Moriya (DM) interactions and ferromagnetic (FM) Heisenberg exchange, forming locally ferromagnetic or ferrimagnetic helical states, from which the Skyrmion lattice arises in finite magnetic field. The local FM background makes them susceptible to the Skyrmion Hall effect, which hinders their efficient manipulation in devicesBarker and Tretiakov (2016).
Frustrated antiferromagnets have been proposed as an alternative material class which are capable of generating of SkyrmionsOkubo et al. (2012); Leonov and Mostovoy (2015); Hayami et al. (2016). The presence of antiferromagnetic (AFM) interactions may act to stabilize AFM Skyrmions, which are predicted to avoid the Skyrmion Hall effect Barker and Tretiakov (2016); Zhang et al. (2016). AFM Skyrmions have yet to be observed experimentally. In order to generate AFM Skyrmions in a real material, one starting point may be the identification of an AFM helical structure with a high density of domain walls. This scenario would suggest an underlying instability towards the formation of topological defects in the helical AFM state, and also provides the possibility of creating interesting spin textures from domain wall intersections. In this light, the frustrated antiferromagnet \ceFe3PO4O3 is of prime interest Ross et al. (2015).
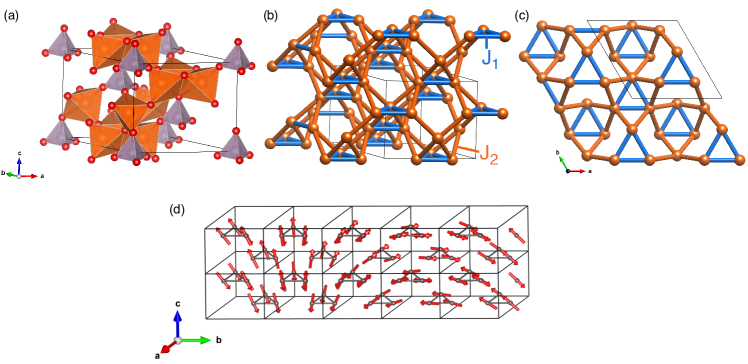
The structure of \ceFe3PO4O3 (noncentrosymmetric space group with room temperature lattice parameters of Å and Å in the hexagonal setting) can be described as triangular units of distorted \ceFeO5 trigonal bipyramids coordinated by phosphate groups as shown in Figure 1a. Figures 1b and c show the connectivity of magnetic \ceFe^3+ cations; nearest-neighbor interactions are shown in blue within the triangles and next-nearest-neighbor interactions are shown in orange between neighboring triangles. When these interactions are AFM and isotropic (as expected in \ceFe3PO4O3 based on the lack of single-ion anisotropy expected for \ceFe^3+ and significant direct exchange interactionsGavoille et al. (1987)), this model produces helical magnetic states near the frustrated point . MagnetizationModaressi et al. (1983); Gavoille et al. (1987), specific heatShi et al. (2013), Mössbauer spectroscopyModaressi et al. (1983); Gavoille et al. (1987), and neutron powder diffractionGavoille et al. (1987); Ross et al. (2015) all confirm that \ceFe3PO4O3 orders into an AFM structure below = 163 K. The magnetic structure of \ceFe3PO4O3 was recently shown to be quite unusual, however, in that the AFM helical state (Figure 1 d) is only partially ordered; the correlation length of the magnetic order extends to at least 90 nm (900 Å) along the axis, but remains limited to 10 nm in the ab plane down to at least K Ross et al. (2015), suggesting a high density of domain walls separating helically-ordered domains. As shown in our previous work, frustration is likely to be responsible for the orientation of the domain walls (which run parallel to , producing needle-like domains)Ross et al. (2015), but the origin of the high density of these defects is presently unknown. Here, we shed some light on this issue by showing that the defect spacing is intimately tied to the helical pitch length in \ceFe3PO4O3, which we show can be varied by greater than a factor of two through dilution of the magnetic lattice.
In this contribution we examine the magnetic order in gallium-doped \ceFe_3-xGa_xPO_4O_3 through low temperature magnetic susceptibility and neutron powder diffraction. We use the helical magnetic structure that was previously proposed Ross et al. (2015) (Fig. 1 d) to model the neutron powder diffraction patterns of the gallium-substituted materials. For low dilution, , the helical pitch length decreases with increasing , which can be reproduced using a reduced ratio of in the Heisenberg exchange model. This is consistent with a mean field picture, since twice as many interactions are removed as compared to interactions for every Fe atom that is replaced with non-magnetic Ga. The size of the magnetic domains in the plane, determined via the broadening of magnetic Bragg peaks, is also reduced with increasing . Curiously, the correlation length in the plane (equal to half of the typical domain size) appears to be constrained to be nearly equal to the pitch length. At higher values of gallium substitution, , long-range magnetic order in any direction is not observed, providing an estimate for the percolation threshold for this lattice.
II Methods
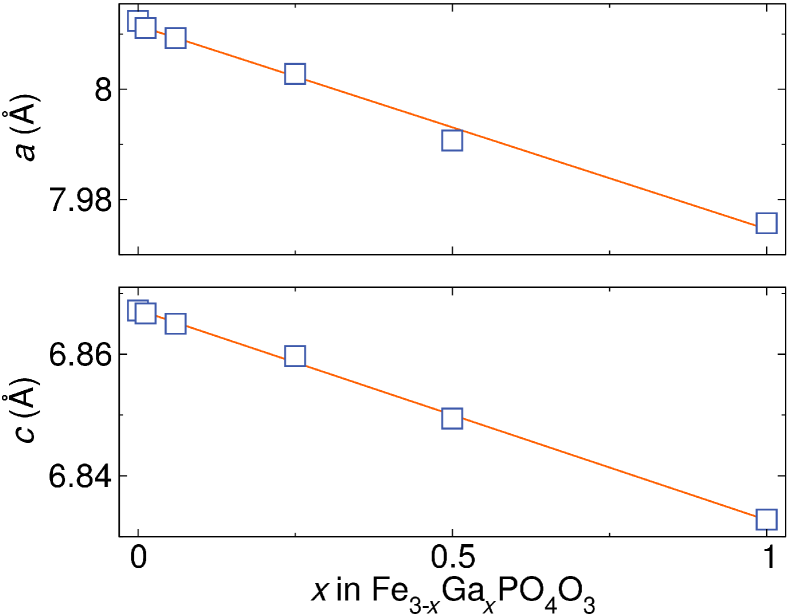
Polycrystalline samples in the solid solution series \ceFe_3-xGa_xPO4O3 were prepared as previously describedRoss et al. (2015). \ceFe_2O_3 and \ceGa2O3 were dried overnight at 600∘C and \ceFePO_4⋅H2O was converted to anhydrous \ceFePO4 by heating in air at 900∘C overnight in alumina crucibles, and then stored in a desiccator. Powder X-ray diffraction data were collected using a NaCl internal standard to check for purity and for shifts in the lattice parameter. Data were collected using a Bruker D8 Discover DaVinci Powder X-ray Diffractometer. Rietveld refinements including explicit modeling of the NaCl standard were performed using the TOPAS software package. The refinements confirm a solid-solution behavior of \ceFe_3-xGa_xPO4O3. The extracted lattice parameters follow Vegard’s law for a solid solution between \ceFe3PO4O3 and \ceGa3PO4O3; the observed lattice parameters agree well with the extrapolated lattice parameters for a given value of , suggesting that the actual composition reflects the nominal composition (Figure 2).
Magnetization measurements were performed using a vibrating sample magnetometer in a Quantum Design Physical Properties Measurement System. The samples were measured in an applied field of from 1.8 K to 300 K after cooling in the absence of an applied magnetic field (zero field cooled measurement, a.k.a. ZFC), and then measured from 300 to 1.8 K in a 1T field (field cooled measurement, a.k.a. FC).
Neutron powder diffraction (NPD) measurements were carried out on 2.3-2.6 g polycrystalline samples of \ceFe_3-xGa_xPO4O3 with = 0, 0.012, 0.06, 0.25, 0.5, 1.0, and 1.5 using beamline HB-2A at the High Flux Isotope Reactor at Oak Ridge National Laboratory. The samples were measured at temperatures ranging from 3.5 to 295 K using a helium closed cycle refrigerator; collection temperatures were selected based on features observed in susceptibility measurements. The instrument provided a constant wavelength incident neutron beam with = 2.4123 Å from the Ge(113) monochromator, and 21 arcminute collimators were placed between the monochromator and the sample, while 12 arcminute collimators were used between the sample and each of the 44 detectors. This configuration produces a resolution of = at = 1 Å-1.Garlea et al. (2010) Magnetic and nuclear Rietveld refinements were performed using the FullProf software packageRodríguez-Carvajal (1993).
Magnetic structures were determined for the classical Heisenberg Hamiltonian for various ratios of using a numerical energy minimization routine implemented in the program SpinW (a simplex method with periodic boundary conditions)Toth and Lake (2015).
III Results
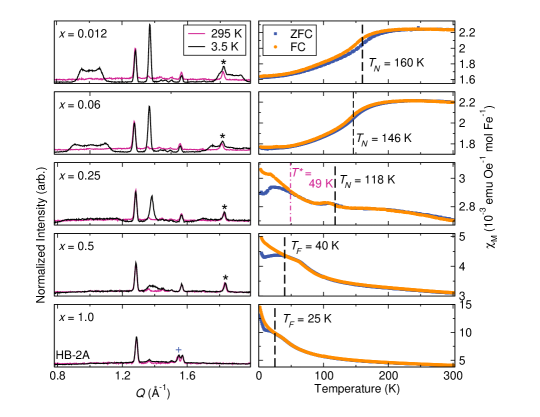
The low-temperature magnetic susceptibility as well as neutron diffraction patterns at high and low temperatures is shown in Figure 3 for all . A slight splitting between the FC and ZFC curves in the parent compound (, shown in Ref. Ross et al., 2015) begins slightly above and persists down to at least 2 K. Similar features are observed for and (Fig. 3), although decreases with increasing . is estimated at 160 K for and 146 K for , based on the location of the the largest positive in the ZFC susceptibility, a feature which is coincident with a peak in the specific heat for as shown in Ref. Ross et al., 2015.
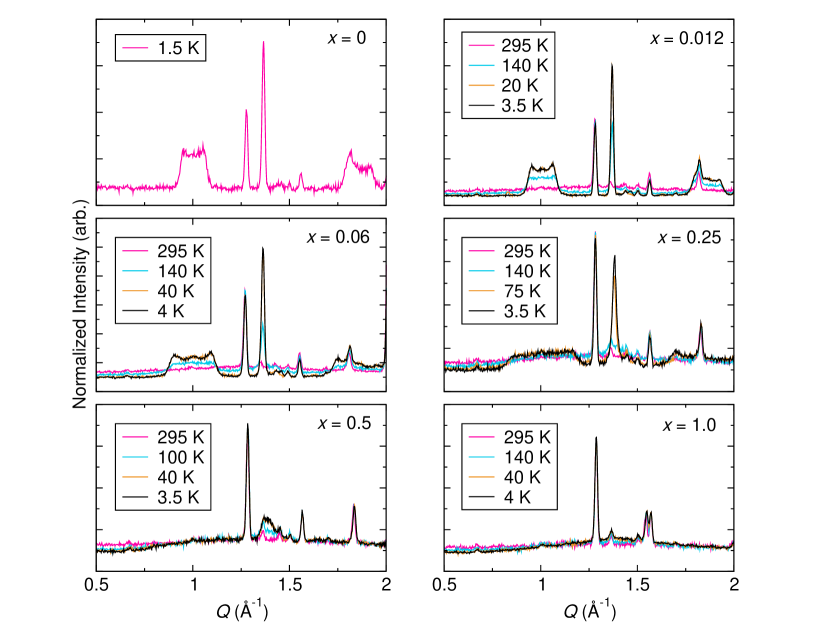
A more dramatic ZFC/FC splitting occurs for . Based on comparison to the temperature dependent neutron powder diffraction patterns (Appendix, Fig. 7), discussed next, this splitting occurs at the temperature which is below for , possibly indicating a freezing of “free spins” produced by dilution (i.e., spins which are liberated from strong constraints on their orientation due to missing neighbors, also known as “orphan spins” Schiffer and Daruka (1997)). For , a long-range ordered state is not observed, and the ZFC/FC splitting in the susceptibility might signal spin freezing throughout the entire sample, as in a spin glass. Accordingly, the temperature of the ZFC/FC splitting is denoted as for . The overall magnitude of the susceptibility increases for , consistent with moving toward the paramagnetic limit as dilution acts to suppress the strong AFM correlations known to be present even up to 900 K in Fe3PO4O3 Ross et al. (2015).
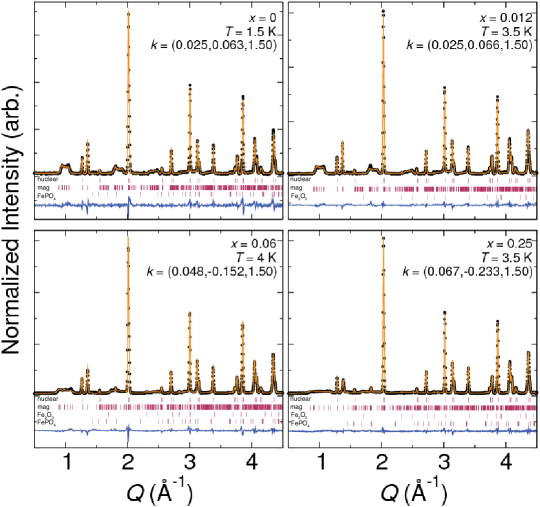
The magnetic structures for remain qualitatively similar to the parent compound, as confirmed by NPD (Figure 4), although decreases with gallium substitution as expected for overall weaker interactions produced by dilution B. Martínez, F. Sandiumenge, A. Rouco, A. Labarta, J. Rodríguez-Carvajal, M. Tovar, M.T. Causa, S. Galí and Obradors (1992); Fåk et al. (2005). The eventual disappearance of long-range order, which we characterize by absence of a well-formed magnetic peak near =1.35 Å-1, occurs for .
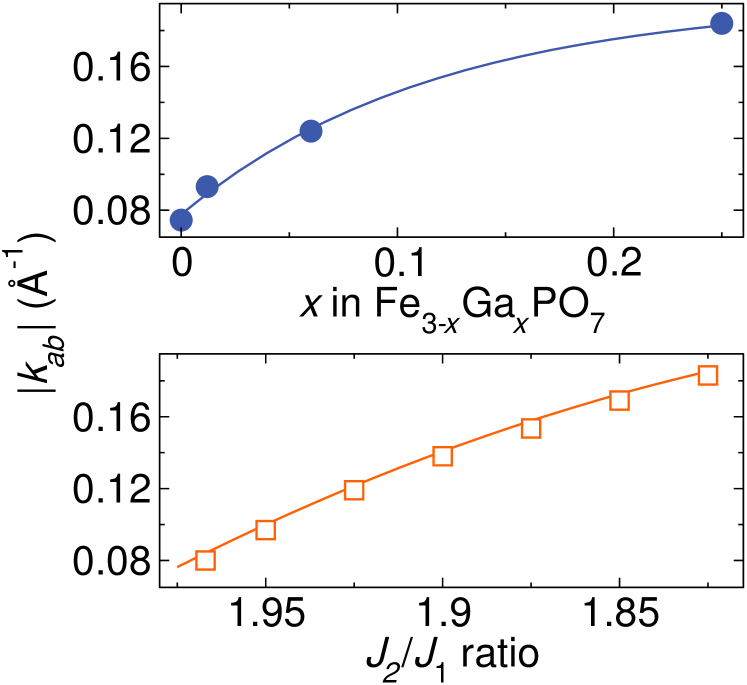
The helical magnetic structure model previously used for the parent compound, with an ordering wavevector (hexagonal setting of ) and needle-like finite size broadening indicating a magnetic domain size in the plane, was fit to the data for (Figure 4). The magnitude of this incommensuration, , increases with , implying a reduced helical pitch length as shown in Figure 5b. The incommensuration is constant in temperature below for each sample. For at K, the broad magnetic peaks are not visible and the normally sharp peak near Å-1 is significantly broadened. For samples with , there are no magnetic Bragg features except for diffuse scattering centered at Å-1 as shown in Figures 3 and 5.
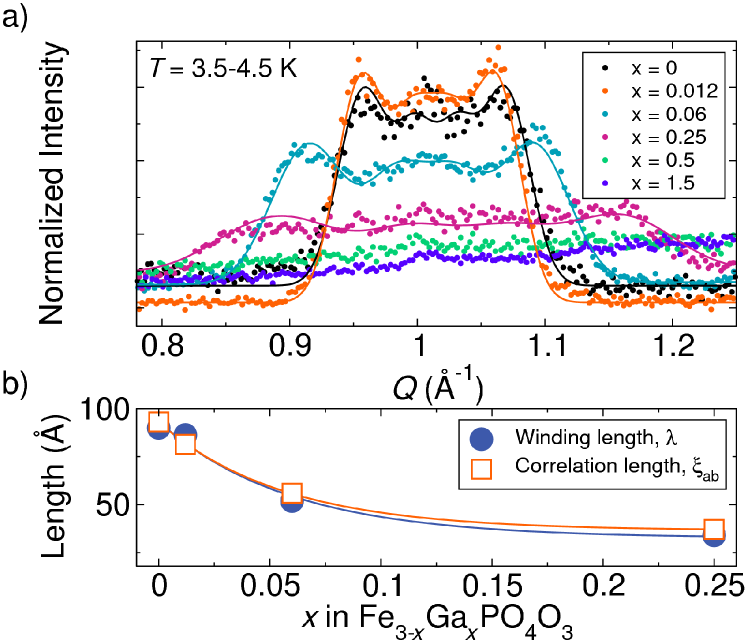
Correlation lengths can be extracted from the magnitude of the peak broadening required to match the slopes of the edges of the broad magnetic features. The coexistence of a sharp, resolution limited magnetic Bragg peak (near Å-1) and broad, flat topped peaks (such as that near Å-1) can be described by anisotropic broadening, which affects peaks that have large components in the plane (i.e., produced by needle-shaped domains). The Lorentzian broadening employed in the Fullprof Rietveld refinement software package does not accurately capture the shape of the broad peaks, particularly the slopes of the peak edges. In order to extract the -plane correlation length more accurately, we used a custom-made analysis script which fits the broad peak near 1 Å-1 and the sharp peak near 1.35 Å-1 simultaneously, applying a Gaussian broadening beyond the instrument resolution to the former, but not the latter. For this analysis, the peak locations were set by a single magnetic propagation vector, but intensities were permitted to refine independently (i.e., a LeBail, also known as profile-matching, pattern refinement method was used). This method allows us to refine the ordering wavevector, which is strongly constrained by the central of the sharp peak, and the correlation length simultaneously. The fits are shown in Figure 5, while the fits to the whole NPD pattern obtained using Lorentzian broadening as implemented in Fullprof are shown in Figure 4. The correlation length is extracted as , where is the full width at half maximum (FWHM) of the satellite peaks with being the independent variable (the correlation length is taken to be the radius of the Scherrer domain size, assuming a shape factor of K = 1 Hammond and Hammond (2001)). The plane correlation length decreases with increasing , and remains approximately equal to the helical pitch length for all values of (Figure 5). The marked increase in domain wall density (from nm-2 at to 0.023 nm-2 at ) shows that magnetic dilution greatly stabilizes the formation of domain walls. Furthermore, the domain wall density is not consistent with a simple picture of nucleation at the gallium defects; assuming an even distribution of the defects, and taking Ga atoms per 55.5 Å2 (there are 9 sites in the unit cell, which has an plane area of 55.5 Å2), gives a domain wall density of 1.3 nm-2 at 0.25, which is much larger than observed.
IV Discussion
The magnetic frustration in \ceFe3PO4O3 stems from the competition between the antiferromagnetic intra-triangle and inter-triangle interactions. As non-magnetic gallium substitutes into the structure, the magnetic and interactions are disrupted. For each gallium atom, two bonds and four bonds are broken, from which we expect a reduction in the average ratio . The effect of this rebalancing of the exchange interactions was examined using a numerical minimization of the classical spin Hamiltonian,
| (1) |
where the first sum is over nearest neighbors and the second is over next nearest neighbors.
Planar helical magnetic structures with the ordering wavevector are produced when . The ratio of was varied slightly, and the resulting helical modulation () was determined. The variation in the helical pitch of the magnetic structure agrees qualitatively with the experimental results: increases with decreasing , as shown in Figure 6. Matching the calculated to that of the parent compound ( Å-1), this approximation gives for which is reduced to for , indicating that the mean interaction strength is reduced relative to , as expected.
Some simplifying assumptions were made in the choice of the magnetic structure, as well as the Heisenberg model, discussed above. To within the constraints of our powder averaged neutron diffraction data, we cannot distinguish between coplanar (helical) versus some non-coplanar (conical) magnetic structures, as discussed in Ref. Ross et al., 2015; we thus chose the former for simplicity. Furthermore, the crystal structure lacks any inversion center, implying the presence of Dzyaloshinskii-Moriya (DM) interactions for every pair of Fe atoms, which may favor non-coplanar conical structures. However, the simple model presented here captures the main features of the NPD of \ceFe3PO4O3 and its variation with magnetic dilution; the pitch length and correlation length would not depend on the choice of a helical vs. conical structure, and although the mapping of to the ratio of might be modified by the inclusion of DM interactions, we expect this to be a small effect since the DM interactions arise from spin orbit coupling, which is weak for Fe3+.
We note that the intensity distribution of the broad peaks are more symmetric than expected, since the Fe3+ magnetic form factor should tend to suppress the intensity at the high side. This disagreement becomes even more pronounced with the significantly broader peaks such as those in \ceFe_2.75Ga_0.25PO4O3. The inferred covalency of the Fe-O bonds in \ceFe3PO4O3, discussed in Ref. Ross et al., 2015, would produce a less localized spin distribution, weakening the magnetic form factor. Note that the profile-matching calculation shown in Figure 5 does not include the form factor, but the Fullprof refinements shown in Figure 4 do.
An unusual feature of the parent compound which extends to the the weakly diluted variants is the presence of needle-like magnetic domains, manifested as the broadening of magnetic peaks which have large components in the ab plane. Figure 5 shows that the correlation length, and hence domain size, decreases with gallium content. Since magnetostriction has been proposed as an origin for the formation of antiferromagnetic domainsMinakov et al. (1990); Gomonay and Loktev (2002), one might infer that the presence of smaller Ga ions at Fe sites creates strain or chemical pressure that locally increases the influence of magnetostriction, i.e., domain wall nucleation at impurities. However, as noted above, assuming a uniform distribution of Ga does not reproduce the inferred domain wall density. Some insight on the origin of the small domain size in the plane is provided by Figure 5b, which reveals that the correlation length and the helical winding length track each other for all measured values of below the percolation limit (). Since the decrease in the winding length can be understood as a decrease in , an intrinsic effect, the connection between the domain size and the pitch length intriguingly suggests that helical domains are truncated due to an intrinsic instability of the helical structure toward defect formation.
V Conclusions
Our study of the magnetic dilution series \ceFe_3-xGa_xPO4O3 reveals that the incommensurate magnetic structure present in the parent compound (0) undergoes continuous changes with increasing , until at high enough dilution () a spin-glass-like state with no long range order forms. We find, by analyzing magnetic neutron powder diffraction patterns across the series, that the helical winding length and plane correlation length both decrease as increases, but remain nearly equal to one another over the range to 0.25. Based on numerical analysis of a Heisenberg exchange Hamiltonian with competing near neighbor () and next near neighbor () interactions, it is observed that the decreasing pitch length is consistent with a decreasing ratio of , as expected from mean field considerations. Unexpectedly, the plane correlation length decreases in the same manner as the helical pitch length; the result is that despite the increased spacing in between satellite peaks for higher , they still cannot be individually resolved. The coincidence of the two length scales suggests an intrinsic mechanism for the truncation of the the helical spin structure, rather than the nucleation of domain walls at impurities. These results further validate that magnetic frustration is responsible for the development of the helical magnetic structure in \ceFe3PO4O3, while also providing clues as to the mechanism for the development of small needle-like domains of this structure. We anticipate that future studies of single crystal samples of \ceFe3PO4O3 could elucidate the nature of this short range antiferromagnetic helical structure and its relation to topological spin textures such as helical domain walls, or antiferromagnetic Skyrmions.
VI Acknowledgments
The authors acknowledge helpful discussions with M. Gelfand. This research used resources at the High Flux Isotope Reactor, a DOE Office of Science User Facility operated by the Oak Ridge National Laboratory.
References
- Yoshimori (1959) A. Yoshimori, J. Phys. Soc. Jap. 14, 807 (1959).
- Kaplan (1959) T. A. Kaplan, Phys. Rev. 116, 888 (1959).
- Itoh et al. (1994) M. Itoh, I. Natori, S. Kubota, and K. Motoya, J. Phys. Soc. Jap. 63, 1486 (1994).
- Blake et al. (2005) G. R. Blake, L. C. Chapon, P. G. Radaelli, S. Park, N. Hur, S.-W. Cheong, and J. Rodríguez-Carvajal, Phys. Rev. B 71, 214402 (2005).
- Balents (2010) L. Balents, Nature 464, 199 (2010).
- Okubo et al. (2012) T. Okubo, S. Chung, and H. Kawamura, Physical review letters 108, 017206 (2012).
- Sampaio et al. (2013) J. Sampaio, V. Cros, S. Rohart, A. Thiaville, and A. Fert, Nature Nanotechnology 8, 839 (2013).
- Adams et al. (2012) T. Adams, A. Chacon, M. Wagner, A. Bauer, G. Brandl, B. Pedersen, H. Berger, P. Lemmens, and C. Pfleiderer, Phys. Rev. Lett. 108, 237204 (2012).
- Münzer et al. (2010) W. Münzer, A. Neubauer, T. Adams, S. Mühlbauer, C. Franz, F. Jonietz, R. Georgii, P. Böni, B. Pedersen, M. Schmidt, A. Rosch, and C. Pfleiderer, Physical Review B 81, 041203(R) (2010).
- Pfleiderer et al. (2009) C. Pfleiderer, A. Rosch, A. Neubauer, R. Georgii, and P. Boni, Science 323, 915 (2009).
- Nagaosa and Tokura (2013) N. Nagaosa and Y. Tokura, Nature Nanotechnology 8, 899 (2013).
- Zhou and Ezawa (2014) Y. Zhou and M. Ezawa, Nature Comm. 5, 4652 (2014).
- Zhang et al. (2016) X. Zhang, Y. Zhou, and M. Ezawa, Sci. Rep. 6, 24795 (2016).
- Barker and Tretiakov (2016) J. Barker and O. A. Tretiakov, Physical Review Letters 116, 147203 (2016).
- Leonov and Mostovoy (2015) A. Leonov and M. Mostovoy, Nature communications 6, 8275 (2015).
- Hayami et al. (2016) S. Hayami, S.-Z. Lin, and C. D. Batista, Physical Review B 93, 184413 (2016).
- Ross et al. (2015) K. A. Ross, M. M. Bordelon, G. Terho, and J. R. Neilson, Physical Review B 92, 134419 (2015).
- Gavoille et al. (1987) G. Gavoille, C. Gleitzer, and G. J. Long, Revue de chimie minérale 24, 42 (1987).
- Modaressi et al. (1983) A. Modaressi, A. Courtois, R. Gerardin, B. Malaman, and C. Gleitzer, J. Solid State Chem. 47, 245 (1983).
- Shi et al. (2013) Q. Shi, L. Zhang, M. E. Schlesinger, J. Boerio-Goates, and B. F. Woodfield, J. Chem. Thermodyn. 62, 86 (2013).
- Boudin and Lii (1998) S. Boudin and K.-H. Lii, Acta Crystallographica Section C: Crystal Structure Communications 54, 5 (1998).
- Garlea et al. (2010) V. O. Garlea, B. C. Chakoumakos, S. A. Moore, G. B. Taylor, T. Chae, R. G. Maples, R. A. Riedel, G. W. Lynn, and D. L. Selby, Applied Physics A 99, 531 (2010).
- Rodríguez-Carvajal (1993) J. Rodríguez-Carvajal, Physica B 192, 55 (1993).
- Toth and Lake (2015) S. Toth and B. Lake, J. Phys.: Cond. Matt. 27, 166002 (2015).
- Schiffer and Daruka (1997) P. Schiffer and I. Daruka, Physical Review B 56, 13712 (1997).
- B. Martínez, F. Sandiumenge, A. Rouco, A. Labarta, J. Rodríguez-Carvajal, M. Tovar, M.T. Causa, S. Galí and Obradors (1992) B. Martínez, F. Sandiumenge, A. Rouco, A. Labarta, J. Rodríguez-Carvajal, M. Tovar, M.T. Causa, S. Galí and X. Obradors, Phys. Rev. B 46, 786 (1992).
- Fåk et al. (2005) B. Fåk, R. A. Sadykov, J. Flouquet, and G. Lapertot, J. Phys.: Cond. Matt. 17, 1635 (2005).
- Hammond and Hammond (2001) C. Hammond and C. Hammond, Basics of crystallography and diffraction, Vol. 214 (Oxford, Oxford University Press, New York, 2001).
- Minakov et al. (1990) A. Minakov, I. Shvets, and V. Veselago, Journal of Magnetism and Magnetic Materials 88, 121 (1990).
- Gomonay and Loktev (2002) H. Gomonay and V. M. Loktev, J. Phys.: Cond. Matt. 14, 3959 (2002).