Historical Review of Recurrence Plots
Abstract
In the last two decades recurrence plots (RPs) were introduced in many different scientific disciplines. It turned out how powerful this method is. After introducing approaches of quantification of RPs and by the study of relationships between RPs and fundamental properties of dynamical systems, this method attracted even more attention. After 20 years of RPs it is time to summarise this development in a historical context.
1 Introduction
The technique known as recurrence plot is 20 years old. However, recurrences were studied and employed long before. The Maya calender is one example where we can find the principle of recurrences as the basic idea. We encounter recurrences in different aspects in nature and social life.
With the birth of the modern mathematics in the 19th century recurrence was discovered to be a fundamental property of conservative dynamical systems. Poincaré formulated his thesis in the work about the restricted three-body system, which won him a prize sponsored by Oscar II of Sweden and Norway. Poincaré found that “In this case, neglecting some exceptional trajectories, the occurrence of which is infinitely improbable, it can be shown, that the system recurs infinitely many times as close as one wishes to its initial state.” (translated from poincare1890 ). In the following years, several important mathematical works were performed (e.g. kac47 ).
However, more than a half century had to pass for recurrences to be comprehensively studied on numerical simulations and real measurements. Not until the introduction of powerful computers such numerically costly studies were possible. As an example, we may take the Lorenz system, which was one of the first numerical models exhibiting recurrences and chaotic behaviour lorenz63 . Recurrences were analysed by first return maps procaccia1987 , space time separation plots provenzale92 , return time and recurrence time statistics balakrishnan2000 ; hirata99
The persistent growth of computer power allowed even more computer intense investigations, as a pair-wise comparison of all possible combinations of pairs of a data series. This can be done by the similarity matrix, a graphical representation of the similarity of all pair-wise combinations in the considered data series. Although strictly speaking, the idea of a distance metric can be traced back to the Pythagorean Theorem, the modern concept of this tool dates back to the 1920s in both applicative thurstone1927 as well as methodological fields mahalanobis1936 . The work of Kruskal in the 1960s kruskal1964a was one of the most quoted works in statistics and deeply affected many fields of investigation from ecology to psychology and economics. All these fields appeared as separate by physical science so that the appreciation of these works remained limited in physics. However, these authors deeply investigated and exploited this approach for an analysis of distance spaces allowing for an unbiased representation of virtually all kind of data without any constraint about their characteristics. In this manner, they paved the way for the nowadays recognized ability of recurrence based methods to deal with non-stationary, non-linear and relatively short data series.
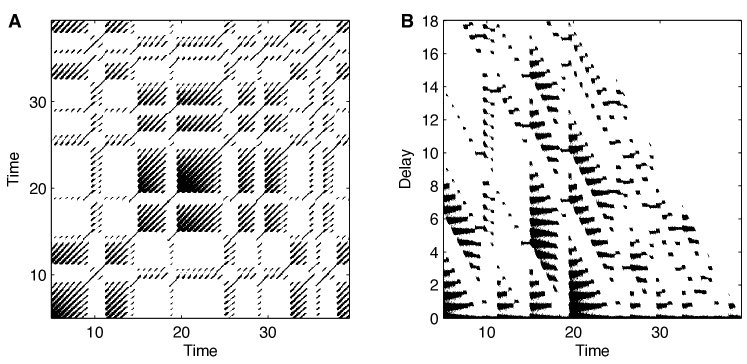
With the intense usage of computers, the similarity matrix was re-invented by several scientific disciplines around the change from the 1970s to 1980s, and therefore different terms for the same technique, like dot plot church1993 , contact map domany2000 ; holm1993 , similarity matrix krishnan1986 ; kruskal1983 or distance matrix sakoe1978 emerged. In the field of chaos theory it found its way a few years later as the recurrence plot eckmann87 (Fig. 1A). Now the aim was to compare all possible states represented by a higher-dimensional phase space trajectory. In case the trajectory runs through a region in the phase space it passed before, then we consider it as a recurrence. A recurrence means that the recurrent state is somehow similar to a former state. This definition of similarity offers leeway to adopt the method to the needs of the investigation, as we will see later. Thus, the recurrence plot technique was not really new. The intention of Eckmann et al. was to have another representation of the dynamics of the systems. However, they immediately noted that further important information, like determinism, divergence and drifting behaviour can be found in such plots. They also stated that the lengths of the diagonal line structures in the RP are related to the positive Lyapunov exponent.
2 The birth of the recurrence plot
By utilisation of the similarity matrix as a tool to visualise recurrences of higher-dimensional phase space trajectories, Eckmann et al. did not expect to establish a new direction in nonlinear data analysis. Nevertheless, 1987 is considered to be the birth of recurrence plots and their quantification as a modern tool of nonlinear data analysis.
Short time later (no later than 1992), different authors independently introduced another kind of representation of recurrences mindlin92 ; zbilut90 . They did not compare all possible time points, but only a given time into the past and future (Fig. 1B). Here a further name appeared: the close returns plot. Such a representation can be more intuitive, in particular for beginners, because the line structures of the recurrence plot will be parallel to the -axis.
3 Recurrence quantification analysis
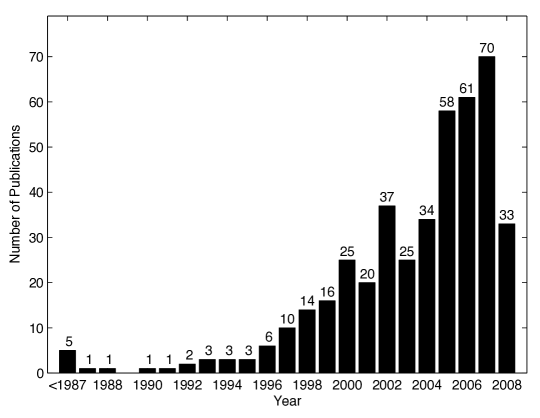
These first years were characterised by a rather rare application of this method (Fig. 2). The appearance of recurrence plots in publications was somehow exotic. Moreover, up to this time, recurrence plots were just a visualisation tool, what yielded to the disadvantage that the user had to detect and interpret the patterns and structures revealed by the recurrence plot. Low screen and printer resolutions further worsened this issue. To overcome this subjective part of the method, starting in the late eighties, Zbilut and Webber tried to quantify the structures of the RP. At first they just determined the density of recurrence points in the RP and studied the histogram of the lengths of diagonal lines webber94 ; zbilut92 ; zbilut2007a . In the following five years, they introduced the known measures of complexity based on diagonal line structures of recurrence plots and therewith established the recurrence quantification analysis (RQA):
-
•
percentage recurrences or recurrence rate
-
•
percentage determinism
-
•
maximal line length and divergence
-
•
Shannon entropy of the distribution of the line lengths
-
•
trend.
For a definition of these measures we refer to marwan2007 . The usefulness of these measures was shown by an increasing number of applications to real data. However, until 1995, only few applications of RPs and RQA appeared in publications.
Since the early nineties, Webber provides a freely available software (RQA Software) which can be used to compute RPs and the RQA measures. In 1996, Kononov started the Visual Recurrence Analysis (VRA) software. It has a user-friendly graphical interface and computational enhancements. Therefore, this software is rather popular. The TISEAN package, provided by Hegger, Kantz and Schreiber, was also one of the first software packages able to compute RPs (but without quantification, just RPs). For locations of these software in the WWW we refer to the web site http://www.recurrence-plot.tk.
As a next milestone we find the introduction of the time-dependent RQA. The RQA measures are calculated from windows moved along the main diagonal of the RP. This allows for the study of the evolution of the RQA measures over time trulla96 . It was shown that with this approach it would be possible to detect transitions in dynamical systems. At this moment, only transitions between regular and non-regular dynamics (like period-chaos transitions) could be detected. In the same year, a publication with the promising title “Recurrence plots revisited” by casdagli97 appeared. It suggested to use RPs to reconstruct the driving force of dynamical systems and introduced the idea of meta recurrence plots, based on windowing and correlation sum.
The major methodological work on the RP and RQA during the 1990s was performed by the group around Zbilut and Webber in Chicago. Since the mid-1990s, the scientific community became more and more aware of RPs, as the continuously increasing number of publications between 1996 and 2004 demonstrates (Fig. 2).
Towards the end of the 1990s, first theoretical studies on the RP regarding their relationship with dynamical invariants and the preservation of the topology appeared. McGuire et al. analytically demonstrated that the distance matrix as the base of the RP preserves all information to reconstruct the underlying data series mcguire97 . Faure and Korn have shown that the cumulative distribution of the lengths of the diagonal lines is directly related to the entropy faure98 . The link between the columns of the RP and the information dimension was discussed by Gao and Cai gao2000 .
In 1998, Iwanski et al. already discussed the issue whether it is really necessary to embed in order to derive quantities for the description of the dynamics. The authors based their discussion on more heuristic numerical work and by using the RQA measure maximal line length. This issue was further discussed by Gao and Cai gao2000 , who also used the RP in order to estimate recurrence times. They defined two types of recurrence times based on the vertical distance between recurrence points in the RP.
In 1999, the perpendicular RP was suggested as a refinement in order to estimate the divergence of the states choi99 . Here a recurrence is defined using the additional condition that the recurrence points have to lie on a plane which is perpendicular to the phase space trajectory of the reference point. The iso-directional RP, introduced in 2002, goes in a similar direction horai2002 . Its additional recurrence condition requires that the recurrent phase space trajectories have to evolve in parallel, i.e. in the same direction. Unfortunately, these variants of a RP are not popular, probably because of their higher computational efforts.
4 Extensions for the recurrence plot and quantification analysis
Also around the change to the new millennium, the RP technique was extended to the bivariate cross recurrence plot (CRP) marwan99 ; zbilut98 . This bivariate extension tests for simultaneous occurrences of similar states in two different systems. Consequently, cross recurrence quantification analysis followed. This technique can be used to detect deterministic signals zbilut98 and to study complex interrelations between different systems marwan2002pla ; marwan2003climdyn . Here delay based variants of the RQA measures were introduced marwan2002pla . Furthermore, CRPs appeared rather illustrative to study differences or transformations of time scales of similar observations marwan2002npg . This feature was later used to understand changing shapes of line structures in RPs marwan2005 . The detection of deterministic signals by using RQA was further demonstrated by Zbilut et al. zbilut2000a .
With the introduction of CRPs, the freely available CRP Toolbox for MATLAB, written by Marwan, appeared. This toolbox is platform independent and contains almost all RP related tools and measures. It is noteworthy that also commercial software started to include at least the computation of RPs, like Dataplore (ixellence GmbH, Germany). For locations of these software in the WWW we again refer to the web site http://www.recurrence-plot.tk
With the new millennium, further measures of complexity were added to the RQA. Marwan et al. introduced measures based on vertical line structures in the RP and are called laminarity and trapping time marwan2002herz . Using these measures it was possible to detect chaos-chaos transitions.
At the same time, in bio-informatics RPs and RQA were employed to investigate the spatial structure of biopolymers giuliani2002a . This was a deep change in perspective, because here these methods do not analyse time series but spatial series or even spatial structures (starting directly from distance matrices without the need of a pre-existing series, webber2001 ) and makes the technique to come back to its ‘purely statistical’ lineage (as opposite to the dynamical lineage).
5 Theoretical basis and dynamical invariants
Between 2002 and 2006, Romano and Thiel published several pioneering articles related to different aspects of RPs. They theoretically justified the choice of the recurrence threshold for data with observational noise and were able to analytically describe an RP for noise thiel2003 ; thiel2002 . They explained the link between the line lengths of the diagonal lines and the dynamical invariants thiel2004a . This work led to further studies about the influence of embedding march2005 ; thiel2004b ; thiel2006
In 2004, a real multivariate extension of RPs, the joint recurrence plot (JRP) was introduced romano2004 . JRPs test for simultaneous occurrences of recurrences in different systems and are proper means for the detection of general synchronisation romano2004b . Romano et al. have further demonstrated how to use a delay based RQA measure for the detection of phase synchronisation, even for non-phase coherent oscillators romano2005 . This technique can be used to detect the direction of the coupling between systems romano2007 . During this time, the idea of twin surrogates appeared, which are dynamics preserving surrogates based on recurrences marwan2007 ; thiel2008 . Such surrogates can be used to derive a statistical inference for a synchronisation analysis. Moreover, a spatial extension of RPs was introduced, resulting in RPs of higher dimension (like 4D or 6D) marwan2007pla .
As we can see, a main part of theoretical and methodical work was now done by the group of Marwan, Romano and Thiel in Potsdam. Consequently, a first international workshop exclusively dedicated to recurrence plots was organised in 2005 in Potsdam, Germany (33 participants).
Instead of using spatial information of the phase space trajectory for the definition of recurrence, Groth has suggested to use the local rank order groth2005 . The local rank order defines specific order patterns whose recurrences are represented by the order patterns RP. This definition of a RP can help to overcome problems with changing amplitudes (e.g. drift).
The work of the Potsdam group was continued by Zou, Ngamga, and Schinkel who worked on a theoretical approach for recurrences of quasiperiodic systems zou2007b ; zou2007a , on different kinds of transitions, as to strange non-chaotic attractors ngamga2007 , and on order patterns RPs schinkel2007 .
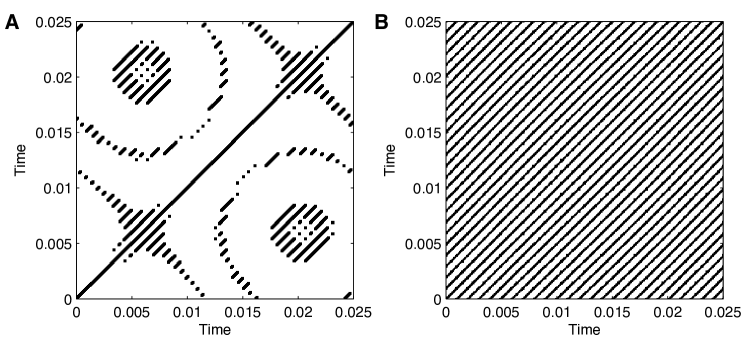
The sampling rate of oscillating signals can be of importance for the detection of recurrences facchini2007a ; facchini2005 . Under certain conditions, large gaps can appear in a RP where actually recurrence points should be (Fig. 3). This feigned disadvantage can be indeed rather helpful for the detection of slight frequency changes in oscillating signals which are not visible by standard spectral analysis.
A second international workshop on RPs was organised in 2007, this time in Siena, Italy (44 participants).
In 2008, Rohde et al. linked statistical properties of the distance matrix to the variance and covariance (at least for stochastic processes) rohde2008 . Krishnan et al. considered RPs from a completely different point krishnan2008a ; krishnan2008b . They stressed the fact that a RP can be considered as the adjacency matrix of a complex network, allowing topological analysis of networks or graphs by means of RQA. This approach is especially interesting in many interdisciplinary scientific research.
6 The spreading application fields
In the last years, RPs again received more attention. Since 2005, more than 50 publications appear per year (Fig. 2). Whereas in the beginning of the applications of RPs, the method was mainly applied in life sciences (e.g. cardiology, neuro-psychology), the method became popular in other scientific fields during the years. Starting in 1994, a first application in earth sciences kurths94 , in 1996 in finance gilmore96 , and in 1999 in engineering elwakil99 , chemistry rustici99 and applied physics vretenar99 appeared. Since 2000 we find numerous applications in many disciplines, from physiology, to biology, earth sciences, acoustics, engineering and material sciences, finance and economics, to fundamental research in chemistry and physics (for examples we refer to marwan2007 ).
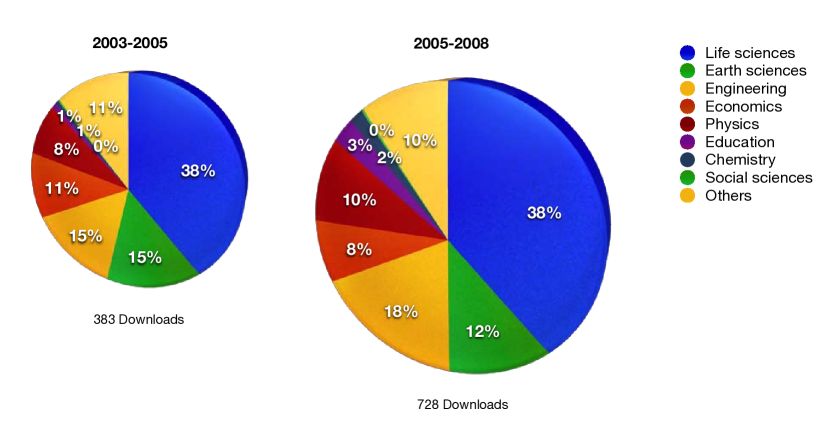
For the usage of the CRP Toolbox (cf. http://www.recurrence-plot.tk) we have a statistic of the main purposes of application, which allows us to estimate the distribution of applications of recurrence plot based techniques in different scientific disciplines since 2003 (Tab. 1, Fig. 4). Although we found few repetitions of downloads, the main distribution of application fields is not affected by such repetitions. A further problem in analysing these data is, that we sometimes got multiple choices of scientific fields, even rather unlike combinations, like earth science and neuro science. The selection of the scientific fields and sub-fields may occur rather arbitrary. We do not claim that it is a complete and best selection. However, it is mainly based on the submitted scientific fields or research interests of the users. Some noteworthy and interesting fields are hidden within the more general subjects, like artificial intelligence (in engineering), image processing or telecommunications (in computer and IT networks) or volcanology (in geophysics). Several users have not provided information about the intended purpose. We should also mention that we ensure a high data policy and use the provided data only for a statistical analysis like this.
For a usage statistics we consider two separate periods: a first period between May 2003 and October 2005 with 383 downloads and a second between November 2005 and May 2008 with 728 downloads, revealing the increasing popularity of RPs and the needs of a corresponding Matlab toolbox. The distribution of the application fields has only slightly changed between these two periods; only the increase of applications in engineering (from 15% to 18%) and the slight decrease in earth sciences (from 15% to 12%) is remarkable (Fig. 4). Therefore, in the following we discuss only the second period. The main application fields are life sciences (275 downloads), where psychology, neuro and cognitive sciences (EEG measurements) take the largest part (152 downloads) and cardiology only the third largest part (36 downloads) behind different medical problems (75 downloads). The next application fields are engineering (131), earth sciences (89), physics (72), economics (55), education (21), chemistry (12) and even social sciences (2). For 71 downloads we have not received sufficient information about the purpose of the usage.
| Field | Subject | 2003–2005 | 2005–2008 | ||
|---|---|---|---|---|---|
| Life sciences | Psychology/ cognitive and neuro sciences | 54 | 147 | 152 | 275 |
| Medicinal research/ bio-electronics | 59 | 75 | |||
| Cardiology | 24 | 36 | |||
| Genomics/ DNA sequencing | 2 | 6 | |||
| Proteins/ systems biology | 8 | 6 | |||
| Engineering | Engineering | 39 | 56 | 63 | 131 |
| Computer and IT networks | 7 | 30 | |||
| Speech signals/ audio analysis | 8 | 18 | |||
| Traffic and transportation | 2 | 14 | |||
| Metal processing and analysis | 0 | 6 | |||
| Earth sciences | Atmosphere and weather/ climatology | 10 | 59 | 29 | 89 |
| Solar and astrophysics | 9 | 14 | |||
| Hydrology | 4 | 12 | |||
| Ecology | 19 | 11 | |||
| Geology | 5 | 9 | |||
| Geophysics | 4 | 5 | |||
| Seismology | 6 | 4 | |||
| Geography | 2 | 5 | |||
| Physics | Applied physics | 20 | 31 | 38 | 72 |
| Theoretical physics | 11 | 34 | |||
| Economics | Finance and markets | 35 | 41 | 41 | 55 |
| Economics | 6 | 14 | |||
| Education/ Teaching | 3 | 21 | |||
| Chemistry | 2 | 12 | |||
| Social sciences | 1 | 2 | |||
| Others | 43 | 71 | |||
7 Outlook
A rather curious sign that RPs are at the final step to really become widely known and accepted, we conclude with the 2008 April hoax of the Australian office of the internet company Google. In a press release on April 1st, 2008, Google announced the launch of a new search technology called gDay, which would be able to accurately predict future internet content google2008 :
“…Using Google’s index of historic, cached web content and a mashup of numerous factors including recurrence plots and fuzzy measure analysis, gDay creates a sophisticated model of what the internet will look like 24 hours from now – including share price movements, sports results and news events. …”
As we know, many things Google introduced turned out to be quite popular later.
Acknowledgement
The author thanks A. Giuliani, C. Webber Jr. and J. P. Zbilut for helpful comments and suggestions. This work has been supported by the project MAP AO-99-030 of the Microgravity Application Program/ Biotechnology from the Human Spaceflight Program of the European Space Agency (ESA).
References
- (1) V. Balakrishnan, G. Nicolis, and C. Nicolis. Recurrence time statistics in deterministic and stochastic dynamical systems in continuous time: A comparison. Physical Review E, 61(3):2490–2499, 2000.
- (2) M. C. Casdagli. Recurrence plots revisited. Physica D, 108(1–2):12–44, 1997.
- (3) J. M. Choi, B. H. Bae, and S. Y. Kim. Divergence in perpendicular recurrence plot; quantification of dynamical divergence from short chaotic time series. Physics Letters A, 263(4–6):299–306, 1999.
- (4) K. W. Church and J. I. Helfman. Dotplot: A Program for Exploring Self-Similarity in Millions of Lines of Text and Code. Journal of Computational and Graphical Statistics, 2(2):153–174, 1993.
- (5) E. Domany. Protein folding in contact map space. Physica A, 288(1–4):1–9, 2000.
- (6) J.-P. Eckmann, S. Oliffson Kamphorst, and D. Ruelle. Recurrence Plots of Dynamical Systems. Europhysics Letters, 4(9):973–977, 1987.
- (7) A. S. Elwakil and A. M. Soliman. Mathematical Models of the Twin-T, Wien-bridge and Family of Minimum Component Electronic Chaos Generators with Demonstrative Recurrence Plots. Chaos, Solitons & Fractals, 10(8):1399–1411, 1999.
- (8) A. Facchini and H. Kantz. Curved structures in recurrence plots: The role of the sampling time. Physical Review E, 75:036215, 2007.
- (9) A. Facchini, H. Kantz, and E. B. P. Tiezzi. Recurrence plot analysis of nonstationary data: The understanding of curved patterns. Physical Review E, 72:021915, 2005.
- (10) P. Faure and H. Korn. A new method to estimate the Kolmogorov entropy from recurrence plots: its application to neuronal signals. Physica D, 122(1–4):265–279, 1998.
- (11) J. B. Gao and H. Q. Cai. On the structures and quantification of recurrence plots. Physics Letters A, 270(1–2):75–87, 2000.
- (12) C. G. Gilmore. Detecting linear and nonlinear dependence in stock returns: New methods derived from chaos theory. Journal of Business Finance & Accounting, 23(9–10):1357–1377, 1996.
- (13) A. Giuliani, R. Benigni, J. P. Zbilut, C. L. Webber, Jr., P. Sirabella, and A. Colosimo. Nonlinear Signal Analysis Methods in the Elucidation of Protein Sequence-Structure Relationships. Chemical Reviews, 102(5):1471–1492, 2002.
- (14) Google Inc. Australia. Google gDay.
- (15) A. Groth. Visualization of coupling in time series by order recurrence plots. Physical Review E, 72(4):046220, 2005.
- (16) M. Hirata, B. Saussol, and S. Vaienti. Statistics of Return Times: A General Framework and New Applications. Communications in Mathematical Physics, 206(1):33–55, 1999.
- (17) L. Holm and C. Sander. Protein Structure Comparison by Alignment of Distance Matrices. Journal of Molecular Biology, 233(1):123–138, 1993.
- (18) S. Horai, T. Yamada, and K. Aihara. Determinism Analysis with Iso-Directional Recurrence Plots. IEEE Transactions - Institute of Electrical Engineers of Japan C, 122(1):141–147, 2002.
- (19) M. Kac. On the notion of recurrence in discrete stochastic processes. Bulletin of the American Mathematical Society, 53:1002–1010, 1947.
- (20) A. Krishnan, A. Giuliani, J. P. Zbilut, and M. Tomita. Implications from a Network-Based Topological Analysis of Ubiquitin Unfolding Simulations. PLoS ONE, 3(4):e2149, 2008.
- (21) A. Krishnan, J. P. Zbilut, M. Tomita, and A. Giuliani. Proteins As Networks: Usefulness of Graph Theory in Protein Science. Current Protein and Peptide Science, 9(1):28–38, 2008.
- (22) G. Krishnan, R. K. Kaul, and P. Jagadeeswaran. DNA sequence analysis: a procedure to find homologies among many sequences. Nucleic Acids Research, 14(1):543–550, 1986.
- (23) J. B. Kruskal. Multidimensional scaling by optimizing goodness of fit to a nonmetric hypothesis. Psychometrika, 29(1):1–27, 1964.
- (24) J. B. Kruskal. An overview of sequence comparison, pages 1–44. Addison-Wesley, Reading, Mass., 1983.
- (25) J. Kurths, U. Schwarz, C. P. Sonett, and U. Parlitz. Testing nonlinearity in radiocarbon data. Nonlinear Processes in Geophysics, 1(1):72–75, 1994.
- (26) E. N. Lorenz. Deterministic Nonperiodic Flow. Journal of the Atmospheric Sciences, 20:120–141, 1963.
- (27) P. C. Mahalanobis. On the generalized distance in statistics. Proceedings of the National Institute of Science of India, 2(1):49–55, 1936.
- (28) T. K. March, S. C. Chapman, and R. O. Dendy. Recurrence plot statistics and the effect of embedding. Physica D, 200(1–2):171–184, 2005.
- (29) N. Marwan. Untersuchung der Klimavariabilität in NW Argentinien mit Hilfe der quantitativen Analyse von Recurrence Plots. Master’s thesis, Dresden University of Technology, Dresden University of Technology, October 1999.
- (30) N. Marwan and J. Kurths. Nonlinear analysis of bivariate data with cross recurrence plots. Physics Letters A, 302(5–6):299–307, 2002.
- (31) N. Marwan and J. Kurths. Line structures in recurrence plots. Physics Letters A, 336(4–5):349–357, 2005.
- (32) N. Marwan, J. Kurths, and P. Saparin. Generalised Recurrence Plot Analysis for Spatial Data. Physics Letters A, 360(4–5):545–551, 2007.
- (33) N. Marwan, M. C. Romano, M. Thiel, and J. Kurths. Recurrence Plots for the Analysis of Complex Systems. Physics Reports, 438(5–6):237–329, 2007.
- (34) N. Marwan, M. Thiel, and N. R. Nowaczyk. Cross Recurrence Plot Based Synchronization of Time Series. Nonlinear Processes in Geophysics, 9(3/4):325–331, 2002.
- (35) N. Marwan, M. H. Trauth, M. Vuille, and J. Kurths. Comparing modern and Pleistocene ENSO-like influences in NW Argentina using nonlinear time series analysis methods. Climate Dynamics, 21(3–4):317–326, 2003.
- (36) N. Marwan, N. Wessel, U. Meyerfeldt, A. Schirdewan, and J. Kurths. Recurrence Plot Based Measures of Complexity and its Application to Heart Rate Variability Data. Physical Review E, 66(2):026702, 2002.
- (37) G. McGuire, N. B. Azar, and M. Shelhamer. Recurrence matrices and the preservation of dynamical properties. Physics Letters A, 237(1–2):43–47, 1997.
- (38) G. M. Mindlin and R. Gilmore. Topological analysis and synthesis of chaotic time series. Physica D, 58(1–4):229–242, 1992.
- (39) E. J. Ngamga, A. Nandi, R. Ramaswamy, M. C. Romano, M. Thiel, and J. Kurths. Recurrence analysis of strange nonchaotic dynamics. Physical Review E, 75(3):036222, 2007.
- (40) H. Poincaré. Sur la probleme des trois corps et les équations de la dynamique. Acta Mathematica, 13:1–271, 1890.
- (41) I. Procaccia, S. Thomae, and C. Tresser. First-return maps as a unified renormalization scheme for dynamical systems. Physical Review A, 35(4):1884–1900, 1987.
- (42) A. Provenzale, L. A. Smith, R. Vio, and G. Murante. Distinguishing between low-dimensional dynamics and randomness in measured time series. Physica D, 58(1–4):31–49, 1992.
- (43) G. K. Rohde, J. M. Nichols, B. M. Dissinger, and F. Bucholtz. Stochastic analysis of recurrence plots with applications to the detection of deterministic signals. Physica D, 237(5):619–629, 2008.
- (44) M. C. Romano, M. Thiel, and J. Kurths. Generalized Synchronization Indices based on Recurrence in Phase Space. volume 742, pages 330–336, 2004.
- (45) M. C. Romano, M. Thiel, J. Kurths, and C. Grebogi. Estimation of the direction of the coupling by conditional probabilities of recurrence. Physical Review E, 76:036211, 2007.
- (46) M. C. Romano, M. Thiel, J. Kurths, I. Z. Kiss, and J. Hudson. Detection of synchronization for non-phase-coherent and non-stationary data. Europhysics Letters, 71(3):466–472, 2005.
- (47) M. C. Romano, M. Thiel, J. Kurths, and W. von Bloh. Multivariate Recurrence Plots. Physics Letters A, 330(3–4):214–223, 2004.
- (48) M. Rustici, C. Caravati, E. Petretto, M. Branca, and N. Marchettini. Transition Scenarios during the Evolution of the Belousov-Zhabotinsky Reaction in an Unstirred Batch Reactor. Journal of Physical Chemistry A, 103(33):6564–6570, 1999.
- (49) H. Sakoe and S. Chiba. Dynamic Programming Algorithm Optimization for Spoken Word Recognition. IEEE Transactions on Acoustics, Speech and Signal Processing, ASSP-26(1):43–49, 1978.
- (50) S. Schinkel, N. Marwan, and J. Kurths. Order patterns recurrence plots in the anaylsis of ERP data. Cognitive Neurodynamics, 1(4):317–325, 2007.
- (51) M. Thiel, M. C. Romano, and J. Kurths. Analytical Description of Recurrence Plots of white noise and chaotic processes. Izvestija vyssich ucebnych zavedenij/ Prikladnaja nelinejnaja dinamika – Applied Nonlinear Dynamics, 11(3):20–30, 2003.
- (52) M. Thiel, M. C. Romano, and J. Kurths. How much information is contained in a recurrence plot? Physics Letters A, 330(5):343–349, 2004.
- (53) M. Thiel, M. C. Romano, and J. Kurths. Spurious Structures in Recurrence Plots Induced by Embedding. Nonlinear Dynamics, 44(1–4):299–305, 2006.
- (54) M. Thiel, M. C. Romano, J. Kurths, R. Meucci, E. Allaria, and F. T. Arecchi. Influence of observational noise on the recurrence quantification analysis. Physica D, 171(3):138–152, 2002.
- (55) M. Thiel, M. C. Romano, J. Kurths, M. Rolfs, and R. Kliegl. Generating surrogates from recurrences. Philosophical Transactions of the Royal Society A, 366(1865):545–557, 2008.
- (56) M. Thiel, M. C. Romano, P. L. Read, and J. Kurths. Estimation of dynamical invariants without embedding by recurrence plots. Chaos, 14(2):234–243, 2004.
- (57) L. L. Thurstone. A law of comparative judgment. Psychological Review, 34(4):273–286, 1927.
- (58) L. L. Trulla, A. Giuliani, J. P. Zbilut, and C. L. Webber, Jr. Recurrence quantification analysis of the logistic equation with transients. Physics Letters A, 223(4):255–260, 1996.
- (59) D. Vretenar, N. Paar, P. Ring, and G. A. Lalazissis. Nonlinear dynamics of giant resonances in atomic nuclei. Physical Review E, 60(1):308–319, 1999.
- (60) C. L. Webber, Jr., A. Giuliani, J. P. Zbilut, and A. Colosimo. Elucidating protein secondary structures using alpha-carbon recurrence quantifications. Proteins: Structure, Function, and Genetics, 44(3):292–303, 2001.
- (61) C. L. Webber, Jr. and J. P. Zbilut. Dynamical assessment of physiological systems and states using recurrence plot strategies. Journal of Applied Physiology, 76(2):965–973, 1994.
- (62) J. P. Zbilut, A. Giuliani, and C. L. Webber, Jr. Detecting deterministic signals in exceptionally noisy environments using cross-recurrence quantification. Physics Letters A, 246(1–2):122–128, 1998.
- (63) J. P. Zbilut, A. Giuliani, and C. L. Webber, Jr. Recurrence quantification analysis as an empirical test to distinguish relatively short deterministic versus random number series. Physics Letters A, 267(2–3):174–178, 2000.
- (64) J. P. Zbilut, M. Koebbe, H. Loeb, and G. Mayer-Kress. Use of Recurrence Plots in the Analysis of Heart Beat Intervals. pages 263–266. IEEE Computer Society Press, 1990.
- (65) J. P. Zbilut and C. L. Webber, Jr. Embeddings and delays as derived from quantification of recurrence plots. Physics Letters A, 171(3–4):199–203, 1992.
- (66) J. P. Zbilut and C. L. Webber, Jr. Recurrence quantification analysis: Introduction and historical context. International Journal of Bifurcation and Chaos, 17(10):3477–3481, 2007.
- (67) Y. Zou, D. Pazó, M. C. Romano, M. Thiel, and J. Kurths. Distinguishing quasiperiodic dynamics from chaos in short-time series. Physical Review E, 76(1):016210, 2007.
- (68) Y. Zou, M. Thiel, M. C. Romano, and J. Kurths. Characterization of stickiness by means of recurrence. Chaos, 17(4):043101, 2007.