The close environments of accreting massive black holes are shaped by radiative feedback
Abstract
The large majority of the accreting supermassive black holes in the Universe are obscured by large columns of gas and dust[1, 2, 3]. The location and evolution of this obscuring material have been the subject of intense research in the past decades[4, 5], and are still highly debated. A decrease in the covering factor of the circumnuclear material with increasing accretion rates has been found by studies carried out across the electromagnetic spectrum[6, 1, 7, 8]. The origin of this trend has been suggested to be driven either by the increase in the inner radius of the obscuring material with incident luminosity due to the sublimation of dust[9]; by the gravitational potential of the black hole[10]; by radiative feedback[11, 12, 13, 14]; or by the interplay between outflows and inflows[15]. However, the lack of a large, unbiased and complete sample of accreting black holes, with reliable information on gas column density, luminosity and mass, has left the main physical mechanism regulating obscuration unclear. Using a systematic multi-wavelength survey of hard X-ray-selected black holes, here we show that radiation pressure on dusty gas is indeed the main physical mechanism regulating the distribution of the circumnuclear material. Our results imply that the bulk of the obscuring dust and gas in these objects is located within the sphere of influence of the black hole (i.e., a few to tens of parsecs), and that it can be swept away even at low radiative output rates. The main physical driver of the differences between obscured and unobscured accreting black holes is therefore their mass-normalized accretion rate.
Instituto de Astrofísica, Facultad de Física, Pontificia Universidad Católica de Chile, Casilla 306, Santiago 22, Chile
Chinese Academy of Sciences South America Center for Astronomy and China-Chile Joint Center for Astronomy, Camino El Observatorio 1515, Las Condes, Santiago, Chile
Kavli Institute for Astronomy and Astrophysics, Peking University, Beijing 100871, China
Institute for Astronomy, Department of Physics, ETH Zurich,Wolfgang-Pauli-Strasse 27, CH-8093 Zurich, Switzerland
Eureka Scientific Inc., 2452 Delmer St. Suite 100, Oakland, CA 94602, USA
Department of Astronomy, Kyoto University, Kyoto 606-8502, Japan
Department of Astronomy and Joint Space-Science Institute, University of Maryland, College Park, MD 20742, USA
Department of Astronomy, School of Physics, Peking University, Beijing 100871, China
Space Science Institute, 4750 Walnut Street, Suite 205, Boulder, Colorado 80301, USA
Millenium Institute of Astrophysics, Santiago, Chile
Department of Astronomy, University of Geneva, ch. d’Ecogia 16, CH-1290 Versoix, Switzerland
Institute of Astronomy, Madingley Road, Cambridge CB3 0HA, UK
NASA Goddard Space Flight Center, Greenbelt, MD 20771, USA
Our group has carried out a large multi-wavelength study of the 836 accreting supermassive black holes (i.e., active galactic nuclei or AGN) detected by the all-sky hard X-ray (14–195 keV) Swift Burst Alert Telescope survey[16, 17] (see §1 of the Methods). The energy range covered by Swift/BAT makes it ideal for studying the characteristics and evolution of the absorbing material surrounding the AGN, being unaffected by obscuration up to column densities . Moreover, this is a local sample of AGN, with a median redshift of (distance Mpc), for which reliable estimates of the black hole mass () can be obtained. We analyzed spectroscopic data in the X-ray (0.3–150 keV) and optical bands, which allowed us to place strong estimates on the column densities and intrinsic X-ray luminosities[18], and to infer the black hole mass for 392 AGN[19]. These measurements allow us to study the relation between obscuration and accretion properties for a large number of hard X-ray selected accreting black holes, in unprecedented detail.
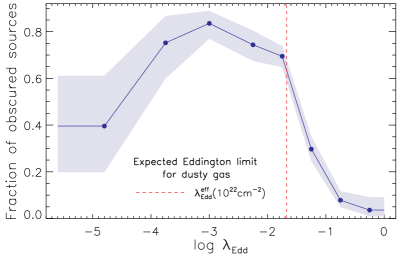
In Figure 1 we show, for this large and unbiased sample of AGN, the relation between the fraction of Compton-thin obscured sources [] and the mass-normalized accretion rate (i.e., the Eddington ratio, , see §2). The fraction of obscured sources, i.e. the covering factor of the Compton-thin circumnuclear material, exhibits a sharp decline at (dropping from % to %). This range in corresponds to the Eddington limit for dusty gas[13] (i.e., the effective Eddington limit, ). The cross-section of gas coupled with dust is in fact higher than that of ionized hydrogen[11], and the Eddington limit can be reached at (§2). The values of are normalized over the range, and the uncertainties reported on the fractions of unobscured and obscured Compton-thin AGN represent the 16th and 84th quantiles of a binomial distribution[20].
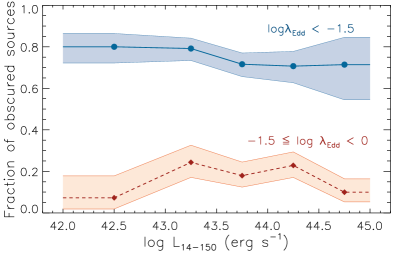
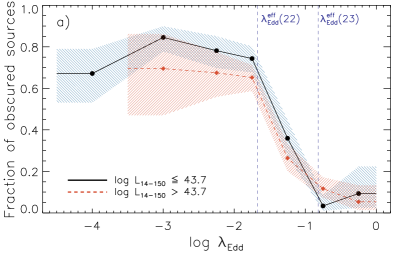
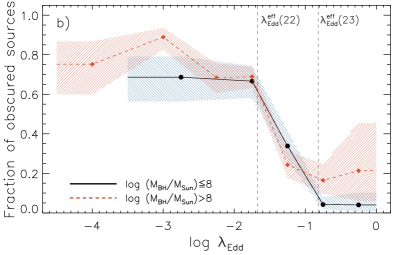
The luminosity-dependence of the fraction of obscured sources, which is clearly observed for the whole sample (§3.1), disappears almost entirely when dividing the sources into bins of (Figure 2). On the other hand, separating the sources in different ranges of luminosity and we find the same trend between and obtained for the whole sample (§3.2). Similar to what is observed for , the median column density decreases sharply from to at ; the same behaviour is also found when dividing the sample to subsets covering different ranges of luminosities and black hole mass (§3.2). These results show that the main physical mechanism regulating the covering factor and the amount of material around black holes is radiation pressure on dusty gas.
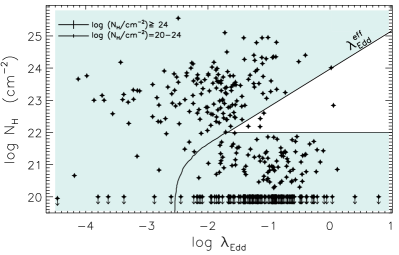
The effective Eddington limit increases with , due to the larger amounts of material that radiation pressure needs to push away for larger column densities[11]. In Figure 3 we illustrate the distribution of the sources in our sample in the diagram[13, 14] (§2). The white area corresponds to values of above the effective Eddington limit for a given column density. AGN in this region are expected to expel their circumnuclear material through radiation pressure. Only of the sources in our sample are found in this blowout region, which implies that the radiative feedback from the AGN can very efficiently clear out the close environment of the accreting black hole at . For a given value of the range of column densities observed is likely related to different viewing angles, as foreseen by the standard unification model of AGN[21], which ascribes most of the differences between obscured and unobscured AGN to different inclinations with respect to a toroidal structure of gas and dust that surrounds the accreting source.
We find a tentative decrease of at , with only of the sources being obscured by Compton-thin material. A similar trend is found for the median column density. It has been proposed that the obscuring material is related to outflows produced by radiation pressure from the accretion disk[4]. One of the postulates of such a model is that at low only a limited amount of obscuring material is puffed up, leading to a smaller covering factor. This is similar to what is shown here. Alternatively, the low Eddington ratio itself could be driven by the limited amount of dusty gas available for the accretion process.
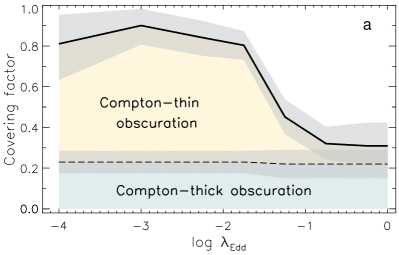
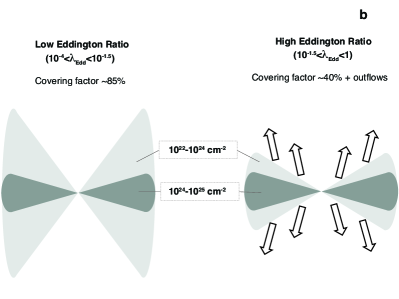
We calculated the intrinsic column density distribution of AGN in the local Universe by taking into account the selection effects of the Swift/BAT survey (§4). We find that, for AGN in the range, the fraction of Compton-thick [] AGN is , while for those with the value is . Therefore, while the covering factor of Compton-thin material decreases dramatically with increasing , the Compton-thick material does not follow the same trend. The origin of this difference may be due, at least in part, to the increase of the effective Eddington limit with increasing . In Figure 4a we show the evolution of the covering factor with the Eddington ratio, for both Compton-thin and Compton-thick material. This shows that accreting black holes with can be generally divided into two types. AGN with have obscurers with a large covering factor (), while those with have outflowing material and a smaller covering factor (), half of which is associated with Compton-thick material (see Figure 4b).
Our results imply that the probability of an AGN to be obscured is mostly driven by the Eddington ratio (i.e., a radiation-regulated unification model). This also shows that there is an intrinsic physical difference between obscured and unobscured AGN, i.e. unobscured sources have typically higher . Therefore, studies that adopt obscured AGN as a proxy for the entire AGN population may be inherently biased against highly accreting systems. The two other parameters regulating the probability of an AGN to be obscured are the inclination angle between the polar axis of the dusty gas structure and the line-of-sight, and whether the host galaxy is in the last stages of a merger or not. Both simulations[22] and recent observations[23, 24, 25] have in fact shown that mergers of galaxies can trigger the inflow of material onto the inner parsecs of the system, thus increasing the amount of obscuration.
The presence of only a small number of obscured sources at suggests very short timescales for clearing the obscuring material. This, combined with the fact that intrinsically depends on (), implies that most of the line-of-sight obscuring material is located within the region in which the gravitational potential of the black hole dominates over that of the host galaxy. If this were not the case then indeed the luminosity would be the main parameter driving the covering factor, and there should be no dependence on . However, we cannot exclude that in some cases at least part of the obscuration is related to the host galaxy. Considering a typical range of black hole masses (), this suggests that the bulk of obscuring gas and dust is found within from the black hole (see §3.2), consistent with the compact pc-scale IR-emitting structures found in local AGN by interferometric observations[26].
The results of our analysis may be considered in the framework of an evolutionary scenario for episodic black hole growth. We envisage that an initially inactive black hole (i.e., ) is triggered by an accretion event, and moves to higher and , before reaching (white region in Figure 3) and expelling most of the obscuring material. The AGN would then spend some time as unobscured before consuming all of its remaining accretion reservoir and moving back to a low . For most of the Compton-thin dusty gas is expected to be expelled from the vicinity of the black hole in the form of outflows, and could drive the elongated mid-IR emission recently identified by interferometric[27] and single dish[28] observations of AGN. Such outflows could ultimately interact with the host galaxy, potentially affecting star formation and giving rise to the observed relations between supermassive black holes and galaxy bulges[29, 30].
References
- [1] Burlon, D. et al. Three-year Swift-BAT Survey of Active Galactic Nuclei: Reconciling Theory and Observations? ApJ 728, 58 (2011).
- [2] Ueda, Y., Akiyama, M., Hasinger, G., Miyaji, T. & Watson, M. G. Toward the Standard Population Synthesis Model of the X-Ray Background: Evolution of X-Ray Luminosity and Absorption Functions of Active Galactic Nuclei Including Compton-thick Populations. ApJ 786, 104 (2014).
- [3] Ricci, C. et al. Compton-thick Accretion in the Local Universe. ApJ 815, L13 (2015).
- [4] Elitzur, M. & Shlosman, I. The AGN-obscuring Torus: The End of the “Doughnut” Paradigm? ApJ 648, L101–L104 (2006).
- [5] Merloni, A. et al. The incidence of obscuration in active galactic nuclei. MNRAS 437, 3550–3567 (2014).
- [6] Ueda, Y., Akiyama, M., Ohta, K. & Miyaji, T. Cosmological Evolution of the Hard X-Ray Active Galactic Nucleus Luminosity Function and the Origin of the Hard X-Ray Background. ApJ 598, 886–908 (2003).
- [7] Maiolino, R. et al. Dust covering factor, silicate emission, and star formation in luminous QSOs. A&A 468, 979–992 (2007).
- [8] Treister, E., Krolik, J. H. & Dullemond, C. Measuring the Fraction of Obscured Quasars by the Infrared Luminosity of Unobscured Quasars. ApJ 679, 140–148 (2008).
- [9] Lawrence, A. The relative frequency of broad-lined and narrow-lined active galactic nuclei - Implications for unified schemes. MNRAS 252, 586–592 (1991).
- [10] Lamastra, A., Perola, G. C. & Matt, G. A model for the X-ray absorption in Compton-thin AGN. A&A 449, 551–558 (2006).
- [11] Fabian, A. C., Celotti, A. & Erlund, M. C. Radiative pressure feedback by a quasar in a galactic bulge. MNRAS 373, L16–L20 (2006).
- [12] Menci, N., Fiore, F., Puccetti, S. & Cavaliere, A. The Blast Wave Model for AGN Feedback: Effects on AGN Obscuration. ApJ 686, 219–229 (2008).
- [13] Fabian, A. C., Vasudevan, R. V. & Gandhi, P. The effect of radiation pressure on dusty absorbing gas around active galactic nuclei. MNRAS 385, L43–L47 (2008).
- [14] Fabian, A. C., Vasudevan, R. V., Mushotzky, R. F., Winter, L. M. & Reynolds, C. S. Radiation pressure and absorption in AGN: results from a complete unbiased sample from Swift. MNRAS 394, L89–L92 (2009).
- [15] Wada, K. Obscuring Fraction of Active Galactic Nuclei: Implications from Radiation-driven Fountain Models. ApJ 812, 82 (2015).
- [16] Gehrels, N. et al. The Swift Gamma-Ray Burst Mission. ApJ 611, 1005–1020 (2004).
- [17] Barthelmy, S. D. et al. The Burst Alert Telescope (BAT) on the SWIFT Midex Mission. Space Sci. Rev. 120, 143–164 (2005).
- [18] Ricci, C. et al. BAT AGN Spectroscopic Survey – V. X-ray properties of the Swift/BAT 70-month AGN catalog. Submitted to ApJS .
- [19] Koss, M. J. et al. BAT AGN Spectroscopic Survey I: Spectral Measurements, Derived Quantities, and AGN Demographics. Submitted to ApJS .
- [20] Cameron, E. On the Estimation of Confidence Intervals for Binomial Population Proportions in Astronomy: The Simplicity and Superiority of the Bayesian Approach. PASA 28, 128–139 (2011).
- [21] Antonucci, R. Unified models for active galactic nuclei and quasars. ARA&A 31, 473–521 (1993).
- [22] Hopkins, P. F. et al. A Unified, Merger-driven Model of the Origin of Starbursts, Quasars, the Cosmic X-Ray Background, Supermassive Black Holes, and Galaxy Spheroids. ApJS 163, 1–49 (2006).
- [23] Satyapal, S. et al. Galaxy pairs in the Sloan Digital Sky Survey - IX. Merger-induced AGN activity as traced by the Wide-field Infrared Survey Explorer. MNRAS 441, 1297–1304 (2014).
- [24] Kocevski, D. D. et al. Are Compton-thick AGNs the Missing Link between Mergers and Black Hole Growth? ApJ 814, 104 (2015).
- [25] Ricci, C. et al. Growing supermassive black holes in the late stages of galaxy mergers are heavily obscured. MNRAS 468, 1273–1299 (2017).
- [26] Jaffe, W. et al. The central dusty torus in the active nucleus of NGC 1068. Nature 429, 47–49 (2004).
- [27] Hönig, S. F. et al. Dust in the Polar Region as a Major Contributor to the Infrared Emission of Active Galactic Nuclei. ApJ 771, 87 (2013).
- [28] Asmus, D., Hönig, S. F. & Gandhi, P. The Subarcsecond Mid-infrared View of Local Active Galactic Nuclei. III. Polar Dust Emission. ApJ 822, 109 (2016).
- [29] Fabian, A. C. Observational Evidence of Active Galactic Nuclei Feedback. ARA&A 50, 455–489 (2012).
- [30] Kormendy, J. & Ho, L. C. Coevolution (Or Not) of Supermassive Black Holes and Host Galaxies. ARA&A 51, 511–653 (2013).
This work is dedicated to the memory of our friend and collaborator Neil Gehrels. We are grateful to the referees for their comments, which greatly helped us to improve the quality of the manuscript. We acknowledge the work done by the Swift/BAT team to make this project possible. We thank Makoto Kishimoto, Chin-Shin Chang, Daniel Asmus, Marko Stalevski, Poshak Gandhi and George Privon for valuable discussion. We thank Nathan Secrest for providing us with the stellar masses of the Swift/BAT sample. This paper is part of the Swift BAT AGN Spectroscopic Survey. This work is sponsored by the Chinese Academy of Sciences (CAS), through a grant to the CAS South America Center for Astronomy (CASSACA) in Santiago, Chile. We acknowledge financial support from FONDECYT 1141218 (CR, FEB), FONDECYT 1160999 (ET), Basal-CATA PFB–06/2007 (CR, ET, FEB), the China-CONICYT fund (CR), the Swiss National Science Foundation (Grant PP00P2_138979 and PP00P2_166159, KS), the Swiss National Science Foundation (SNSF) through the Ambizione fellowship grant PZ00P2_154799/1 (MK), the NASA ADAP award NNH16CT03C (MK), the National Key R&D Program of China grant No. 2016YFA0400702 (LH), the National Science Foundation of China grants No. 11473002 and 1721303 (LH), the ERC Advanced Grant Feedback 340442 (ACF), and the Ministry of Economy, Development, and Tourism’s Millennium Science Initiative through grant IC120009, awarded to The Millennium Institute of Astrophysics, MAS (FEB). Part of this work was carried out while CR was Fellow of the Japan Society for the Promotion of Science (JSPS) at Kyoto University. This work was partly supported by the Grant-in-Aid for Scientific Research 17K05384 (YU) from the Ministry of Education, Culture, Sports, Science and Technology of Japan (MEXT). We acknowledge the usage of the HyperLeda database (http://leda.univ-lyon1.fr).
C.R. wrote the manuscript with comments and input from all authors, and performed the analysis. B.T. calculated the bolometric corrections, B.T., M.J.K., K.O. and I.L. analyzed the optical spectra and inferred the black hole masses, C.R. carried out the broad-band X-ray spectral analysis and Y.U. calculated the intrinsic column density distribution of AGN for different ranges of Eddington ratio.
The authors declare that they have no
competing financial interests. Correspondence and requests for materials
should be addressed to C.R.
(email: cricci@astro.puc.cl).
Methods
1 The 70-month Swift/BAT AGN sample
The Burst Alert Telescope (BAT[17, 1]) on board the Swift satellite[16] has been carrying out an all-sky survey in the 14–195 keV energy range since December 2004. The latest release of the Swift/BAT source catalogue[2] contains 836 AGN detected in the first 70 months of the mission. Among these, a total of 105 blazars were identified from the latest release of the Rome BZCAT catalogue[3] and based on recent literature. In the following we will refer only to the 731 non-blazar AGN, to avoid effects related to beaming and extended X-ray sources. The non-blazar AGN sample is local, with a median redshift and distance of and Mpc, respectively. The all-sky coverage and hard X-ray selection, together with the fact that the sample is dominated by local AGN, makes it possibly the best existing sample to study the relation between the obscuration and the physical characteristics of these accreting supermassive black holes (SMBHs). The Swift/BAT AGN spectroscopic survey (BASS) is a large effort our group has been carrying out to study local hard X-ray selected AGN across the entire electromagnetic spectrum, and in particular in the X-ray and optical regimes (§1.2). The first results of BASS include the study of the 55 Compton-thick AGN detected by Swift/BAT [Ref. 3, see also Ref. 4, 5], the analysis of near-IR emission lines[6], the study the relation between AGN X-ray emission and high-ionisation optical emission lines [Ref. 7, see also Ref. 8], the study of the link between the physical parameters of the accreting SMBH and optical narrow emission lines[9], and the analysis of the relationship between the X-ray photon index and the Eddington ratio[10].
1.1 X-ray data and spectral analysis.
X-ray data at softer energies (0.3–10 keV) are available for 834 out of the 836 sources (99.8%) reported in the 70-month Swift/BAT catalogue. A detailed account of the reduction, cross-calibration, and spectral analysis of the entire X-ray dataset is given in Ref. 18, and here we highlight the aspects relevant for the analysis of the non-blazar in the present study. The X-ray spectral analysis was carried out in the 0.3–150 keV range by combining the 70-month averaged Swift/BAT spectra with data below 10 keV collected using Swift/XRT XMM-Newton/EPIC, Chandra/ACIS, Suzaku/XIS, and ASCA/GIS/SIS. The 0.3–150 keV spectra were typically modelled considering the following components: i) an absorbed power-law model with a high-energy cutoff, to reproduce the primary X-ray emission (considering both photoelectric absorption and Compton scattering); ii) an unobscured reflection component, which was taken into account by using a slab reflection model (pexrav[11]); iii) a soft excess component; iv) a Gaussian line to reproduce the Fe K emission line[12, 13, 14]; v) a cross-calibration constant to account for possible flux variability and calibration uncertainties between the soft X-ray observations and the 70-months averaged hard X-ray emission. For unobscured AGN we used a blackbody model to reproduce the soft excess, while for obscured sources we included a scattered component in the form of a power-law with a cutoff. The normalization and photon index of the scattered emission were fixed to those of the primary X-ray emission, and this component was multiplied by a constant, which was left free to vary and had a typical value of a few percent[15, 16]. For obscured AGN we also considered, when warranted by the data, emission from collisionally ionized plasma. We included additional Gaussian features to remove possible residuals in the rest-frame 6–7.5 keV region and/or below 4 keV. In order to improve the constraints on the column density and intrinsic luminosity, we fitted the broad-band X-ray spectra of the AGN with consistent with within their confidence intervals with a physical torus model[17], which considers absorption and reflection for a spherical-toroidal geometry. To this model we added a scattered component and, if required by the data, additional components of Gaussian lines, a cross-calibration constant and collissionally ionized plasma. Completely unabsorbed AGN [] were arbitrarily assigned . The median of the 90 confidence interval of the column density is dex for AGN with , and dex for Compton-thick AGN.
The intrinsic luminosity in the 2–10 keV range (i.e., absorption and k-corrected) was calculated assuming a cosmological model with , and . The first results of this work have been reported in Ref. 3, where we found that the intrinsic fraction of Compton-thick [] AGN is , and discussed the intrinsic distribution of of AGN in two luminosity bins. The identification of Compton-thick sources in Ref. 3 has been recently confirmed by an independent work carried out using a Bayesian approach[5].
1.2 Optical data and black hole masses.
Optical spectroscopy has been obtained for 642 AGN, allowing to infer black hole masses () for 429 non-blazar AGN, of which 232 are unobscured, 166 are Compton-thin obscured and 31 are Compton-thick AGN. We refer the reader to Ref. 19 for a detailed description of the data and procedures used to derive black hole masses. We briefly outline in the following how we selected the most robust black hole mass estimates for our sources, and the number of objects for which each black hole mass estimation was adopted.
First, for 51 of our AGN, we used literature values reported by studies where was determined through “direct” methods, including maser emission (eight AGN), spatially resolved gas- or stellar-kinematics (four and two objects, respectively), and/or reverberation mapping (37 AGN, using the recent compilation of Ref. 18). Next, for 213 AGN we derived masses from single-epoch spectra of either the broad H (170 objects) or H (43 sources) emission lines, following prescriptions that are fundamentally based on the results of reverberation mapping. From this subset we removed the 37 sources with , as their black hole masses are likely underestimated because of extinction of the optical emission, and particularly the continuum and/or the broad Balmer lines. For H, we used the same spectral decomposition method and prescription as described in Ref. 19. For H, we used the spectral decomposition method described in Ref. 20, and the prescription of Ref. 21. The uncertainties on these single-epoch determinations are of order dex [e.g., Ref. 22, 23 and references therein]. Finally, for 165 objects, was estimated by combining measurements of the stellar velocity dispersion, , and the relation, using the prescriptions outlined in Ref. 30. For these objects the uncertainties on are also dex[24]. Among the sources with the black hole masses were obtained using broad H (156), reverberation mapping (35), broad H (20), velocity dispersion (19), stellar (1) and gas (1) kinematics. For the objects with we used velocity dispersion (146), masers (8), reverberation mapping (2), and gas (3) and stellar (1) kinematics. The objects with black hole masses are a representative subsample of all Swift/BAT detected AGN: performing a Kolmogorov-Smirnov test on the two distributions of the intrinsic 14-150 keV luminosity we obtain a p-value of .
2 The Eddington limit for dusty gas and the diagram
The Eddington limit is defined as the luminosity at which the radiation pressure from a source, in this case the accreting SMBH, balances the gravitational attraction. This is typically determined using the following equation:
| (1) |
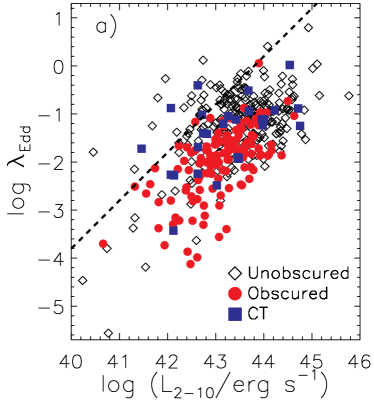
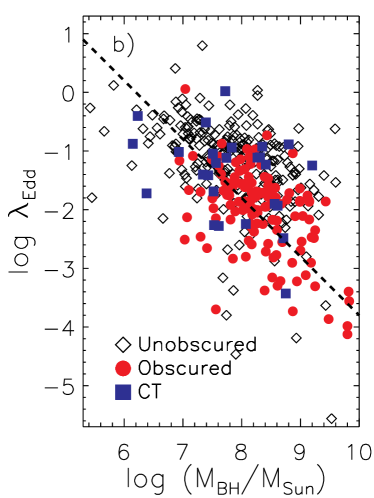
where is the gravitational constant, is the mass of the system (in this case ), is the mass of the proton, is the speed of light, and is the Thomson cross-section. The Eddington ratio is the ratio between the bolometric and the Eddington luminosity (). Here we calculated the bolometric luminosity from the intrinsic (i.e. absorption and k-corrected) 2–10 keV luminosity, using a 2–10 keV bolometric correction (Ref. 25). We conservatively estimate that the typical uncertainty on is dex. The Eddington ratio distribution of the sources of our sample divided into unobscured [], obscured [] and Compton-thick [] AGN is shown in Extended Data Figure 1, while in Extended Data Figure 2 we show the scatter plot of versus the 2-10 keV luminosity (; panel a) and (panel b).
The cross-section of the process used in Equation 1 is that of the photon-electron scattering (i.e. the Thomson cross-section), so that the Eddington limit is defined for ionized hydrogen. However, if the material includes both dust and gas, then the effective cross-section[11] of the interaction between radiation and matter, , is larger, . The effective cross section is averaged over the incident spectrum, and depends on the physical properties of the material (i.e., , ionization state, chemical composition, dust content). Therefore, for dusty gas, the effective Eddington limit would be lower[11, 26] than that obtained using from Equation 1. One can define the effective Eddington limit as , where the boost factor[11] can simply be thought as the ratio between the effective, frequency-weighted absorption cross-section and the cross-section for ionized hydrogen: . For the force exerted by the radiation field surpasses that of the gravitational pull.
Using cloudy[27] it has been shown[11, 13, 14] that, for dusty gas, the boost factor ranges from several hundred (for ) to unity (for ). Since dust absorption is greater in the UV, this portion of the SED has the strongest influence in driving the material away. However, in the UV the material becomes optically thick already at , so that the outer layers are pushed by the inner ones. As explained by Ref. 13, the X-ray emission keeps the gas and dust weakly ionized, ensuring that they are effectively bound by Coulomb forces and that the pressure on the dust grains is also exerted on the (partially) ionized gas.
It should be noted that the accretion disc is thought to emit anisotropically, with the frequency-specific flux density decreasing with higher inclination angles (). Moreover, the UV radiation, which constitutes most of the bolometric output of the AGN, may be even more strongly collimated than the optical radiation (i.e., due to limb darkening). Thus, one would expect that also the radiation pressure exerted on the dusty gas has a similar dependency on the inclination angle[28]. This could contribute to the anisotropy of the obscuring material, since radiation pressure would preferentially remove gas and dust located pole-on with respect to the accretion disk. The values of for different grain compositions have been calculated by Ref. 14, who showed that, considering a grain abundance typical of the interstellar medium, the accreting SMBH would be able to push away material with a column density of () already at (). The increase of with is due to the larger weight radiation pressure needs to push away.
One can define a forbidden (or blowout) region in the diagram where long-lived clouds of dusty gas cannot exist, due to radiation pressure[13, 14, 29, 29, 30]. The diagram for the sources of our sample is shown in Figure 3, together with the theoretical values of for dusty gas[14] as a function of . We extend here the effective Eddington ratio to by linearly extrapolating from (Ref. 14) to . We find that most of the sources of our sample are well within the limits expected by radiation pressure on dusty gas, and tend to lie outside the forbidden region (the white area in the figure).
3 The covering factor of the Compton-thin obscuring material and its relation with luminosity and Eddington ratio
3.1 Obscuration and luminosity.
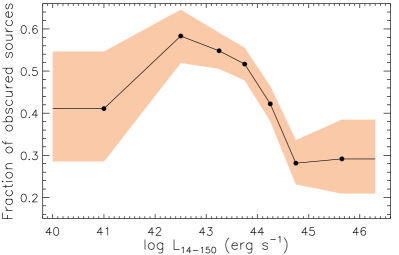
The fraction of obscured Compton-thin sources () is directly connected to the covering factor of the obscuring material surrounding the accreting SMBH. The first evidence of a decrease of with AGN luminosity was obtained studying the ratio between type-I and type-II AGN (i.e., objects with and without broad optical emission lines, respectively) more than 30 years ago[31]. This trend was confirmed by successive optical studies[9, 32], while X-ray studies have clearly shown that the fraction of Compton-thin obscured sources decreases with the luminosity[6, 33, 34, 35, 36, 37, 38, 39, 2, 5, 40, 41, 42] with a slope of in the range[35]. This trend was also shown to reproduce the observed decrease of the Fe K equivalent width with increasing luminosity[43] (i.e., the X-ray Baldwin effect[44, 45, 46]), and it has been shown to be due to the intrinsically different space densities of obscured and unobscured AGN for a given luminosity[47, 1]. In the IR, the covering factor of the dust can be inferred as the ratio between the mid-IR and the bolometric luminosities. This is driven by the idea that the fraction of the bolometric AGN luminosity reprocessed by the dust surrounding the accreting system is proportional to the covering factor of the dusty absorber. Similarly to what was found in the optical and X-ray bands, several IR studies have shown that the covering factor of the dust decreases with the bolometric luminosity[7, 8, 48, 49, 50, 51, 52, 53, 54, 55]. We note, however, that several other IR studies of high-luminosity AGN (including at high redshifts) do not identify such a trend[56].
The covering factor of the obscuring material in the IR can also be obtained by fitting the SED with torus models[57, 58, 59, 60, 61, 62, 63, 64], and analyses performed using clumpy torus models have confirmed the existence of a decrease of the covering factor of the dust for increasing luminosities[65, 66], while showing that typically the tori of type-II AGN have a larger number of clouds than those of type-I AGN[67]. This is likely to be a selection effect: considering a randomly drawn inclination angle, sources with large tori and high numbers of clouds are more likely to be observed as type-II AGN[68].
The receding torus model[9], which was proposed to explain the decrease of the covering factor of the absorber with the luminosity, foresees that the inner radius of the obscuring material is set by the dust sublimation radius[69, 70, 71], which scales with luminosity following . Assuming that the height of the torus does not change, this model predicts that the fraction of the accreting system covered by the obscuring material would be . However, X-ray studies have shown that the slope of the trend is flatter than expected by this model[1]. Moreover, using optically-selected sources it has been recently argued that the relation between the fraction of type-I AGN and the luminosity appears to be more complex, and that the Eddington ratio might play a role[20]. X-rays are absorbed by both dust and gas, so that pushing further away the sublimation radius for increasing luminosities may not be enough to affect X-ray obscuration. It has been recently proposed that, while in low-luminosity sources most of the absorption could be related to the dusty torus, in AGN with high luminosity part of the obscuration might be due to dust-free clouds in the broad-line region located well within the sublimation region[72]. These clouds would obscure only the X-ray emission and not the optical radiation, and could explain the existence of sources that are optically unobscured but show evidence of absorption in their X-ray spectra[5]. In a recent work carried out using a physical IR torus model[53], it has been shown that the anisotropic emission of the torus should be taken into account when computing the dust covering factors, and would flatten the decline with luminosity. Similarly, it has been proposed[73] that the anisotropic reprocessed X-ray radiation from the torus might affect the relation between and the X-ray luminosity. Several of the outstanding issues with the X-ray-through-IR unification scheme of AGN, and particularly the receding torus model, are discussed in recent reviews[74, 75].
3.2 Obscuration and Eddington ratio.
While the relation between the covering factor and the luminosity has been the subject of intense study over the past decades, very little is currently known about the effect of the Eddington ratio on obscuration. Possible evidence of a difference in the distributions of obscured and unobscured AGN has been found by earlier studies carried out using Swift/BAT[77] and INTEGRAL IBIS/ISGRI[37], and from the analysis of AGN at higher redshifts in the Cosmic Evolution Survey field[78]. More recently, it has been suggested[79] that the relation might have a shape similar to that of the relation, and that the Eddington ratio might drive the covering factor of dust[80]. However, none of the studies carried out so far was able to disentangle the lower average of obscured AGN from the underlying differences in the luminosity functions of obscured and unobscured AGN.
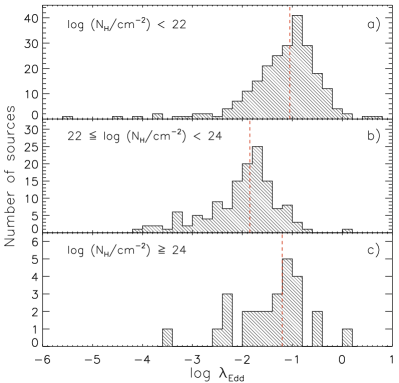
The dependence of the on the luminosity disappears when dividing the sample into different bins of . This is confirmed by performing a linear fit on , which results in slopes of and , for the and bin, respectively. The disappearance of a strong correlation between and the luminosity is also found using different thresholds of (e.g., and ). Performing a linear fit on in the range we obtained a p-value of 0.003, showing the existence of a significant correlation. The strong dependence of the fraction of obscured sources on is confirmed by the fact that dividing our sample into different ranges of the intrinsic 14–150 keV luminosity or black hole mass (panels a and b of Extended Data Figure 4, respectively) all subsets of sources show the same trend observed for the whole sample. The same result is obtained when using different thresholds of luminosity (e.g., and ), black hole mass [e.g., and ], or removing objects with luminosities . The fraction of obscured sources decreases more steeply in the range than in the range . Performing a linear fit we find and for the former and latter intervals in , respectively. The similar linear fit over the range yields . In calculating the fractions of obscured Compton-thin AGN we took into account the fact that we have a slightly larger number of unobscured AGN than obscured AGN for which the black hole mass was estimated. We find a significant positive correlation (p-value=0.0064, slope ) between and for objects with . This is likely, at least in part, a selection effect, consistent with the idea that larger column densities are necessary to withstand increasing radiation pressure.
We verified whether the presence of mergers might affect our results, since the AGN in these objects might be significantly more obscured than those in isolated galaxies[23, 24, 4, 25]. In order to be conservative, we removed from our sample the 32 AGN found in interacting systems (e.g., Ref. 81), including galaxies both in early and late merger stages. We found for this subsample a relation between obscuration and Eddington ratio consistent with what we obtained for the whole sample. Similarly, the relation between and the luminosity disappears for this subsample when dividing into different bins of .
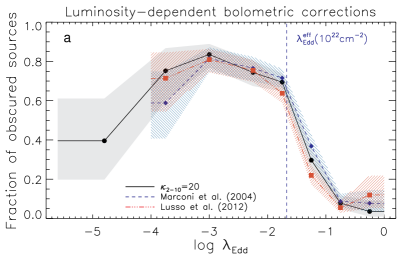
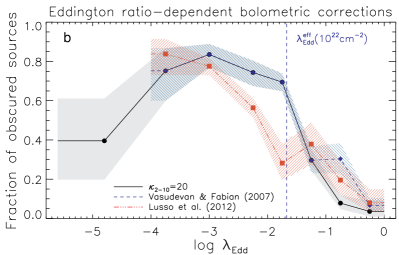
Our results are largely unaffected by the bolometric corrections adopted. Considering luminosity-dependent bolometric corrections[82, 78] we find the same sharp decrease in the fraction of obscured sources at (Extended Data Figure 5a). Similarly, using the Eddington-ratio dependent bolometric corrections of Ref. 83 we find results in very good agreement with what was obtained assuming (Extended Data Figure 5b). Assuming the -dependent bolometric corrections of Ref. 78 we find that the decrease of is found at lower Eddington ratios (). This is due to the fact that the bolometric correction at low is extremely small (). Moreover, using these corrections we find that 70 sources are accreting at , which corresponds to of our sample. Such a large fraction of super Eddington sources in our local AGN sample is rather unlikely.
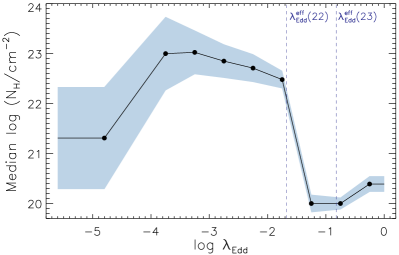
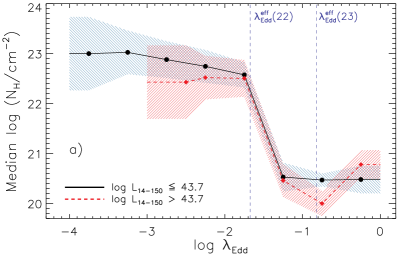
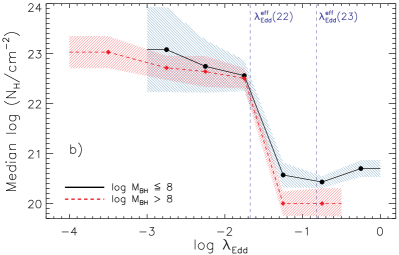
In agreement with the idea that radiation pressure is the main driver of nuclear obscuration, the median column density decreases very rapidly at (with a significance of , Extended Data Figure 6). A similar trend is observed dividing the sample into different ranges of the intrinsic 14–150 keV luminosity and of black hole mass (panels a and b of Extended Data Fig. 7, respectively).
The radius of the sphere of influence[84] () is , where G is the Gravitational constant. Considering the relation between black hole mass and stellar velocity dispersion[30] [] for black hole masses in the range, the radius of the sphere of influence would be .
An increase in the fraction of obscured sources with the redshift has been found by several studies carried out in the past years[2, 85, 40]. This could be possibly related to the observed increase in the amount of gas in galaxies with increasing redshifts[86], which would straightforwardly lead to larger fractions of obscured sources. Moreover, both simulations and observations have shown that at higher redshifts galaxy mergers are also more common than in the local Universe[87, 88]. Considering the enhanced levels of obscuration observed in mergers, this could also contribute to the increase of with redshift.
4 The intrinsic column density distribution of sources accreting at different Eddington ratios
While Swift/BAT observations are unbiased for , they can still be affected by obscuration for . We infer here the intrinsic distribution of local accreting supermassive black holes. This was done by correcting the observed column density distribution for selection biases[89, 6, 2] to obtain the “ function”, i.e. the intrinsic probability distribution function of . For our Swift/BAT sample this was previously calculated in Ref. 3, where we also obtained the intrinsic distribution by dividing the sample into two luminosity bins. Here we follow the same approach, separating sources into two Eddington ratio bins: and . This was done using the Eddington ratio obtained from the intrinsic 14–150 keV Swift/BAT luminosities, using a bolometric correction of 8.47 (i.e. equivalent to for ). The intrinsic fractions of sources in different intervals are listed in Extended Data Table 1. The results show a very significant decrease in the fraction of Compton-thin obscured AGN for increasing Eddington ratio, with at and at . Normalizing the function over the range , we find a fraction of Compton-thick AGN of for , and for .
| (1) | (2) | (3) | ||
|---|---|---|---|---|
| to 1.5 | to 0 | |||
| [%] | [%] | |||
| 20–21 | ||||
| 21–22 | ||||
| 22–23 | ||||
| 23–24 | ||||
| 24–25 |
The datasets generated during and/or analysed during the current study are available from the corresponding author on reasonable request.
References for the Methods
References
- [1] Krimm, H. A. et al. The Swift/BAT Hard X-Ray Transient Monitor. ApJS 209, 14 (2013).
- [2] Baumgartner, W. H. et al. The 70 Month Swift-BAT All-sky Hard X-Ray Survey. ApJS 207, 19 (2013).
- [3] Massaro, E. et al. The 5th edition of the Roma-BZCAT. A short presentation. Ap&SS 357, 75 (2015).
- [4] Koss, M. J. et al. A New Population of Compton-thick AGNs Identified Using the Spectral Curvature above 10 keV. ApJ 825, 85 (2016).
- [5] Akylas, A. et al. Compton-thick AGN in the 70-month Swift-BAT All-Sky Hard X-ray Survey: A Bayesian approach. A&A 594, A73 (2016).
- [6] Lamperti, I. et al. BAT AGN Spectroscopic Survey - IV: Near-Infrared Coronal Lines, Hidden Broad Lines, and Correlation with Hard X-ray Emission. MNRAS (2017). 1701.02755.
- [7] Berney, S. et al. BAT AGN spectroscopic survey-II. X-ray emission and high-ionization optical emission lines. MNRAS 454, 3622–3634 (2015).
- [8] Ueda, Y. et al. [O iii] 5007 and X-Ray Properties of a Complete Sample of Hard X-Ray Selected AGNs in the Local Universe. ApJ 815, 1 (2015).
- [9] Oh, K. et al. BAT AGN Spectroscopic Survey - III. An observed link between AGN Eddington ratio and narrow-emission-line ratios. MNRAS 464, 1466–1473 (2017).
- [10] Trakhtenbrot, B. et al. The Swift/BAT AGN Spectroscopic Survey (BASS) – VI. The Gamma_X - L/L_Edd relation. MNRAS 470, 800–814 (2017).
- [11] Magdziarz, P. & Zdziarski, A. A. Angle-dependent Compton reflection of X-rays and gamma-rays. MNRAS 273, 837–848 (1995).
- [12] Nandra, K. & Pounds, K. A. GINGA Observations of the X-Ray Spectra of Seyfert Galaxies. MNRAS 268, 405 (1994).
- [13] Shu, X. W., Yaqoob, T. & Wang, J. X. The Cores of the Fe K Lines in Active Galactic Nuclei: An Extended Chandra High Energy Grating Sample. ApJS 187, 581–606 (2010).
- [14] Ricci, C. et al. The narrow Fe K line and the molecular torus in active galactic nuclei: an IR/X-ray view. A&A 567, A142 (2014).
- [15] Ueda, Y. et al. Suzaku Observations of Active Galactic Nuclei Detected in the Swift BAT Survey: Discovery of a “New Type” of Buried Supermassive Black Holes. ApJ 664, L79–L82 (2007).
- [16] Kawamuro, T., Ueda, Y., Tazaki, F., Ricci, C. & Terashima, Y. Suzaku Observations of Moderately Obscured (Compton-thin) Active Galactic Nuclei Selected by Swift/BAT Hard X-ray Survey. ApJS 225, 14 (2016).
- [17] Brightman, M. & Nandra, K. An XMM-Newton spectral survey of 12 m selected galaxies - I. X-ray data. MNRAS 413, 1206–1235 (2011).
- [18] Bentz, M. C. & Katz, S. The AGN Black Hole Mass Database. PASP 127, 67 (2015).
- [19] Trakhtenbrot, B. & Netzer, H. Black hole growth to z = 2 - I. Improved virial methods for measuring MBH and L/LEdd. MNRAS 427, 3081–3102 (2012).
- [20] Oh, K. et al. A New Catalog of Type 1 AGNs and its Implications on the AGN Unified Model. ApJS 219, 1 (2015).
- [21] Greene, J. E. & Ho, L. C. Estimating Black Hole Masses in Active Galaxies Using the H Emission Line. ApJ 630, 122–129 (2005).
- [22] Shen, Y. The mass of quasars. Bulletin of the Astronomical Society of India 41, 61–115 (2013).
- [23] Peterson, B. M. Measuring the Masses of Supermassive Black Holes. Space Sci. Rev. 183, 253–275 (2014).
- [24] Gebhardt, K. et al. A Relationship between Nuclear Black Hole Mass and Galaxy Velocity Dispersion. ApJ 539, L13–L16 (2000).
- [25] Vasudevan, R. V. & Fabian, A. C. Simultaneous X-ray/optical/UV snapshots of active galactic nuclei from XMM-Newton: spectral energy distributions for the reverberation mapped sample. MNRAS 392, 1124–1140 (2009).
- [26] Hönig, S. F. & Beckert, T. Active galactic nuclei dust tori at low and high luminosities. MNRAS 380, 1172–1176 (2007).
- [27] Ferland, G. J. Hazy, A Brief Introduction to Cloudy 84 (1993).
- [28] Liu, Y. & Zhang, S. N. Dusty Torus Formation by Anisotropic Radiative Pressure Feedback of Active Galactic Nuclei. ApJ 728, L44 (2011).
- [29] Raimundo, S. I. et al. Radiation pressure, absorption and AGN feedback in the Chandra Deep Fields. MNRAS 408, 1714–1720 (2010).
- [30] Vasudevan, R. V. et al. Three active galactic nuclei close to the effective Eddington limit for dusty gas. MNRAS 431, 3127–3138 (2013).
- [31] Lawrence, A. & Elvis, M. Obscuration and the various kinds of Seyfert galaxies. ApJ 256, 410–426 (1982).
- [32] Simpson, C. The luminosity dependence of the type 1 active galactic nucleus fraction. MNRAS 360, 565–572 (2005).
- [33] La Franca, F. et al. The HELLAS2XMM Survey. VII. The Hard X-Ray Luminosity Function of AGNs up to z = 4: More Absorbed AGNs at Low Luminosities and High Redshifts. ApJ 635, 864–879 (2005).
- [34] Sazonov, S., Revnivtsev, M., Krivonos, R., Churazov, E. & Sunyaev, R. Hard X-ray luminosity function and absorption distribution of nearby AGN: INTEGRAL all-sky survey. A&A 462, 57–66 (2007).
- [35] Hasinger, G. Absorption properties and evolution of active galactic nuclei. A&A 490, 905–922 (2008).
- [36] Della Ceca, R. et al. The cosmological properties of AGN in the XMM-Newton Hard Bright Survey. A&A 487, 119–130 (2008).
- [37] Beckmann, V. et al. The second INTEGRAL AGN catalogue. A&A 505, 417–439 (2009).
- [38] Ueda, Y. et al. Revisit of Local X-Ray Luminosity Function of Active Galactic Nuclei with the MAXI Extragalactic Survey. PASJ 63, 937 (2011).
- [39] Brightman, M. & Nandra, K. An XMM-Newton spectral survey of 12 m selected galaxies - II. Implications for AGN selection and unification. MNRAS 414, 3084–3104 (2011).
- [40] Buchner, J. et al. Obscuration-dependent Evolution of Active Galactic Nuclei. ApJ 802, 89 (2015).
- [41] Aird, J. et al. The evolution of the X-ray luminosity functions of unabsorbed and absorbed AGNs out to z 5. MNRAS 451, 1892–1927 (2015).
- [42] Georgakakis, A. et al. X-ray constraints on the fraction of obscured AGN at high accretion luminosities. ArXiv e-prints (2017). 1704.08296.
- [43] Ricci, C. et al. Luminosity-dependent unification of active galactic nuclei and the X-ray Baldwin effect. A&A 553, A29 (2013).
- [44] Iwasawa, K. & Taniguchi, Y. The X-ray Baldwin effect. ApJ 413, L15–L18 (1993).
- [45] Bianchi, S., Guainazzi, M., Matt, G. & Fonseca Bonilla, N. On the Iwasawa-Taniguchi effect of radio-quiet AGN. A&A 467, L19–L22 (2007).
- [46] Ricci, C. et al. Iron K emission in type-I and type-II active galactic nuclei. MNRAS 441, 3622–3633 (2014).
- [47] Tueller, J. et al. Swift BAT Survey of AGNs. ApJ 681, 113–127 (2008).
- [48] Gandhi, P. et al. Resolving the mid-infrared cores of local Seyferts. A&A 502, 457–472 (2009).
- [49] Assef, R. J. et al. Mid-infrared Selection of Active Galactic Nuclei with the Wide-field Infrared Survey Explorer. II. Properties of WISE-selected Active Galactic Nuclei in the NDWFS Boötes Field. ApJ 772, 26 (2013).
- [50] Lusso, E. et al. The Obscured Fraction of Active Galactic Nuclei in the XMM-COSMOS Survey: A Spectral Energy Distribution Perspective. ApJ 777, 86 (2013).
- [51] Toba, Y. et al. Luminosity and Redshift Dependence of the Covering Factor of Active Galactic Nuclei viewed with WISE and Sloan Digital Sky Survey. ApJ 788, 45 (2014).
- [52] Lacy, M. et al. The Spitzer Mid-infrared AGN Survey. II. The Demographics and Cosmic Evolution of the AGN Population. ApJ 802, 102 (2015).
- [53] Stalevski, M. et al. The dust covering factor in active galactic nuclei. MNRAS 458, 2288–2302 (2016).
- [54] Mateos, S. et al. X-Ray Absorption, Nuclear Infrared Emission, and Dust Covering Factors of AGNs: Testing Unification Schemes. ApJ 819, 166 (2016).
- [55] Ichikawa, K. et al. The Complete Infrared View of Active Galactic Nuclei from the 70 Month Swift/BAT Catalog. ApJ 835, 74 (2017).
- [56] Netzer, H. et al. Star Formation Black Hole Growth and Dusty Tori in the Most Luminous AGNs at z=2-3.5. ApJ 819, 123 (2016).
- [57] Hönig, S. F., Beckert, T., Ohnaka, K. & Weigelt, G. Radiative transfer modeling of three-dimensional clumpy AGN tori and its application to NGC 1068. A&A 452, 459–471 (2006).
- [58] Nenkova, M., Sirocky, M. M., Nikutta, R., Ivezić, Ž. & Elitzur, M. AGN Dusty Tori. II. Observational Implications of Clumpiness. ApJ 685, 160–180 (2008).
- [59] Nenkova, M., Sirocky, M. M., Ivezić, Ž. & Elitzur, M. AGN Dusty Tori. I. Handling of Clumpy Media. ApJ 685, 147–159 (2008).
- [60] Schartmann, M. et al. Three-dimensional radiative transfer models of clumpy tori in Seyfert galaxies. A&A 482, 67–80 (2008).
- [61] Hönig, S. F. & Kishimoto, M. The dusty heart of nearby active galaxies. II. From clumpy torus models to physical properties of dust around AGN. A&A 523, A27 (2010).
- [62] Hönig, S. F. et al. The dusty heart of nearby active galaxies. I. High-spatial resolution mid-IR spectro-photometry of Seyfert galaxies. A&A 515, A23 (2010).
- [63] Stalevski, M., Fritz, J., Baes, M., Nakos, T. & Popović, L. Č. 3D radiative transfer modelling of the dusty tori around active galactic nuclei as a clumpy two-phase medium. MNRAS 420, 2756–2772 (2012).
- [64] Siebenmorgen, R., Heymann, F. & Efstathiou, A. Self-consistent two-phase AGN torus models. SED library for observers. A&A 583, A120 (2015).
- [65] Mor, R., Netzer, H. & Elitzur, M. Dusty Structure Around Type-I Active Galactic Nuclei: Clumpy Torus Narrow-line Region and Near-nucleus Hot Dust. ApJ 705, 298–313 (2009).
- [66] Alonso-Herrero, A. et al. Torus and Active Galactic Nucleus Properties of Nearby Seyfert Galaxies: Results from Fitting Infrared Spectral Energy Distributions and Spectroscopy. ApJ 736, 82 (2011).
- [67] Ramos Almeida, C. et al. Testing the Unification Model for Active Galactic Nuclei in the Infrared: Are the Obscuring Tori of Type 1 and 2 Seyferts Different? ApJ 731, 92 (2011).
- [68] Elitzur, M. On the Unification of Active Galactic Nuclei. ApJ 747, L33 (2012).
- [69] Suganuma, M. et al. Reverberation Measurements of the Inner Radius of the Dust Torus in Nearby Seyfert 1 Galaxies. ApJ 639, 46–63 (2006).
- [70] Kishimoto, M., Hönig, S. F., Beckert, T. & Weigelt, G. The innermost region of AGN tori: implications from the HST/NICMOS type 1 point sources and near-IR reverberation. A&A 476, 713–721 (2007).
- [71] Kishimoto, M. et al. Mapping the radial structure of AGN tori. A&A 536, A78 (2011).
- [72] Davies, R. I. et al. Insights on the Dusty Torus and Neutral Torus from Optical and X-Ray Obscuration in a Complete Volume Limited Hard X-Ray AGN Sample. ApJ 806, 127 (2015).
- [73] Sazonov, S., Churazov, E. & Krivonos, R. Does the obscured AGN fraction really depend on luminosity? MNRAS 454, 1202–1220 (2015).
- [74] Netzer, H. Revisiting the Unified Model of Active Galactic Nuclei. ARA&A 53, 365–408 (2015).
- [75] Brandt, W. N. & Alexander, D. M. Cosmic X-ray surveys of distant active galaxies. The demographics, physics, and ecology of growing supermassive black holes. A&A Rev. 23, 1 (2015).
- [76] Kawamuro, T., Ueda, Y., Tazaki, F., Terashima, Y. & Mushotzky, R. Study of Swift/Bat Selected Low-luminosity Active Galactic Nuclei Observed with Suzaku. ApJ 831, 37 (2016).
- [77] Winter, L. M., Mushotzky, R. F., Reynolds, C. S. & Tueller, J. X-Ray Spectral Properties of the BAT AGN Sample. ApJ 690, 1322–1349 (2009).
- [78] Lusso, E. et al. Bolometric luminosities and Eddington ratios of X-ray selected active galactic nuclei in the XMM-COSMOS survey. MNRAS 425, 623–640 (2012).
- [79] Buchner, J. & Bauer, F. E. Galaxy gas as obscurer - II. Separating the galaxy-scale and nuclear obscurers of active galactic nuclei. MNRAS 465, 4348–4362 (2017).
- [80] Ezhikode, S. H. et al. Determining the torus covering factors for a sample of type 1 AGN in the local Universe. ArXiv e-prints (2017). 1610.00429.
- [81] Koss, M., Mushotzky, R., Veilleux, S. & Winter, L. Merging and Clustering of the Swift BAT AGN Sample. ApJ 716, L125–L130 (2010).
- [82] Marconi, A. & Hunt, L. K. The Relation between Black Hole Mass, Bulge Mass, and Near-Infrared Luminosity. ApJ 589, L21–L24 (2003).
- [83] Vasudevan, R. V. & Fabian, A. C. Piecing together the X-ray background: bolometric corrections for active galactic nuclei. MNRAS 381, 1235–1251 (2007).
- [84] Peebles, P. J. E. Star Distribution Near a Collapsed Object. ApJ 178, 371–376 (1972).
- [85] Brightman, M. et al. Compton thick active galactic nuclei in Chandra surveys. MNRAS 443, 1999–2017 (2014).
- [86] Tacconi, L. J. et al. High molecular gas fractions in normal massive star-forming galaxies in the young Universe. Nature 463, 781–784 (2010).
- [87] Genel, S., Genzel, R., Bouché, N., Naab, T. & Sternberg, A. The Halo Merger Rate in the Millennium Simulation and Implications for Observed Galaxy Merger Fractions. ApJ 701, 2002–2018 (2009).
- [88] Rodriguez-Gomez, V. et al. The merger rate of galaxies in the Illustris simulation: a comparison with observations and semi-empirical models. MNRAS 449, 49–64 (2015).
- [89] Marshall, H. L., Tananbaum, H., Avni, Y. & Zamorani, G. Analysis of complete quasar samples to obtain parameters of luminosity and evolution functions. ApJ 269, 35–41 (1983).