Nizhnij Arkhyz, Karachay-Cherkessia, 369167, Russia
Cosmic flow around local massive galaxies
Abstract
Aims. We use accurate data on distances and radial velocities of galaxies around the Local Group, as well as around 14 other massive nearby groups, to estimate their radius of the zero-velocity surface, , which separates any group against the global cosmic expansion.
Methods. Our estimate was based on fitting the data to the velocity field expected from the spherical infall model, including effects of the cosmological constant. The reported uncertainties were derived by a Monte Carlo simulation.
Results. Testing various assumptions about a location of the group barycentre, we found the optimal estimates of the radius to be Mpc for the Local Group, and Mpc for a synthetic group stacked from 14 other groups in the Local Volume. Under the standard Planck model parameters, these quantities correspond to the total mass of the group . Thus, we are faced with the paradoxical result that the total mass estimate on the scale of is only % of the virial mass estimate. Anyway, we conclude that wide outskirts of the nearby groups do not contain a large amount of hidden mass outside their virial radius.
Key Words.:
Galaxies: groups: general, galaxies: groups: individual: Local Group1 Introduction
Any overdense region in the Universe is driven by the competition between its self-gravity and the cosmic expansion, and therefore can be characterized by an idealized zero-velocity surface that separates these zones. De Vaucouleurs (1958, 1964, 1972) presupposed systematic deviations from linearity in the velocity-distance relation and interpreted these deviations as a local phenomenon caused by the Virgo complex. The expected effect has only subsequently been supported by observations. Peebles (1976) found the virgocentric infall signal using the field galaxy data available at that time (Sandage & Tammann 1975).
Lynden-Bell (1981) and Sandage (1986) focussed on the Local Group of galaxies. They showed that, in the simplest case of the spherically symmetric system in the empty Universe with , the radius of the zero-velocity surface and the total mass of the group are related as
| (1) |
where is the gravitational constant and is the age of the Universe (Lynden-Bell 1981, Sandage 1986). In the standard cosmological CDM model, where is the mean cosmic density of matter and the Hubble parameter, the relation between and becomes
| (2) |
where the dimensionless parameter
| (3) |
changes in the range from 1 to 2/3 while varying from 0 to 1. Taking the Planck model parameters and = 67.3 km s-1 Mpc-1 (Planck Collaboration 2014), we obtain the relation
| (4) |
which is by 1.50 times more than the classical estimate from equation (1).
This method was sucessfully applied to determine masses of the Local Group (Ekholm et al. 2001, Karachentsev et al. 2002, Teerikorpi et al. 2005, Karachentsev et al. 2009), M81 group (Karachentsev & Kashibadze 2006), CenA group (Karachentsev et al. 2006), as well as the Virgo cluster (Tully & Shaya 1984, Karachentsev & Nasonova 2010, Karachentsev et al. 2014) and the Fornax cluster (Nasonova et al. 2011).
It is important to stress that the method estimates the total mass of a group independently of mass estimates based on virial motions. Notably, the corresponding total mass is confined on the linear scale of , which is three to four times as large as the virial radius of a group or cluster, .
The implementation of the method became possible with wholesale measurements of distances to nearby galaxies from luminosities of the red giant branch stars (TRGB) with accuracy of % attainable by the Hubble Space Telescope. In the Local Volume, limited to 11 Mpc, there are about a thousand known galaxies; most of these galaxies have measured radial velocities with a typical accuracy less than 5 km s-1. About one-third of the Local Volume population already has accurate TRGB distance estimates. The compilation of observational data on these objects is presented in the Updated Nearby Galaxy Catalog (Karachentsev et al. 2013) and its latest electronic version: http://sao.ru/lv/lvgdb/ (Kaisina et al. 2012). For a typical galaxy of the Local Volume with a distance of Mpc, the TRGB distance error of kpc is comparable with a virial radius of the group, thus its location can be confidently fixed relative to the group centroid and zero velocity surface. Other methods of secondary importance are the Tully & Fisher (1977) relation distances or the brightest stars distances with an accuracy of % do not provide an opportunity to determine value even for the nearest groups.
Below we use the most complete data on distances and radial velocities of the Local Volume galaxies to estimate the zero-velocity radius around the local massive galaxies.
2 Galaxy motions around the Milky Way and M31
The recent surveys of large sky areas (Abazajian et al. 2009, Tonry et al. 2012, Koposov et al. 2015) led to the discovery of new Milky Way (MW) dwarf satellites with low luminosities and extremely low surface brightnesses. The recent overview by McConnachie (2012) reports 29 MW satellites with measured radial velocities and accurate distances. In recent years, this list has been expanded up to 45 objects. The corresponding data are presented in Table 1. The Table columns contain (1) galaxy name; (2) equatorial coordinates J2000.0; and (3) tidal index,
| (5) |
distinguishing the most significant galaxy (main disturber = MD) among neighbouring galaxies, whose tidal force dominates the remaining galaxies with masses and spatial separations . The constant, –10.96, is chosen in such a way that corresponds to a significant neighbour located on the zero velocity surface with galaxies ranked as isolated. Finally, Col. (4) lists the main disturber name, Col. (5) distance to a galaxy in Mpc, and Cols. (6, 7) radial velocity of a galaxy (in km s-1) relative to the Sun and relative to the Milky Way centre with apex parameters adopted in NASA Extragalactic Database (NED). References to the used values of distances and velocities of galaxies are presented in the Local Volume Galaxies Database (http://sao.ru/lv/lvgdb/).
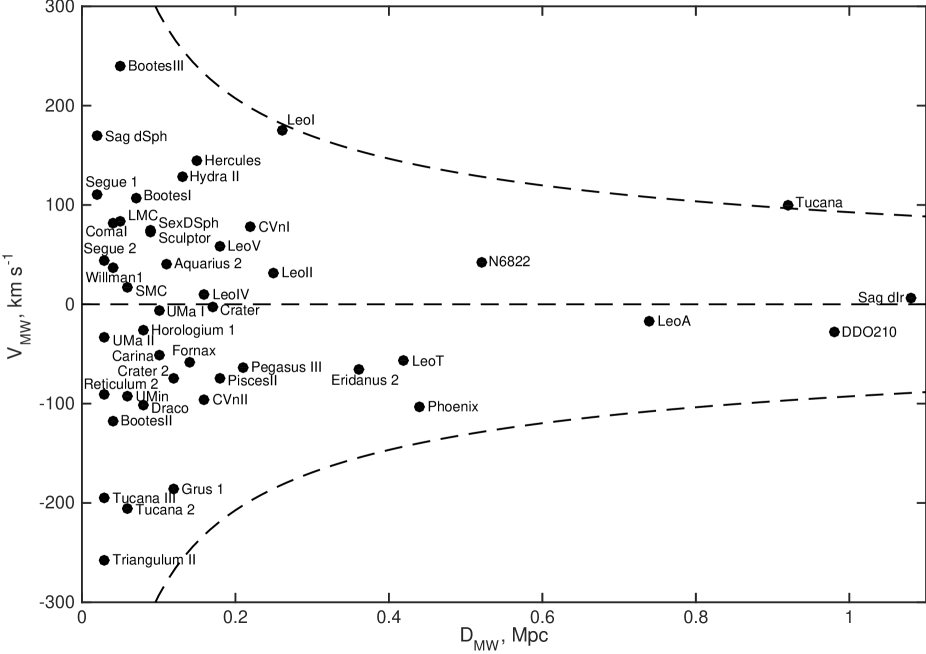
The distribution of 45 satellites of the MW by their Galactocentric distances and radial velocities is shown in Figure 1. The dashed lines correspond to the parabolic velocity for a point mass of . The velocity distribution of satellites looks symmetrical relative to the MW centre, although two satellites with near-parabolic velocities — Tucana and LeoI — are close to the upper escape limit. Three MW satellites, Sag dIr, DDO 210, and Tucana with distances Mpc and negative , belong to field galaxies. However, the MW is dynamically the most significant neighbour for each of these.
Specialized searches for faint satellites in the outskirts of the spiral galaxy M31 in the Andromeda constellation (Ibata et al. 2007, Martin et al. 2009, Ibata et al. 2014) has proved to be notably productive. While the sample by McConnachie (2012) included 23 satellites, now their number is roughly doubled amounting up to 44. The data on these satellites are presented in Table 2, where the first six columns have the same meaning as in Table 1. The seventh column of Table 2 contains spatial distances of satellites (in Mpc) relative to M31, while eighth and ninth list the projected separation of satellites in the sky (in Mpc) and their differential radial velocities relative to M31 (in km s-1). Aside from dwarf galaxies, we tabulate also the data on eight distant globular clusters from PAndAS survey (Huxor et al. 2014) with measured radial velocities. Their spatial distances still remain unknown, and we set them equal to 0.78 Mpc.
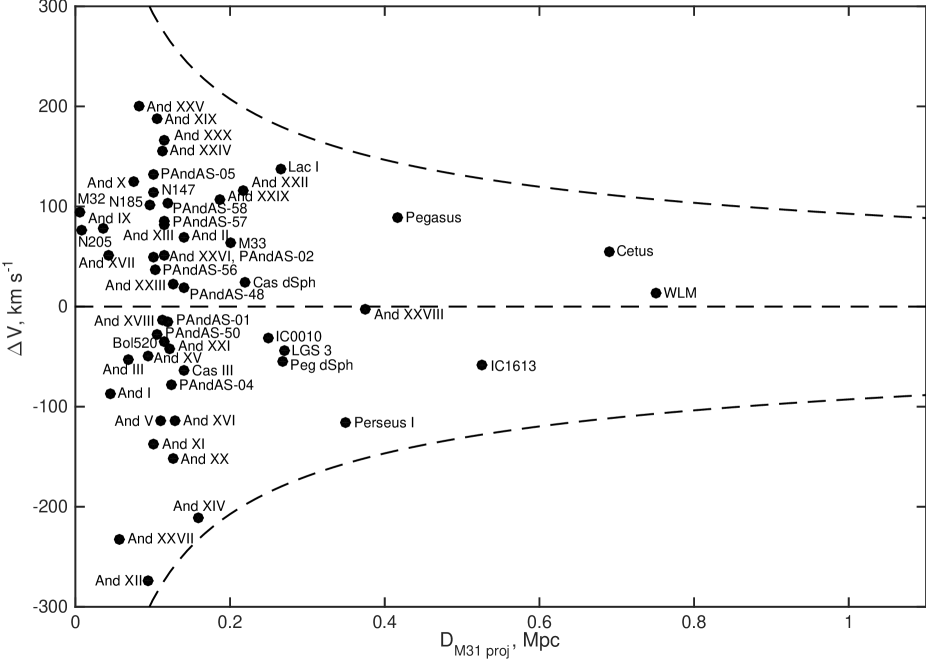
The distribution of test particles by their differential radial velocities and projected separations relative to M31 is presented in Figure 2. The dashed lines also mean the parabolic velocity for a point mass of . Similar to the MW case, the distribution of M31 satellites by their relative velocities seems to be very symmetrical; two satellites — And XIV and And XII — have near-parabolic velocities that are close to the lower escape limit.
3 Orbital masses of the Milky Way and M 31
For a massive galaxy surrounded by small satellites, the orbital mass estimate is expressed as
| (6) |
where is the mean product of squared radial velocity difference of a satellite with its projected distance from the main galaxy and is the orbit eccentricity (Karachentsev & Kudrya 2014). This relation is obtained under the assumption of uniformly random orientation of satellite orbits relative to the line of sight. With the typical eccentricity value of (Barber et al. 2014) the relation (6) becomes
| (7) |
Applying eq. (7) to the assembly of the MW and M31 satellites, we get values for orbital masses (MW) and (M31). Since in the case of Milky Way satellites we observe their 3D distances, then project distances, the orbital mass estimation should be reduced by a factor of yielding (MW). Hence, the ratio of mass estimates for these two galaxies reaches
| (8) |
This value is quite close to the ratio (M31)=0.82 obtained by Karachentsev & Kashibadze (2006) from a minimum value for scatter of peculiar velocities with respect to the Hubble regression line, while varying the centroid position between the MW and M31.
A comparison of the derived total masses of the MW and M31, their combined mass, and the mass ratio with other mass estimates in the recent literature is presented in Table 3. These estimates were based on kinematics of satellites and globular clusters assuming that the MW and M31 haloes follow the standard NFW profile or fit the kinematics of high-velocity stars and blue horizontal branch stars. Our present measurements are in good agreement with the median values given in the last line of Table 3. An essential part of the mismatch between the different estimates in Table 3 may arise from the observed orbital anisotropy of the MW and M31 satellites (Ibata et al. 2013, Pawlowski et al. 2014) and from the uncertain dynamical status of two Milky Way satellites, Leo I and Tucana, and the two M31 satellites, And XIV and And XII. Excluding these objects reduces the mass estimates by 14–15% in both cases.
4 Hubble flow around the Local Group
The proximate velocity field around the Local Group was considered in most detail by Karachentsev & Kashibadze (2006) and Karachentsev et al. (2009). For a sample of 30 galaxies with TRGB distances from 0.7 to 3.0 Mpc with respect to the Local Group centre, it was shown that the Hubble flow is characterized by the local Hubble parameter km s-1 Mpc-1, the radial velocity dispersion km s-1, and the radius of zero-velocity surface Mpc. The minimal value of corresponded to the barycentre position of = 0.43 Mpc, determining the mass ratio of stated above.
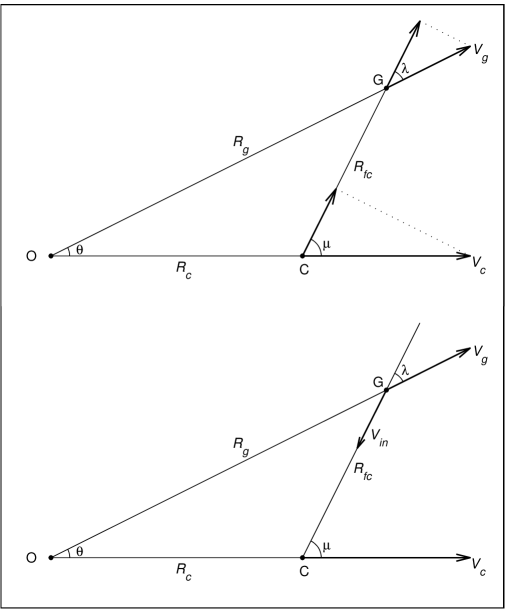
In that approach, we considered the so-called minor attractor model, illustrated by the upper panel of Figure 3. Here, a galaxy group with centre, is separated by a distance, , from the observer, , and moves away along the line of site with the velocity, . In the outskirts of the group there is a galaxy, , with distance, , and radial velocity, . If the angle between and is , then their mutual separation is expressed as
| (9) |
and the projected differential velocity is given by
| (10) |
where , and
| (11) |
In this scheme we assumed peculiar velocities of galaxies in the vicinity of a group to be small compared with velocities of the regular Hubble flow.
Yet, there is another possibility, which is the major attractor case (see lower panel of Figure 3); this case is characterized by predominating infall towards the centre of a group or a cluster. If is the infall velocity than
| (12) |
and the velocity of a galaxy relative to the group centre is expressed as
| (13) |
Evidently the difference between these two models would be insignificant if the galaxy lays almost strictly behind () or in front () of the group centre.
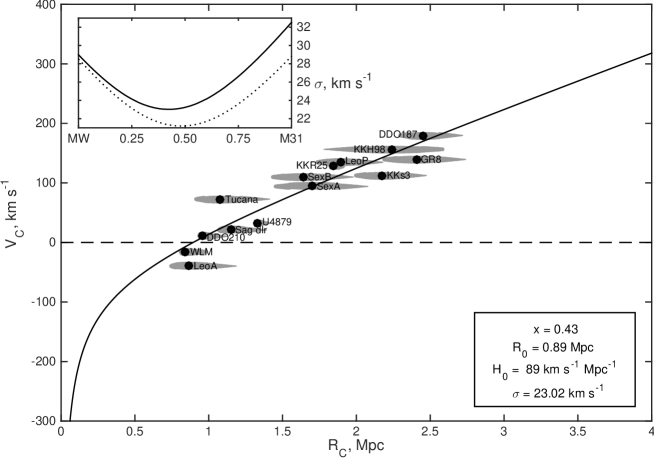
The last few years astronomers have detected some new dwarf galaxies in the vicinity of the Local Group (KKs3, LeoP, and KK258) and measured their accurate TRGB distances and radial velocities. For some galaxies (KKR25 and Tucana), old inexact values of radial velocities were corrected and distances were refined. This circumstance has motivated us to redefine parameters of the local Hubble flow.
To reduce the role of virial motions, we excluded galaxies with from consideration; thus, the MW and M31 satellites with distances Mpc were consequently excluded. The data on the rest field galaxies with Mpc are presented in Table 4. The columns of Table 4 contain (1) galaxy name; (2) distance (in Mpc) from the Milky Way; (3) heliocentric radial velocity( in km s-1); (4) distance from the Local Group barycentre located at Mpc; (5, 6) velocity (in km s-1) relative to the barycentre in the case of minor and major attractor, respectively; (7) tidal index; (8) the main disturber name; and (9) in degrees (see Figure 3).
The distribution of 35 isolated galaxies by distances and velocities relative to the Local Group barycentre for the case of minor attractor is presented in the upper panel of Figure 4. As shown in the Table 4 data, only 14 galaxies of 35 have the MW or M31 as the main disturber; they are denoted by solid circles. With reference to these objects, the zone affected gravitationally by the Local Group reaches Mpc, while more distant field galaxies are influenced by other massive neighbours of the Local Group, such as M81, NGC 253, and NGC 5128.
According to Peirani & de Freitas Pacheco (2008), Falco et al. (2014), and Penarrubia & Fattahi (2017), the radial velocity profile around the spherically symmetrical group or cluster can be expressed as
| (14) |
where is the radius of the zero-velocity surface to be found. The solid line in Figure 4 corresponds to equation (14) with parameters defined from the least squares method, Mpc, km s-1 Mpc-1, and km s-1. The errors of and parameters were estimated using the Monte Carlo method, assuming that distance errors for galaxies are distributed normally with a typical value of %. The peculiar velocity dispersion in the upper panel of Figure 4 is contributed mostly by distant galaxies, which are disturbed by the neighbouring groups. Considering the only 14 galaxies in the zone affected gravitationally by the Local Group, we obtain the following parameters for the surrounding Hubble flow: Mpc, km s-1 Mpc-1, and km s-1. In the major attractor model, these parameters vary slightly, since values for these 14 galaxies are small (see the last column in Table 4).
Three parameters, i.e. , and , characterizing the local cosmic expansion, moderately depend on the position of the LG barycentre. Above, we used the barycentre location at the distance of = 0.43 Mpc, corresponding to the mass ratio of = 1.2. This ratio matches well with the medians in Table 3. However, Penarrubia et al.(2014) found that the minimal scatter of nearby galaxies within 3 Mpc around the LG is achieved with = 0.75. The authors have concluded that their analysis rules out models in which M31 is more massive than our Galaxy with about 95% confidence. To check this statement, we calculated for 14 nearest isolated galaxies as a function of the position of the LG barycentre on the line connecting the MW with M31. The data on and are presented in Table 5. The lower panel of Figure 4 shows the local Hubble diagram for 14 galaxies at various M31-to-MW mass ratios. Each galaxy is drawn by grey wedge with caliber inversely related to the dispersion at given barycentre position; thus its thinner end indicates the barycentre position at M31. The insert in the figure shows the velocity scatter of galaxies respect to the best-fitting regression line. The solid and dotted lines in the insert represent the behaviour of for a case of included or excluded Leo A, respectively. This dwarf galaxy is a marginally isolated object with the tidal index TI= +0.03. The derived minimums of these two lines fix the M31-to-MW mass ratio near 0.7 and 1.0, respectively, not allowing a firm assessment of which galaxy mass is dominated. Over the range of the value of the zero velocity radius is changing within Mpc. Thus, the observed coldness of the local Hubble flow leads us to measure the radius of the sphere separating the Local Group from the global cosmic expansion with error. According to (4), the radius Mpc yields the total mass estimate for the Local Group with an unprecedented accuracy, although this quantity lies below all values of M(MW+M31) in Table 3. The mismatch becomes slightly less dramatic when the Planck model parameters in (4) replace the WMAP parameters as follows: and = 73 km s-1 Mpc-1 (Spergel et al. 2007)); this increases the coefficient in (4) from 1.95 to 2.12.
As noted by Chernin et al. (2004), the actual deviation of the binary shape of the Local Group from the spherical symmetry produces a minor bias in the and mass estimate. According to N-body simulations by Penarrubia et al. (2014), neglecting the quadrupole potential overestimates the Local Group mass up to .
5 Other massive galaxies in the Local volume
Considering the Hubble flow around other giant galaxies of the Local Volume, we selected 15 galaxies with stellar masses and accurate distances. Their overview is presented in Table 6 with objects ranging by their distances from the observer. For each of these 15 galaxies, surrounded by a suite of satellites, the second most massive member of its group is also indicated. In some cases, i.e. M31 and the Milky Way, NGC 5128 (CenA) and NGC 5236, Maffei 2, and IC 342, the second galaxy is comparable in mass with the first galaxy and acts itself as the centre of a dynamically separated subgroup.
The columns of Table 6 contains (1) galaxy name; (2, 3) its supergalactic coordinates; (4) the galaxy distance from the MW; (5) its radial velocity relative to the Local Group centroid; (6) logarithmic stellar mass; (7) logarithmic orbital mass according to Karachentsev & Kudrya (2014); (8) number of satellites of the main galaxy with measured radial velocities and accurate distances.
Aside from the galaxies presented in Table 6, the Local Volume contains another two massive galaxies — NGC 2903 ( and NGC 6946 (. But their distances measured from the luminosity of brightest stars are not yet sufficiently accurate. In total, the 15 giant galaxies have about 500 satellites in their suites, but, as shown in the last column of Table 6, only 102 satellites outside the Local Group have accurate estimates of distances and velocities. Among the second most massive members of 15 groups, three galaxies — NGC 4242, NGC 4597 and NGC 6684 — have Tully-Fisher distances with accuracy of % (denoted with column signs). In 11 of 15 groups, the main galaxy exceeds its satellites twice or more in mass, allowing us to estimate its halo mass from the orbital motions. This approach is not worthwhile in the case of the rich group Leo I, where NGC 3379, NGC 3368, and several other bright members have compatible luminosities.
Despite the great efforts to measure highly accurate TRGB distances of nearby galaxies from Hubble Space Telescope data, many neighbouring groups stay still poorly explored. For example, in the outskirts of giant galaxies NGC 4594 (Sombrero), NGC 5055, and NGC 3115, no satellites have reliable distance estimates.
6 Cosmic flow around the synthetic (stacked) nearby group
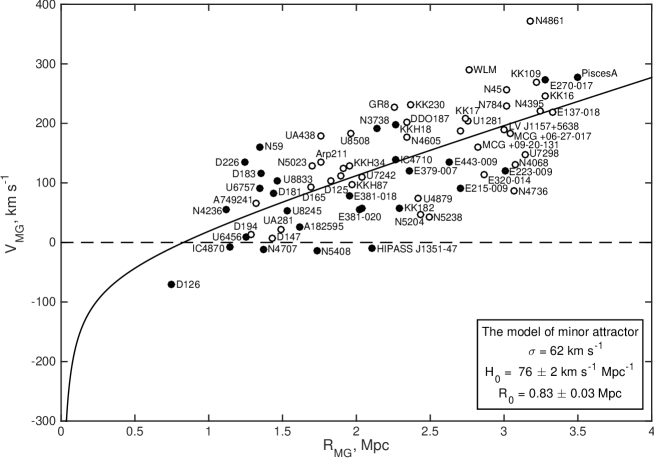
Seeking to use as much information as possible about companion motions around the nearby massive galaxies outside their virial zones, we combined the data on companions of various galaxies into the single synthetic group. To be included into the consolidated group, a galaxy should satisfy the following four conditions: (1) a companion has accurate estimates of distance and radial velocities; (2) the companion distance from the main galaxy, , is less than 3.5 Mpc; 3) the companion belongs to field galaxies, having ; and 4) the companion has a proper aspect, when its position angle between the vector of companion radial velocity and the line joining it with the main galaxy (see Figure 3) lays within or .
These conditions are satisfied for 66 galaxies of the Local Volume; the corresponding data are presented in Table 7. Its columns contain: (1) name of the main galaxy acting as the centre of its suite; (2) name of a companion galaxy; (3) companion galaxy distance from the group barycentre; (4, 5) companion galaxy velocity relative to the group barycentre in the case of minor or major attractor; (6, 7) tidal index of the galaxy and the name of its main disturber; and (8) position angle of the companion as indicated in Figure 3.
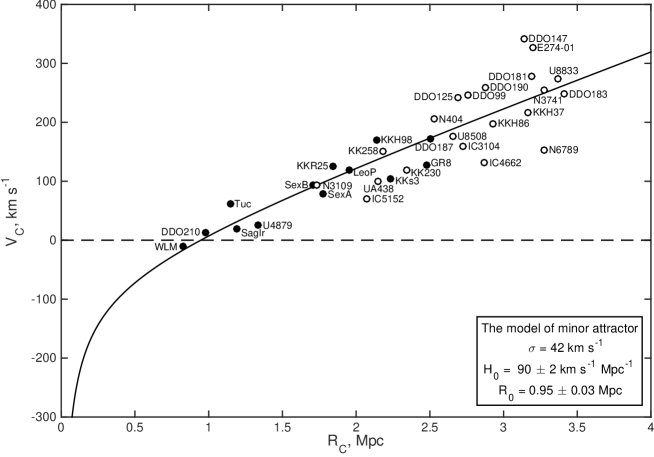
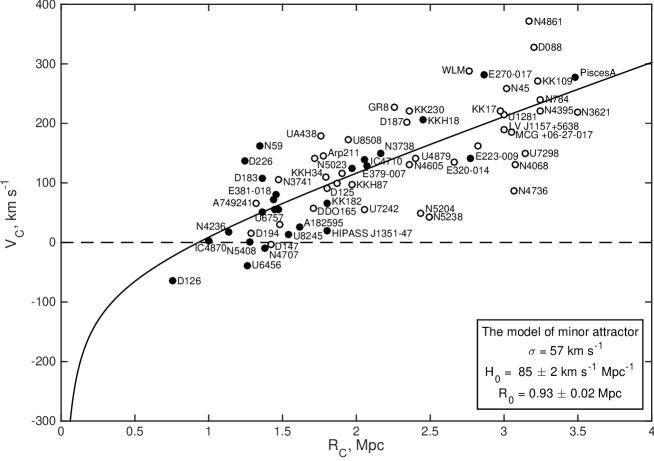
The Hubble diagram for the synthetic group of the Local Volume for the minor attractor model with distances and velocities calculated relative to the main galaxy is shown in the upper panel of Figure 5. The cosmic flow around the synthetic group is characterized by the Hubble parameter km s-1/Mpc, velocity dispersion km s-1, and radius of the zero velocity surface Mpc. As one can see, the radius turned out to be quite small, corresponding to the effective mass of the synthetic group of . To estimate how various factors influence , we constructed another series of Hubble diagrams. An alternative Hubble diagram with distances and velocities calculated relative to the group barycentre rather than from the main galaxy itself is presented in the lower panel of Figure 5. The barycentre is supposed to lie between the two most massive galaxies of each group given in Table 6. In this case the local Hubble parameter is km s-1 Mpc, peculiar velocity dispersion km s-1, and radius reaches Mpc.
As follows from the data on Table 6, the nearby galaxy groups differ substantially in their stellar and virial masses, and , which can lead to a systematic bias in the averaged estimate. To verify this effect, we normalized distances of companions around each group to its individual radius , assuming or . After that we did not find any decrease in peculiar velocity dispersion in the synthetic Hubble diagram.
The resulting values of and parameters for all discussed cases are presented in Table 8; i.e. distances and velocities calculated relative to the main galaxy or group barycentre and the minor or major attractor model. These data allow us to conclude, first, that changing a model from a minor attractor to major attractor increases the estimate and causes a significant increment in dispersion, and, second, that accounting for the second most massive galaxy in a group leads to a notable growth of the estimate.
7 Discussion
As our estimates suggest, galaxies in the infall zone between the virial radius and the are relatively small in number, %. This circumstance, inherent for the Local Group and for other nearby groups, opts for estimating value within minor attractor model. The low value of peculiar velocity dispersion resulting in this case is also an oblique argument for such a choice.
The second most massive galaxy plays an essential role in the kinematics of several nearby groups, often forming a dynamical subsystem. So, deciding on a barycentre of the two most bright galaxies as the reference point for distances and velocities of companions seems to be more preferable than the main galaxy itself. Hence, we adopt the value of Mpc as the optimal estimate for radius of the cumulative group (see the lower panel of Figure 5). The corresponding mass is with a formal error of dex. Averaging orbital mass estimates from Table 6 and considering the representation of each group in the Hubble diagram, we obtain the mean logarithmic mass . So, the mass of the synthetic group derived from outer motions of surrounding galaxies turned out to be 60% of the expected mass from inner orbital motions of satellites. A probable source of this discrepancy was discussed by Chernin et al. (2013) and Karachentsev & Kudrya (2014).
As noted by Chernin et al. (2013), the estimate of the total mass of a group includes two components, , where is the mass of dark and baryonic matter and is the mass, negative in magnitude, which is determined by the dark energy with the density of ,
| (15) |
On the scale of virial radius, the contribution of this component in the group mass does not exceed 1%, but in the sphere of radius, the role of this kind of a mass defect becomes significant. In the standard CDM model with and km s-1 Mpc-1 the contribution of dark energy is
| (16) |
i.e. about 30% of the Local Group mass determined by orbital motions. This correction essentially reduces the observed discrepancy between the mass estimates for the Local Group, as well as for other nearby groups, derived via internal (virial) and external galaxy motions.
Another possible explanation might be caused by the existence of unrelaxed (tidal) thin planar structures of satellites seen around the Milky Way and M 31 (Kroupa 2014), which are at variance with the assumption of spherical symmetry case.
The peculiar velocity dispersion in the vicinity of the synthetic group, 57 km s-1, is twice as large as in the outskirts of the Local Group. This difference might originate from bulk motions of galaxies, which become perceptible on the scale of Mpc. A giant galaxy is not necessarily the main disturber for neighbouring field galaxies. Indeed, this is the case for only a portion of companion objects presented in Table 7. Another portion, which are comprised of mostly distant field galaxies (shown by open circles), are gravitationally influenced by a massive galaxy from another neighbouring group.
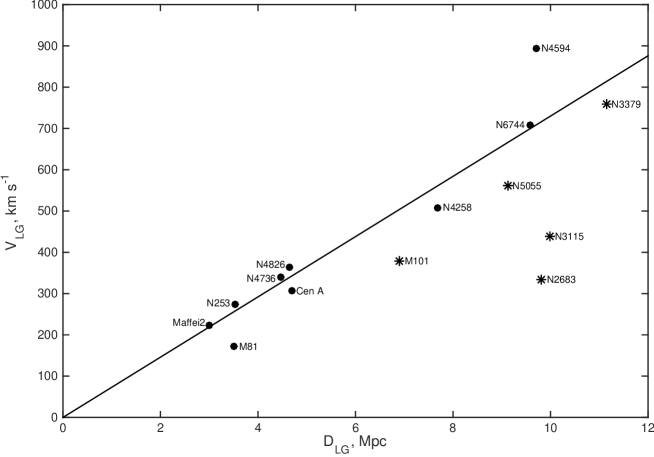
Figure 6 reproduces the distribution of barycentres of 15 nearby groups listed in Table 5 by distances and radial velocities relative to the Local Group centre. The straight line corresponds to the regular Hubble flow with km s-1 Mpc-1. Barycentres of the groups with Mpc situated in the supergalactic plane (i.e. in the Local Sheet; Tully et al. 2016) demonstrate a small scatter of radial velocities. More distant groups, around M 101, NGC 5055, NGC 2683, NGC 3115, and NGC 3379 at supergalactic latitudes (denoted with asterisks), exhibit negative peculiar velocities about km s-1. These velocities are caused by the observed expansion of the Local Void with an amplitude of km s-1(Tully et al. 2016). Also, the group around Sombrero (NGC 4594) is located just near the zero-velocity surface of the Virgo cluster. Its positive peculiar velocity reflects the group fall towards the cluster. Apparently, some portion of these bulk motions manifest themselves as extra peculiar velocities of the Local Volume galaxies in the panels of Figure 5. Ignoring these non-virial coherent motions may lead to the overestimation of galaxy masses based on the Numerical Action Method (Peebles, 2017).
Our conclusion that the peripheral regions of the Local Group and other neighbouring groups do not contain a large amount of dark matter seems to be the most important result of this work. The bulk of mass is concentrated within the virial radius of these groups. The same inference was made for the nearest Virgo cluster (Karachentsev et al. 2014) from the observed infall of galaxies towards the cluster centre. Yet further evidence is provided by Kourkchi & Tully (2017), who have considered infall zones and collapsed cores of halos in the Local Universe.
A review of available observational data on distances and radial velocities of the Local Volume galaxies shows that the population of outskirts of the nearby groups has not yet been covered with highly accurate distance measurements. There are groups, for example around the giant Sombrero galaxy, totally lack reliable distance estimates, even for close probable satellites. The systematical measurements of TRGB distances with the Hubble Space Telescope within the Local Volume have the potential to provide meaningful data on the distribution of the dark matter on the scales of Mpc.
Acknowledgements.
The authors are grateful to Elena Kaisina for updating the Local Volume Galaxies Database (https://www.sao.ru/lv/lvgdb/), Dmitry Makarov for the renewed data on galaxy tidal indices, and Brent Tully for reviewing the manuscript and for his helpful comments. This work is supported by the Russian Science Foundation grant No. 14–12–00965.References
- (1) Abazajian K.N., Adelman-McCarthy J.K., Agüeros M.A., et al. 2009, ApJS, 182, 543
- (2) Barber C., Starkenburg E., Navarro J.F.,et al. 2014, MNRAS, 437, 959
- (3) Bhattacharjee P., Chaudhury S., Kundu S., 2014, ApJ, 785, 63
- (4) Chernin A.D., Bisnovatyi-Kogan G.S., Teerikorpi P., et al. 2013, A&A, 553, 101
- (5) Chernin A.D., Karachentsev I.D., Valtonen M.J., et al. 2004, A&A, 415, 19
- (6) Deason A.J., Belokurov V., Evans N.W., et al. 2012, MNRAS, 425, 2840
- (7) de Vaucouleurs G., 1958, AJ, 63, 253
- (8) de Vaucouleurs G., 1964, AJ, 69, 737
- (9) de Vaucouleurs G., 1972, in IAU Symposium 44, External Galaxies and Quasi-Stellar Objects, ed. D. S. Evans, D. Wills, and B. J. Wills (Dordrecht: Reidel), p. 353
- (10) Diaz J.D., Koposov S.E., Irwin M., et al. 2014, MNRAS, 443, 1688
- (11) Ekholm, T., Baryshev, Y., Teerikorpi, P. et al., 2001, A & A, 368, L17
- (12) Falco M., Hansen S.H., Wojtak R. et al. 2014, MNRAS, 442, 1887
- (13) Fragione, G., & Loeb, A. 2017, New A, 55, 32
- (14) Huxor A.P., Mackey A.D., Ferguson A.M.N, et al. 2014, MNRAS, 442, 2165
- (15) Ibata R. A., Lewis G. F., McConnachie A. W., et al., 2014, ApJ, 780, 128
- (16) Ibata, R.A., Lewis, G.F., Conn, A.R. et al. 2013, Nature, 493, 62
- (17) Ibata R., Martin N. F., Irwin M., et al., 2007, ApJ, 671, 1591
- (18) Kaisina E.I., Makarov D.I., Karachentsev I.D., 2012, AstBull, 67, 115
- (19) Karachentsev I.D., Tully R.B., Wu Po-Feng, Shaya E.J., Dolphin A.E., 2014, ApJ, 782, 4
- (20) Karachentsev I.D., Kudrya Y.N., 2014, AJ, 148, 50
- (21) Karachentsev I.D., Makarov, D.I., & Kaisina, E.I., 2013, AJ, 145, 101 (=UNGC)
- (22) Karachentsev I.D., Nasonova (Kashibadze) O.G., 2010, MNRAS, 405, 1075
- (23) Karachentsev I.D., Kashibadze O.G., Makarov D.I., Tully R.B., 2009, MNRAS, 393, 1265
- (24) Karachentsev I.D., Kashibadze O.G., 2006, Ap, 49,3
- (25) Karachentsev I.D., Dolphin A.E., Tully R.B., et al, 2006, AJ, 131, 1361
- (26) Karachentsev I.D., Sharina M.E., Makarov D.I., et al, 2002, A&A, 389, 812
- (27) Koposov S.E., Belokurov V., Torrealba G., Wyn E.N., 2015, ApJ, 805, 130
- (28) Kourkchi E., Tully R.B., 2017, ApJ, 843, 16
- (29) Kroupa P., 2014, ArXiv1409.6302
- (30) Lynden-Bell D., 1981, Observatory, 101, 111
- (31) Martin N. F., McConnachie A. W., Irwin M., et al., 2009, ApJ, 705, 758
- (32) McConnachie A. W., 2012, AJ, 144, 4
- (33) McMillan P.J., 2017, MNRAS, 465, 76
- (34) Nasonova O.G., de Freitas Pacheco J.A., Karachentsev I.D., 2011, A&A, 532A, 104
- (35) Patel E., Besla G., & Mandel K., 2017, MNRAS, 468, 3428
- (36) Pawlowski, M.S., Famaey, B., Jerjen, H. et al. 2014, MNRAS, 442, 2362
- (37) Peebles P. J. E., 2017, arXiv:1705.10683
- (38) Peebles P. J. E., 1976, ApJ, 205, 318
- (39) Peirani, S., & de Freitas Pacheco,J.A. 2008, A&A, 488, 845
- (40) Penarrubia J, Fattahi A., 2017, MNRAS, 468, 1300
- (41) Penarrubia J, Gomez, F.A., Besla G., et al. 2016, MNRAS, 456, L54
- (42) Penarrubia J, Ma Y.Z., Walker M.G., McConnachie A. W., 2014, MNRAS, 443, 2204
- (43) Planck Collaboration, Ade P.A.R., Aghanim N., et al., 2014, A & A, 571, A16
- (44) Sandage A., 1986, ApJ, 307, 1
- (45) Sandage A., Tammann G. A., 1975, ApJ, 196, 313
- (46) Shull J.M., 2014, ApJ, 784, 142
- (47) Sofue Y., 2015, PASJ, 67, 75
- (48) Spergel D.N., 2007, ApJS, 170, 377
- (49) Teerikorpi, P., Chernin, A.D., & Baryshev, Y.V., 2005, A&A, 440, 791
- (50) Tonry J. L., Stubbs C. W., Lykke K. R., et al., 2012, ApJ, 750, 99
- (51) Tully R.B., Courtois H.M., Sorce J.G., 2016, AJ, 152, 50
- (52) Tully R.B., Shaya E.J., 1984, ApJ, 281, 31
- (53) Tully R.B., Fisher J.R., 1977, A&A, 54, 661
- (54) van der Marel R.P., Fardal M., Besla G. et al. 2012, ApJ, 753, 8
- (55) Veljanoski J., Ferguson A.M.N., Mackey A.D., et al. 2013, ApJ, 768L, 33
| Name | RA (2000.0) Dec | MD | ||||
| hh mm ss dd mm ss | Mpc | km/s | km/s | |||
| (1) | (2) | (3) | (4) | (5) | (6) | (7) |
| SMC | 005238.0 724801 | 3.32 | LMC | 0.06 | 158 | 17 |
| Sculptor | 010009.4 334233 | 2.79 | MWay | 0.09 | 105 | 72 |
| Phoenix | 015106.3 442641 | 0.73 | MWay | 0.44 | 13 | 103 |
| Triangulum II | 021317.4 361042 | 3.97 | MWay | 0.03 | 382 | 257 |
| Segue 2 | 021916.0 201031 | 3.83 | MWay | 0.03 | 39 | 44 |
| Fornax | 023954.7 343133 | 2.19 | MWay | 0.14 | 29 | 59 |
| Horologium 1 | 025531.7 540708 | 2.94 | MWay | 0.08 | 113 | 26 |
| Reticulum 2 | 033542.1 540257 | 4.15 | MWay | 0.03 | 64 | 91 |
| Eridanus 2 | 034421.1 433159 | 1.00 | MWay | 0.36 | 76 | 66 |
| LMC | 052334.6 694522 | 3.56 | MWay | 0.05 | 278 | 84 |
| Carina | 064136.7 505758 | 2.63 | MWay | 0.10 | 224 | 52 |
| UMa II | 085130.0 630748 | 3.92 | MWay | 0.03 | 116 | 33 |
| Leo T | 093453.4 170305 | 0.77 | MWay | 0.42 | 39 | 57 |
| Leo A | 095926.4 304447 | 0.03 | MWay | 0.74 | 24 | 17 |
| Segue 1 | 100703.2 160425 | 4.32 | MWay | 0.02 | 206 | 111 |
| Leo I | 100826.9 121829 | 1.37 | MWay | 0.26 | 283 | 175 |
| Sex dSph | 101303.0 013652 | 2.74 | MWay | 0.09 | 227 | 75 |
| UMa I | 103452.8 515512 | 2.59 | MWay | 0.10 | 55 | 7 |
| Willman 1 | 104921.0 510300 | 3.76 | MWay | 0.04 | 12 | 36 |
| Leo II | 111329.2 220917 | 1.45 | MWay | 0.25 | 86 | 32 |
| Leo V | 113109.6 021312 | 1.89 | MWay | 0.18 | 173 | 59 |
| Leo IV | 113257.0 003200 | 2.05 | MWay | 0.16 | 132 | 10 |
| Crater | 113615.8 105240 | 1.96 | MWay | 0.17 | 148 | 2 |
| Crater 2 | 114914.4 182447 | 2.50 | MWay | 0.12 | 88 | 74 |
| Hydra II | 122142.1 315907 | 2.29 | MWay | 0.13 | 303 | 129 |
| Coma I | 122659.0 235415 | 3.74 | MWay | 0.04 | 98 | 82 |
| CVn II | 125710.0 341915 | 2.04 | MWay | 0.16 | 129 | 96 |
| CVn I | 132803.5 333321 | 1.60 | MWay | 0.22 | 31 | 78 |
| Bootes III | 135707.4 264630 | 3.67 | MWay | 0.05 | 198 | 240 |
| Bootes II | 135800.0 125100 | 3.86 | MWay | 0.04 | 117 | 117 |
| Bootes I | 140000.0 143000 | 3.25 | MWay | 0.07 | 99 | 106 |
| UMin | 150911.3 671252 | 3.27 | MWay | 0.06 | 255 | 93 |
| Hercules | 163102.0 124730 | 2.19 | MWay | 0.15 | 45 | 145 |
| Draco | 172001.4 575434 | 2.94 | MWay | 0.08 | 296 | 101 |
| Sag dSph | 185503.1 302842 | 5.36 | MWay | 0.02 | 140 | 169 |
| Sag dIr | 192959.0 174041 | 0.44 | MWay | 1.08 | 79 | 7 |
| NGC 6822 | 194457.7 144811 | 0.52 | MWay | 0.52 | 57 | 43 |
| DDO 210 | 204651.8 125053 | 0.31 | MWay | 0.98 | 140 | 28 |
| Pegasus III | 222424.2 052436 | 1.73 | MWay | 0.21 | 223 | 63 |
| Aquarius 2 | 223355.5 091939 | 2.56 | MWay | 0.11 | 71 | 41 |
| Tucana | 224149.0 642512 | 0.24 | MWay | 0.92 | 194 | 99 |
| Tucana 2 | 225155.1 583408 | 3.46 | MWay | 0.06 | 129 | 205 |
| Grus 1 | 225642.4 500948 | 2.45 | MWay | 0.12 | 140 | 186 |
| Pisces II | 225831.0 055709 | 1.88 | MWay | 0.18 | 226 | 75 |
| Tucana III | 235636.0 593600 | 3.90 | MWay | 0.03 | 102 | 195 |
| Name | RA (2000.0) Dec | MD | ||||||
| hh mm ss dd mm ss | Mpc | km/s | Mpc | Mpc | km/s | |||
| (1) | (2) | (3) | (4) | (5) | (6) | (7) | (8) | (9) |
| WLM | 000158.1 152740 | 0.01 | M 31 | 0.98 | 122 | 0.88 | 0.75 | 14 |
| And XVIII | 000214.5 450520 | 0.72 | M 31 | 1.31 | 332 | 0.51 | 0.11 | 14 |
| And XIX | 001932.1 350237 | 2.21 | M 31 | 0.93 | 111 | 0.16 | 0.10 | 187 |
| IC 10 | 002024.5 591730 | 1.58 | M 31 | 0.79 | 346 | 0.26 | 0.25 | 32 |
| And XXVI | 002345.6 475458 | 2.58 | M 31 | 0.76 | 261 | 0.12 | 0.10 | 50 |
| Cetus | 002611.0 110240 | 0.27 | M 31 | 0.79 | 87 | 0.71 | 0.69 | 55 |
| And XXV | 003008.9 465107 | 3.01 | M 31 | 0.81 | 108 | 0.09 | 0.08 | 200 |
| NGC 147 | 003311.6 483028 | 2.55 | M 31 | 0.76 | 193 | 0.12 | 0.10 | 115 |
| And III | 003533.8 362952 | 2.80 | M 31 | 0.75 | 346 | 0.10 | 0.07 | 54 |
| Cas III | 003559.4 513335 | 2.28 | M 31 | 0.78 | 372 | 0.15 | 0.14 | 64 |
| And XXX | 003634.9 493848 | 2.28 | NGC 185 | 0.68 | 141 | 0.18 | 0.11 | 166 |
| And XVII | 003707.0 441920 | 2.95 | M 31 | 0.74 | 251 | 0.09 | 0.04 | 51 |
| And XXVII | 003727.1 452313 | 3.47 | M 31 | 0.83 | 535 | 0.06 | 0.06 | 232 |
| NGC 185 | 003858.0 482010 | 2.03 | M 31 | 0.66 | 203 | 0.18 | 0.10 | 102 |
| NGC 205 | 004022.5 414111 | 4.68 | M 31 | 0.80 | 221 | 0.02 | 0.01 | 77 |
| M 32 | 004242.1 405159 | 4.38 | M 31 | 0.79 | 202 | 0.03 | 0.01 | 93 |
| M 31 | 004244.5 411609 | 2.79 | NGC 205 | 0.78 | 296 | 0.00 | 0.00 | 0 |
| And I | 004540.0 380214 | 2.77 | M 31 | 0.73 | 376 | 0.10 | 0.04 | 86 |
| And XI | 004620.0 334805 | 2.43 | M 31 | 0.73 | 419 | 0.14 | 0.10 | 137 |
| And XII | 004727.0 342229 | 2.82 | M 31 | 0.83 | 556 | 0.10 | 0.09 | 274 |
| Bol 520 | 005042.4 325459 | 1.79 | M 31 | 0.63 | 312 | 0.22 | 0.12 | 34 |
| And XIV | 005135.0 294149 | 2.04 | M 31 | 0.73 | 481 | 0.18 | 0.16 | 211 |
| And XIII | 005151.0 330016 | 2.55 | M 31 | 0.84 | 195 | 0.12 | 0.12 | 82 |
| And IX | 005252.8 431200 | 3.65 | M 31 | 0.79 | 216 | 0.05 | 0.04 | 77 |
| PAndAS-48 | 005928.2 312910 | 2.31 | M 31 | 0.82 | 250 | 0.15 | 0.14 | 19 |
| And XVI | 005929.8 322236 | 1.32 | M 31 | 0.52 | 385 | 0.32 | 0.13 | 114 |
| LGS 3 | 000355.0 215306 | 1.37 | M 31 | 0.65 | 286 | 0.30 | 0.27 | 44 |
| IC 1613 | 000447.8 020800 | 0.64 | M 31 | 0.76 | 232 | 0.54 | 0.53 | 59 |
| And X | 000633.7 444816 | 1.90 | M 31 | 0.63 | 164 | 0.20 | 0.08 | 124 |
| And V | 001007.1 473741 | 2.64 | M 31 | 0.81 | 403 | 0.11 | 0.11 | 113 |
| And XV | 001418.7 380703 | 2.64 | M 31 | 0.76 | 323 | 0.11 | 0.09 | 49 |
| And II | 001629.8 332509 | 1.82 | M 31 | 0.65 | 194 | 0.21 | 0.14 | 69 |
| And XXIV | 001830.0 462158 | 1.65 | M 31 | 0.60 | 128 | 0.24 | 0.11 | 156 |
| And XXII | 002740.0 280525 | 1.75 | M 31 | 0.79 | 127 | 0.23 | 0.22 | 116 |
| And XXIII | 002921.8 384308 | 2.24 | M 31 | 0.73 | 243 | 0.15 | 0.13 | 23 |
| M 33 | 003350.8 303937 | 1.63 | M 31 | 0.93 | 182 | 0.25 | 0.20 | 63 |
| Perseus I | 030123.6 405918 | 1.14 | M 31 | 0.79 | 326 | 0.36 | 0.35 | 116 |
| And XXVIII | 223241.2 311258 | 1.04 | M 31 | 0.65 | 331 | 0.39 | 0.38 | 3 |
| Lac I | 225816.3 411728 | 1.50 | M 31 | 0.76 | 198 | 0.27 | 0.26 | 137 |
| Cas dSph | 232631.8 504032 | 1.73 | M 31 | 0.82 | 307 | 0.23 | 0.22 | 24 |
| Pegasus | 232834.1 144448 | 0.73 | M 31 | 0.97 | 184 | 0.50 | 0.42 | 89 |
| Peg dSph | 235146.4 243510 | 1.48 | M 31 | 0.82 | 345 | 0.28 | 0.27 | 55 |
| And XXI | 235447.7 422815 | 2.42 | M 31 | 0.86 | 361 | 0.14 | 0.12 | 43 |
| And XXIX | 235855.6 304520 | 1.87 | M 31 | 0.73 | 194 | 0.21 | 0.19 | 106 |
| PAndAS 04 | 000442.9 472142 | 2.5 | M 31 | 0.78 | 397 | … | 0.12 | 79 |
| PAndAS 05 | 000524.1 435535 | 2.8 | M 31 | 0.78 | 183 | … | 0.10 | 132 |
| PAndAS 50 | 010150.6 481819 | 2.7 | M 31 | 0.78 | 323 | … | 0.11 | 29 |
| PAndAS 56 | 012303.5 415511 | 2.7 | M 31 | 0.78 | 239 | … | 0.10 | 36 |
| PAndAS 57 | 012747.5 404047 | 2.6 | M 31 | 0.78 | 186 | … | 0.12 | 84 |
| PAndAS 58 | 012902.1 404708 | 2.5 | M 31 | 0.78 | 167 | … | 0.12 | 103 |
| PAndAS 01 | 235712.0 433308 | 2.6 | M 31 | 0.78 | 333 | … | 0.12 | 15 |
| PAndAS 02 | 235755.6 414649 | 2.6 | M 31 | 0.78 | 266 | … | 0.11 | 50 |
| M(MW) | M(M31) | M(MW+M31) | M(M31)/M(MW) | Reference |
| … | … | … | (1) | |
| … | … | … | (2) | |
| … | … | … | (3) | |
| (4) | ||||
| … | … | … | (5) | |
| (6) | ||||
| (7) | ||||
| (8) | ||||
| (9) | ||||
| … | … | … | (10) | |
| … | … | … | (11) | |
| … | … | … | (12) | |
| … | … | … | (13) | |
| (14) | ||||
| (15) | ||||
| 1.2 | 1.7 | 2.9 | 1.3 | median |
References. (1) Deason et al. 2012; (2) van der Marel et al. 2012; (3) Veljanoski et al. 2013; (4) Diaz et al. 2014; (5) Bhattacharjee et al. 2014; (6) Shull 2014; (7) Karachentsev & Kudrya 2014; (8) Penarrubia et al. 2014; (9) Sofue 2015; (10) Penarrubia et al. 2016; (11) McMillan 2017; (12) Patel et al. 2017; (13) Fragione & Loeb 2017; (14) Peebles 2017; (15) present paper.
| Name | TI | MD | ||||||
| Mpc | km/s | Mpc | km/s | km/s | deg | |||
| (1) | (2) | (3) | (4) | (5) | (6) | (7) | (8) | (9) |
| WLM | 0.98 | 122 | 0.83 | 10 | 7 | 0.01 | M 31 | 27 |
| NGC 404 | 2.98 | 50 | 2.53 | 205 | 205 | 0.76 | Maffei2 | 1 |
| KKs3 | 2.00 | 316 | 2.24 | 103 | 109 | 1.25 | MWay | 11 |
| KKH 37 | 3.44 | 11 | 3.17 | 217 | 221 | 0.04 | M 81 | 6 |
| UGC 4879 | 1.37 | 25 | 1.34 | 25 | 33 | 0.63 | M 31 | 19 |
| Leo A | 0.74 | 24 | 0.93 | 47 | 53 | 0.03 | MWay | 29 |
| Sex B | 1.43 | 300 | 1.71 | 94 | 101 | 0.82 | MWay | 13 |
| NGC 3109 | 1.34 | 403 | 1.73 | 94 | 96 | 0.33 | Antlia | 9 |
| Sex A | 1.45 | 324 | 1.78 | 78 | 82 | 0.83 | MWay | 11 |
| Leo P | 1.73 | 262 | 1.95 | 120 | 128 | 1.07 | MWay | 12 |
| NGC 3741 | 3.22 | 229 | 3.27 | 255 | 262 | 0.69 | M 81 | 8 |
| DDO 99 | 2.65 | 251 | 2.76 | 247 | 255 | 0.62 | NGC 4214 | 9 |
| IC 3104 | 2.36 | 429 | 2.73 | 159 | 162 | 1.12 | NGC 4945 | 6 |
| DDO 125 | 2.61 | 206 | 2.69 | 242 | 251 | 0.94 | M 81 | 10 |
| DDO 147 | 3.01 | 331 | 3.14 | 342 | 350 | 0.60 | NGC 4214 | 8 |
| GR 8 | 2.19 | 217 | 2.48 | 128 | 132 | 1.37 | MWay | 9 |
| UGC 8508 | 2.67 | 56 | 2.66 | 176 | 184 | 0.80 | M 81 | 10 |
| DDO 181 | 3.10 | 214 | 3.19 | 278 | 285 | 0.87 | NGC 4736 | 8 |
| DDO 183 | 3.31 | 188 | 3.41 | 247 | 253 | 0.79 | NGC 4736 | 8 |
| KKH 86 | 2.61 | 287 | 2.93 | 198 | 202 | 1.38 | NGC 5128 | 7 |
| UGC 8833 | 3.25 | 221 | 3.37 | 273 | 280 | 0.89 | NGC 4736 | 8 |
| KK 230 | 2.21 | 63 | 2.34 | 120 | 127 | 1.34 | M 81 | 11 |
| DDO 187 | 2.30 | 160 | 2.51 | 171 | 178 | 1.44 | MWay | 10 |
| DDO 190 | 2.83 | 150 | 2.88 | 258 | 267 | 1.18 | M 81 | 9 |
| ESO 274–01 | 2.79 | 524 | 3.20 | 327 | 329 | 0.51 | NGC 5128 | 4 |
| KKR 25 | 1.91 | 79 | 1.84 | 126 | 137 | 0.98 | M 31 | 14 |
| IC 4662 | 2.55 | 302 | 2.87 | 131 | 135 | 1.24 | NGC 5128 | 7 |
| NGC 6789 | 3.55 | 140 | 3.28 | 153 | 156 | 1.32 | M 81 | 6 |
| Sag dIr | 1.08 | 79 | 1.19 | 20 | 29 | 0.44 | MWay | 22 |
| DDO 210 | 0.98 | 140 | 0.98 | 12 | 22 | 0.31 | MWay | 27 |
| IC 5152 | 1.96 | 122 | 2.08 | 70 | 77 | 1.20 | NGC 253 | 12 |
| KK 258 | 2.24 | 92 | 2.18 | 151 | 160 | 0.91 | NGC 253 | 12 |
| Tucana | 0.92 | 194 | 1.14 | 61 | 77 | 0.24 | MWay | 22 |
| UGCA 438 | 2.22 | 62 | 2.15 | 101 | 108 | 0.48 | NGC 55 | 12 |
| KKH 98 | 2.58 | 132 | 2.14 | 171 | 171 | 0.93 | M 31 | 2 |
| 0.10 | 0.20 | 0.30 | 0.40 | 0.50 | 0.60 | 0.70 | 0.80 | 0.90 | |
| 0.11 | 0.25 | 0.43 | 0.67 | 1.00 | 1.50 | 2.33 | 4.00 | 9.00 | |
| 26.7 | 24.9 | 23.6 | 23.1 | 23.4 | 24.2 | 25.7 | 27.7 | 30.0 | |
| 0.83 | 0.85 | 0.87 | 0.89 | 0.91 | 0.93 | 0.95 | 0.97 | 0.99 |
| Galaxy | SGL | SGB | |||||
| deg | deg | Mpc | km/s | (V,D) | |||
| (1) | (2) | (3) | (4) | (5) | (6) | (7) | (8) |
| M 31 | 336.19 | 12.55 | 0.78 | 29 | 10.79 | 12.49 | 90 |
| M Way | … | … | 0.01 | 65 | 10.70 | ||
| M 81 | 41.12 | 0.59 | 3.70 | 104 | 10.95 | 12.69 | 22 |
| M 82 | 40.72 | 1.05 | 3.61 | 328 | 10.59 | ||
| NGC 5128 | 159.75 | 5.25 | 3.68 | 310 | 10.89 | 12.89 | 28 |
| NGC 5236 | 147.93 | 0.99 | 4.90 | 307 | 10.86 | ||
| Maffei 2 | 359.58 | 0.83 | 3.48 | 214 | 10.86 | 12.51 | 3 |
| IC 342 | 10.60 | 0.37 | 3.28 | 244 | 10.60 | ||
| NGC 253 | 271.57 | 5.01 | 3.70 | 276 | 10.98 | 12.18 | 7 |
| NGC 247 | 275.92 | 3.73 | 3.72 | 216 | 9.50 | ||
| NGC 4826 | 95.61 | 6.13 | 4.41 | 365 | 10.49 | 10.78 | 4 |
| DDO 154 | 90.13 | 6.90 | 4.04 | 354 | 7.59 | ||
| NGC 4736 | 76.24 | 9.50 | 4.41 | 352 | 10.56 | 12.43 | 16 |
| NGC 4449 | 72.30 | 6.18 | 4.27 | 249 | 9.68 | ||
| M 101 | 63.58 | 22.61 | 6.95 | 378 | 10.79 | 12.17 | 6 |
| NGC 5474 | 64.30 | 22.93 | 6.98 | 424 | 9.21 | ||
| NGC 4258 | 68.74 | 5.55 | 7.66 | 506 | 10.92 | 12.50 | 7 |
| NGC 4242 | 70.28 | 4.81 | 7.9: | 568 | 9.47 | ||
| NGC 5055 | 76.20 | 14.25 | 9.04 | 562 | 11.00 | 12.49 | 0 |
| NGC 4460 | 71.58 | 6.48 | 9.59 | 551 | 9.66 | ||
| NGC 4594 | 126.69 | 6.68 | 9.30 | 894 | 11.30 | 13.45 | 0 |
| NGC 4597 | 121.05 | 5.12 | 10.1: | 912 | 9.48 | ||
| NGC 6744 | 208.10 | 10.38 | 9.51 | 706 | 10.91 | 11.72 | 4 |
| NGC 6684 | 205.81 | 9.11 | 8.7: | 720 | 10.39 | ||
| NGC 3115 | 112.40 | 42.86 | 9.68 | 439 | 10.95 | 12.54 | 0 |
| P 4078671 | 114.10 | 45.34 | 9.38 | 378 | 7.95 | ||
| NGC 2683 | 55.87 | 33.42 | 9.82 | 334 | 10.81 | 12.13 | 2 |
| KK 69 | 55.64 | 33.09 | 9.16 | 418 | 7.27 | ||
| NGC 3379 | 93.64 | 25.85 | 11.32 | 774 | 10.92 | 13.23 | 3 |
| NGC 3368 | 94.29 | 26.41 | 10.42 | 740 | 10.83 |
| Main gal. | Name | TI | MD | ||||
| Mpc | km/s | km/s | deg | ||||
| (1) | (2) | (3) | (4) | (5) | (6) | (7) | (8) |
| M81 | UGC04879 | 2.40 | 141 | 147 | 0.63 | M31 | 153 |
| M81 | UGC06456 | 1.26 | 38 | 86 | 0.31 | M81 | 35 |
| M81 | NGC3738 | 2.16 | 150 | 170 | 1.01 | M81 | 33 |
| M81 | UGC06757 | 1.37 | 51 | 42 | 0.41 | M81 | 40 |
| M81 | UGC07242 | 2.06 | 56 | 48 | 0.40 | N4605 | 24 |
| M81 | NGC4236 | 1.13 | 17 | 15 | 0.16 | M81 | 44 |
| M81 | NGC4605 | 2.36 | 131 | 138 | 1.07 | M101 | 29 |
| M81 | DDO165 | 1.71 | 56 | 41 | 0.64 | N4236 | 39 |
| M81 | UGC08245 | 1.54 | 14 | 27 | 0.58 | M81 | 40 |
| NGC5128 | NGC3621 | 3.50 | 219 | 204 | 1.68 | N4594 | 34 |
| NGC5128 | ESO320-014 | 2.66 | 134 | 100 | 0.68 | N3621 | 38 |
| NGC5128 | ESO379-007 | 2.07 | 129 | 111 | 1.04 | N5236 | 45 |
| NGC5128 | ESO381-018 | 1.45 | 81 | 74 | 0.40 | N5236 | 29 |
| NGC5128 | ESO381-020 | 1.47 | 55 | 39 | 0.33 | N5236 | 29 |
| NGC5128 | ESO443-009 | 1.97 | 124 | 119 | 0.53 | N5236 | 24 |
| NGC5128 | KK182 | 1.80 | 66 | 62 | 0.67 | N5236 | 16 |
| NGC5128 | ESO270-017 | 2.86 | 282 | 289 | 1.35 | N5236 | 15 |
| NGC5128 | HIPASS J1348-37 | 1.45 | 56 | 54 | 0.21 | N5236 | 12 |
| NGC5128 | HIPASS J1351-47 | 1.80 | 20 | 11 | 0.87 | N5236 | 29 |
| NGC5128 | NGC5408 | 1.28 | 0 | 25 | 0.35 | N5236 | 29 |
| NGC5128 | ESO223-009 | 2.78 | 142 | 120 | 1.42 | N5236 | 33 |
| Maffei2 | UGC01281 | 3.00 | 215 | 223 | 1.20 | N784 | 37 |
| Maffei2 | KK17 | 2.97 | 220 | 238 | 0.96 | N784 | 41 |
| Maffei2 | NGC0784 | 3.25 | 240 | 254 | 1.30 | U1281 | 37 |
| Maffei2 | KKH18 | 2.45 | 207 | 243 | 1.17 | Maffei2 | 42 |
| Maffei2 | KKH34 | 1.80 | 110 | 106 | 0.65 | M81 | 39 |
| N253 | WLM | 2.76 | 288 | 298 | 0.01 | M31 | 161 |
| N253 | NGC0045 | 3.02 | 259 | 260 | 1.05 | N24 | 10 |
| N253 | PiscesA | 3.49 | 278 | 292 | 1.68 | N253 | 40 |
| N253 | NGC0059 | 1.35 | 163 | 174 | 0.37 | N253 | 23 |
| N253 | DDO226 | 1.24 | 136 | 138 | 0.27 | N253 | 9 |
| N253 | UGCA438 | 1.76 | 178 | 221 | 0.48 | N55 | 136 |
| N4826 | AGC749241 | 1.32 | 65 | 59 | 0.73 | N4656 | 20 |
| N4826 | GR8 | 2.26 | 227 | 230 | 1.37 | MW | 165 |
| N4826 | DDO187 | 2.34 | 202 | 207 | 1.44 | MW | 144 |
| N4736 | NGC3741 | 1.47 | 105 | 95 | 0.69 | M81 | 135 |
| N4736 | DDO099 | 1.87 | 99 | 86 | 0.62 | N4214 | 153 |
| N4736 | UGCA281 | 1.48 | 30 | 12 | 0.92 | N4258 | 24 |
| N4736 | DDO126 | 0.76 | 64 | 136 | 0.02 | N4736 | 37 |
| N4736 | DDO125 | 1.80 | 92 | 90 | 0.94 | M81 | 169 |
| N4736 | Arp211 | 1.78 | 146 | 146 | 0.86 | N4258 | 9 |
| N4736 | DDO147 | 1.42 | 4 | 13 | 0.60 | N4214 | 164 |
| N4736 | NGC5023 | 1.72 | 141 | 141 | 0.89 | M101 | 13 |
| N4736 | UGC08508 | 1.94 | 172 | 183 | 0.80 | M81 | 144 |
| N4736 | DDO181 | 1.44 | 73 | 59 | 0.87 | N4736 | 149 |
| N4736 | DDO183 | 1.36 | 107 | 109 | 0.79 | N4736 | 136 |
| N4736 | KK230 | 2.36 | 220 | 235 | 1.34 | M81 | 148 |
| N4736 | DDO190 | 1.91 | 116 | 85 | 1.18 | M81 | 135 |
| M101 | LV J1157+5638 | 3.00 | 190 | 215 | 0.80 | N4258 | 45 |
| M101 | NGC4068 | 3.07 | 131 | 98 | 0.48 | N4736 | 137 |
| M101 | MCG +09-20-131 | 2.82 | 161 | 167 | 0.43 | N4736 | 137 |
| M101 | UGC07298 | 3.14 | 149 | 136 | 0.35 | N4736 | 142 |
| M101 | NGC4736 | 3.07 | 87 | 12 | 0.13 | N4449 | 136 |
| M101 | NGC5204 | 2.44 | 49 | 40 | 0.88 | N4736 | 162 |
| M101 | NGC5238 | 2.49 | 43 | 37 | 0.41 | N4736 | 166 |
| M101 | KKH87 | 1.97 | 97 | 96 | 0.81 | N5194 | 11 |
| M101 | DDO194 | 1.29 | 15 | 4 | 0.10 | N5585 | 150 |
| N4258 | KK109 | 3.23 | 270 | 275 | 0.32 | N4736 | 164 |
| N4258 | MCG +06-27-017 | 3.05 | 185 | 180 | 0.22 | N4395 | 151 |
| N4258 | NGC4395 | 3.25 | 222 | 225 | 0.12 | N4736 | 146 |
| N4258 | NGC4707 | 1.38 | 9 | 66 | 0.45 | N4258 | 143 |
| N4258 | NGC4861 | 3.17 | 371 | 464 | 0.57 | N5055 | 37 |
| N6744 | IC4710 | 2.06 | 139 | 137 | 0.99 | N6684 | 158 |
| N6744 | IC4870 | 1.00 | 4 | 40 | 0.22 | N6744 | 142 |
| N2683 | AGC182595 | 1.61 | 27 | 12 | 0.78 | N2683 | 144 |
| N3379 | DDO088 | 3.20 | 328 | 329 | 0.45 | N3627 | 174 |
| Case | Minor attractor | Major attractor | ||||
| km s-1 Mpc-1 | km s-1 | Mpc | km s-1 Mpc-1 | km s-1 | Mpc | |
| (1) | (2) | (3) | (4) | (5) | (6) | (7) |
| Main galaxy (MG) | 76 | 62 | 0.83 | 80 | 84 | 0.93 |
| MG-normalized | 80 | 65 | 0.71 | 82 | 89 | 0.76 |
| Barycenter (BC) | 85 | 57 | 0.93 | 85 | 84 | 1.03 |
| BC-normalized | 88 | 66 | 0.76 | 95 | 85 | 0.93 |