In-depth study of the phase diagram of Sr4Ru3O10 by magnetization experiments
Abstract
We present magnetization measurements on Sr4Ru3O10 as a function of temperature and magnetic field applied perpendicular to the magnetic easy -axis inside the ferromagnetic phase. Peculiar metamagnetism evolves in Sr4Ru3O10 below the ferromagnetic transition as a double step in the magnetization at two critical fields and . We map the phase diagram with special focus on the temperature range 50 K . We find that the critical field connects the field and temperature axes of the phase diagram, whereas the boundary starts at 2.8 T for the lowest temperatures and ends in a critical endpoint at (1 T; 80 K). We conclude from the temperature dependence of the ratio that the double metamagnetic transition is an intrinisc effect of the material and it is not caused by sample stacking faults such as twinning or partial in-plane rotation between layers.
keywords:
strontiumruthenate, ferromagnetism, metamagnetic transition, magnetic anisotropy, phase diagramIntroduction
Sr4Ru3O10 is a strongly correlated electron system that orders ferromagnetically below K with a magnetic easy axis along the crystallographic direction.[1] It shows a metamagnetic (MM) transition for magnetic fields applied perpendicular to . The metamagnetism manifests as double step in the magnetization.[2] It is accompanied by a reduction of the magnetic moment, which points to the existence of antisymmetric exchange coupling in the system.[3] Pronounced anomalies close to the critical fields and of the MM transition are also observed in transport[4, 5, 6], and thermodynamic properties.[7, 8, 9] A complete understanding of the MM transition in Sr4Ru3O10 is still lacking despite a great deal of experimental effort in recent years.
One open question is whether the double step in the magnetization is an intrinsic property of the system or caused by misaligned crystallographic domains in the measured single crystal, because it was only discovered recently.[2, 3] We check this point with a precise estimation of and for geometrical relations which can distinguish between both scenarios.
Experiment
We utilize magnetization measurements to obtain the detailed phase diagram for temperatures up to 120 K and magnetic fields up to 3 T. The magnetization is measured with a Quantum Design MPMS. Details of the magnetization experiment as well as sample growth and characterization techniques are described elsewhere.[3] Special care is taken to start each measurement after zero field cooling the sample.
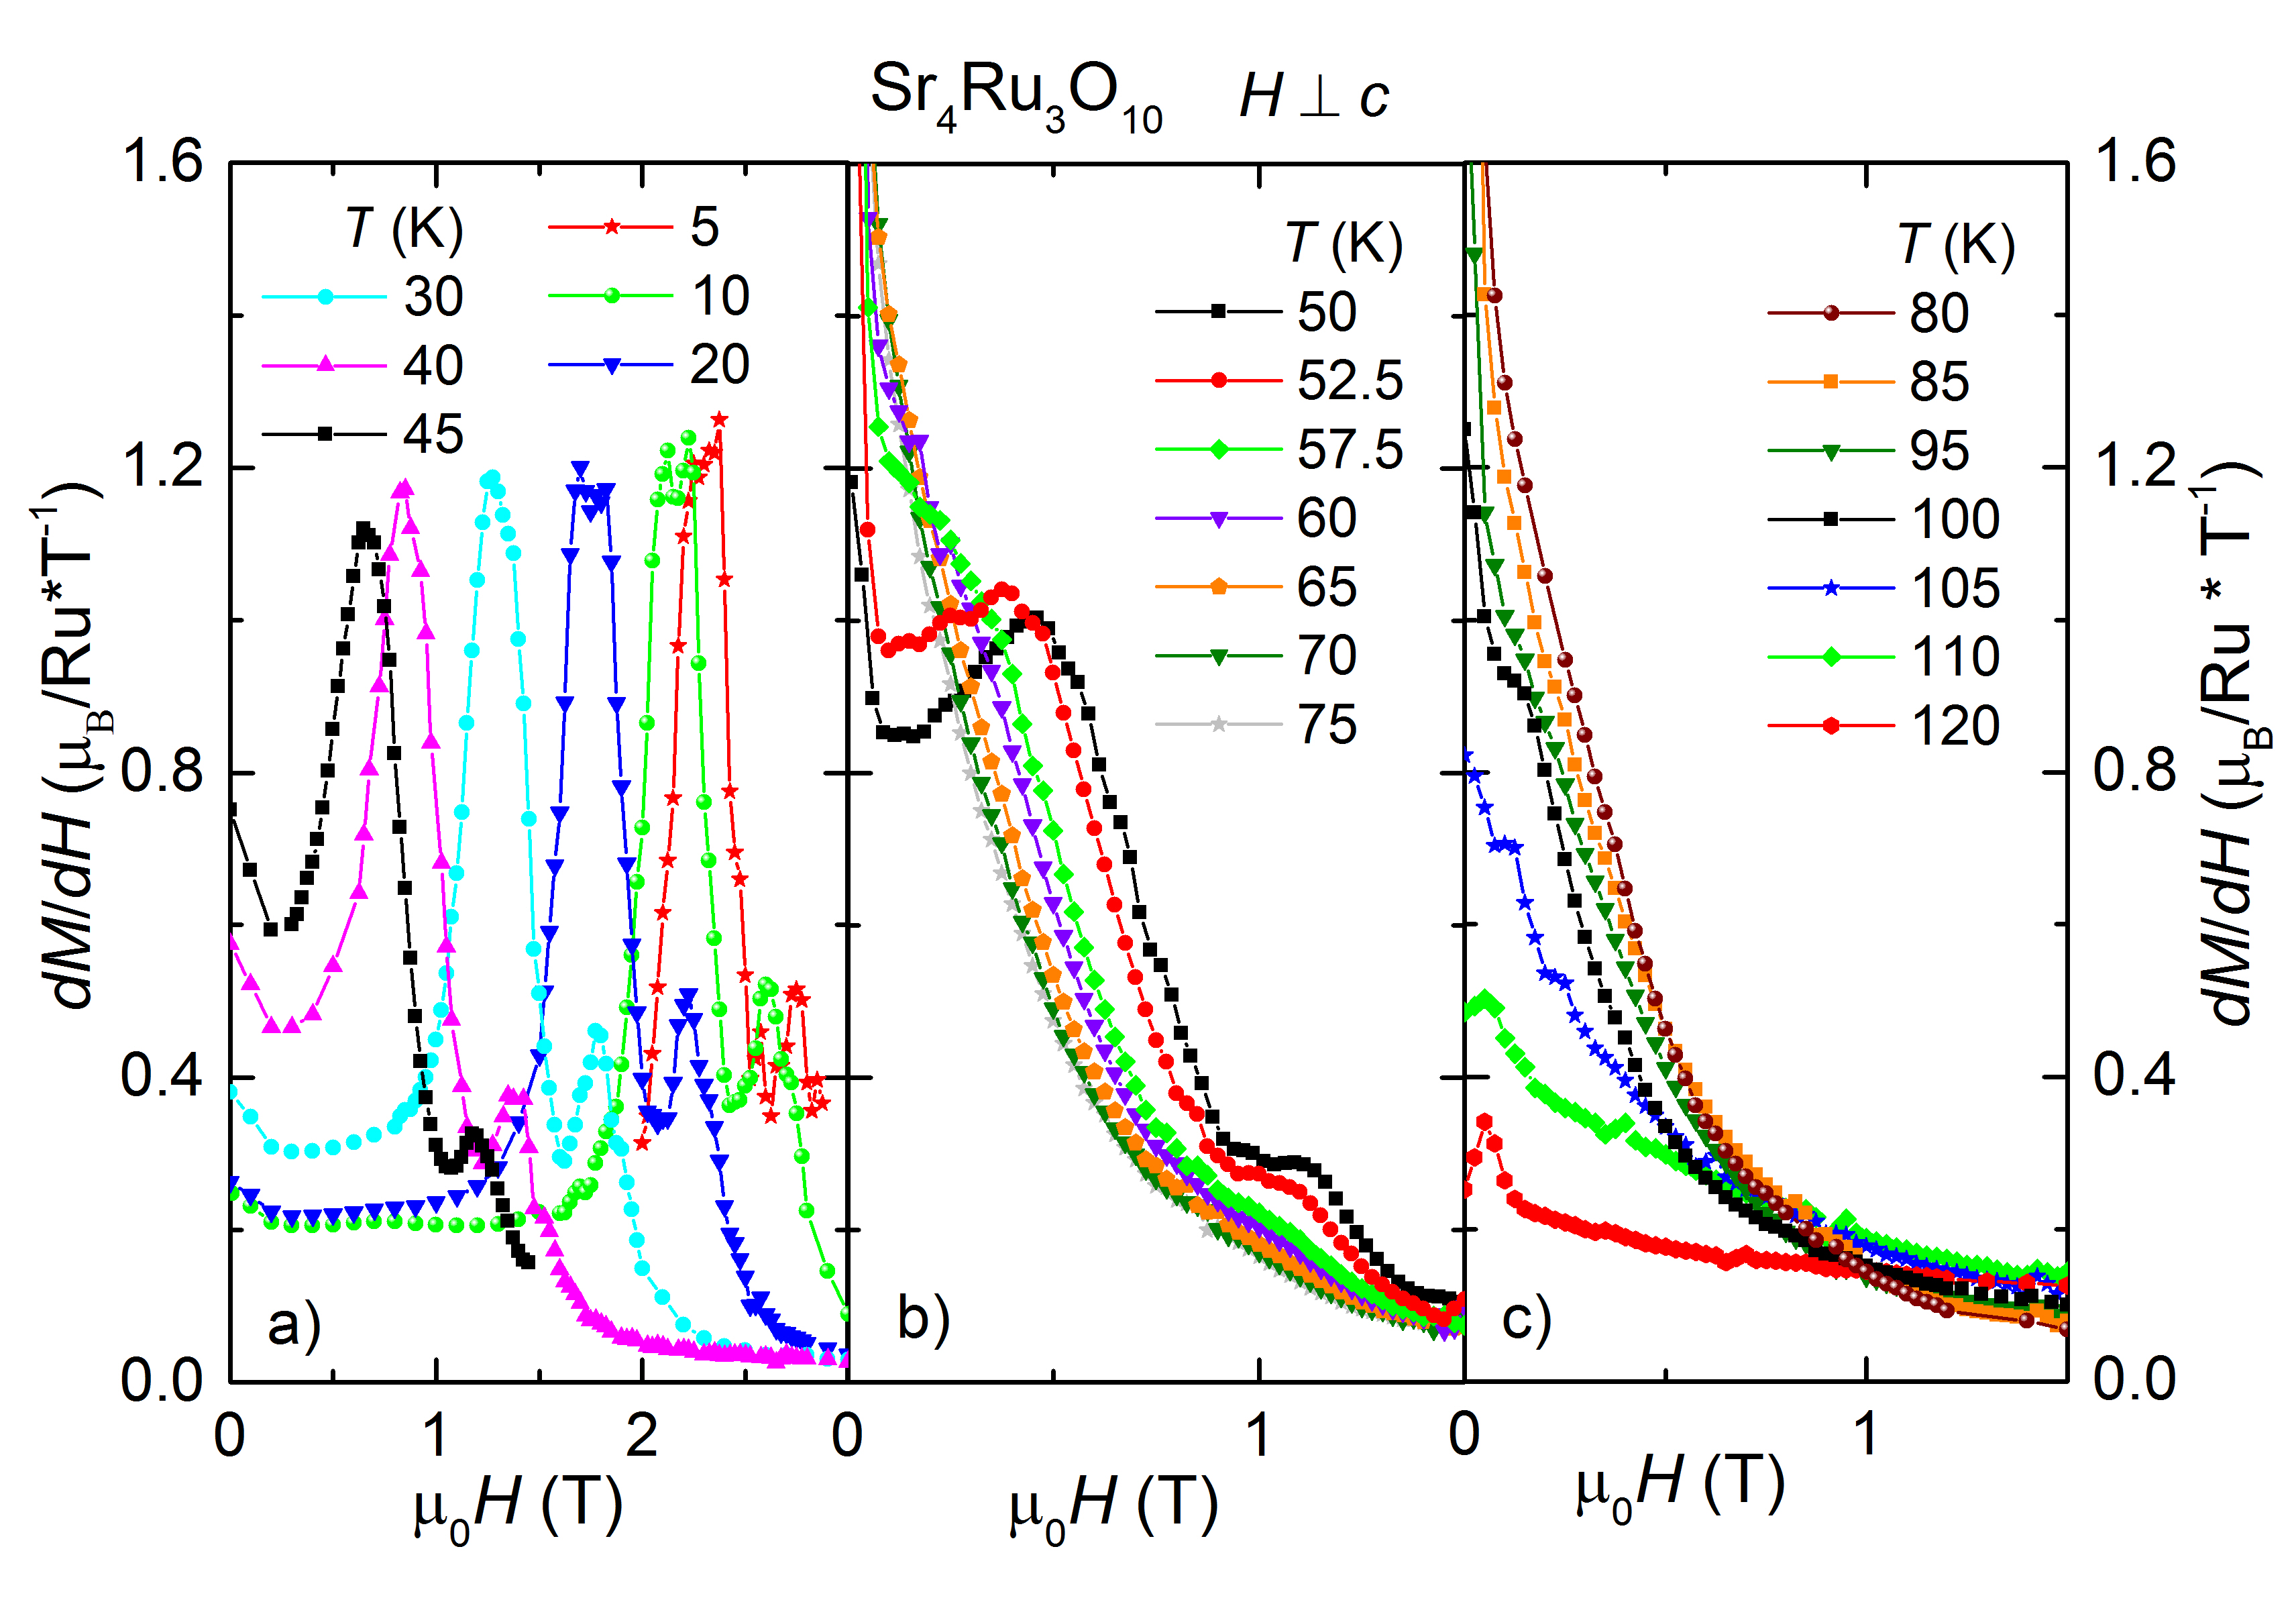
Figure 1 shows the susceptibility for increasing field in 3 different temperature ranges (a) 50 K, (b) 50 K 75 K, and (c) 80 K 120 K. A clear double maximum is observed in panel a), accompanied by large hysteresis when compared to measurements on decreasing fields (data not shown). The critical fields and defined at the 2 maxima reach their largest values of 2.3 T and 2.8 T below 5 K. They shift to lower fields in temperatures up to 45 K, but the sizes of the maximum stay almost constant. The anomalies broaden significantly at intermediate temperatures (panel b) and they vanish completely above 80 K as shown in panel c.
We use background subtraction to help identify the MM anomalies at and . The measurements taken at 85 K and 95 K serve as background (BG). The refined susceptibility is displayed in Fig. 2 a) for the 85 T reference and b) for the 95 T reference.
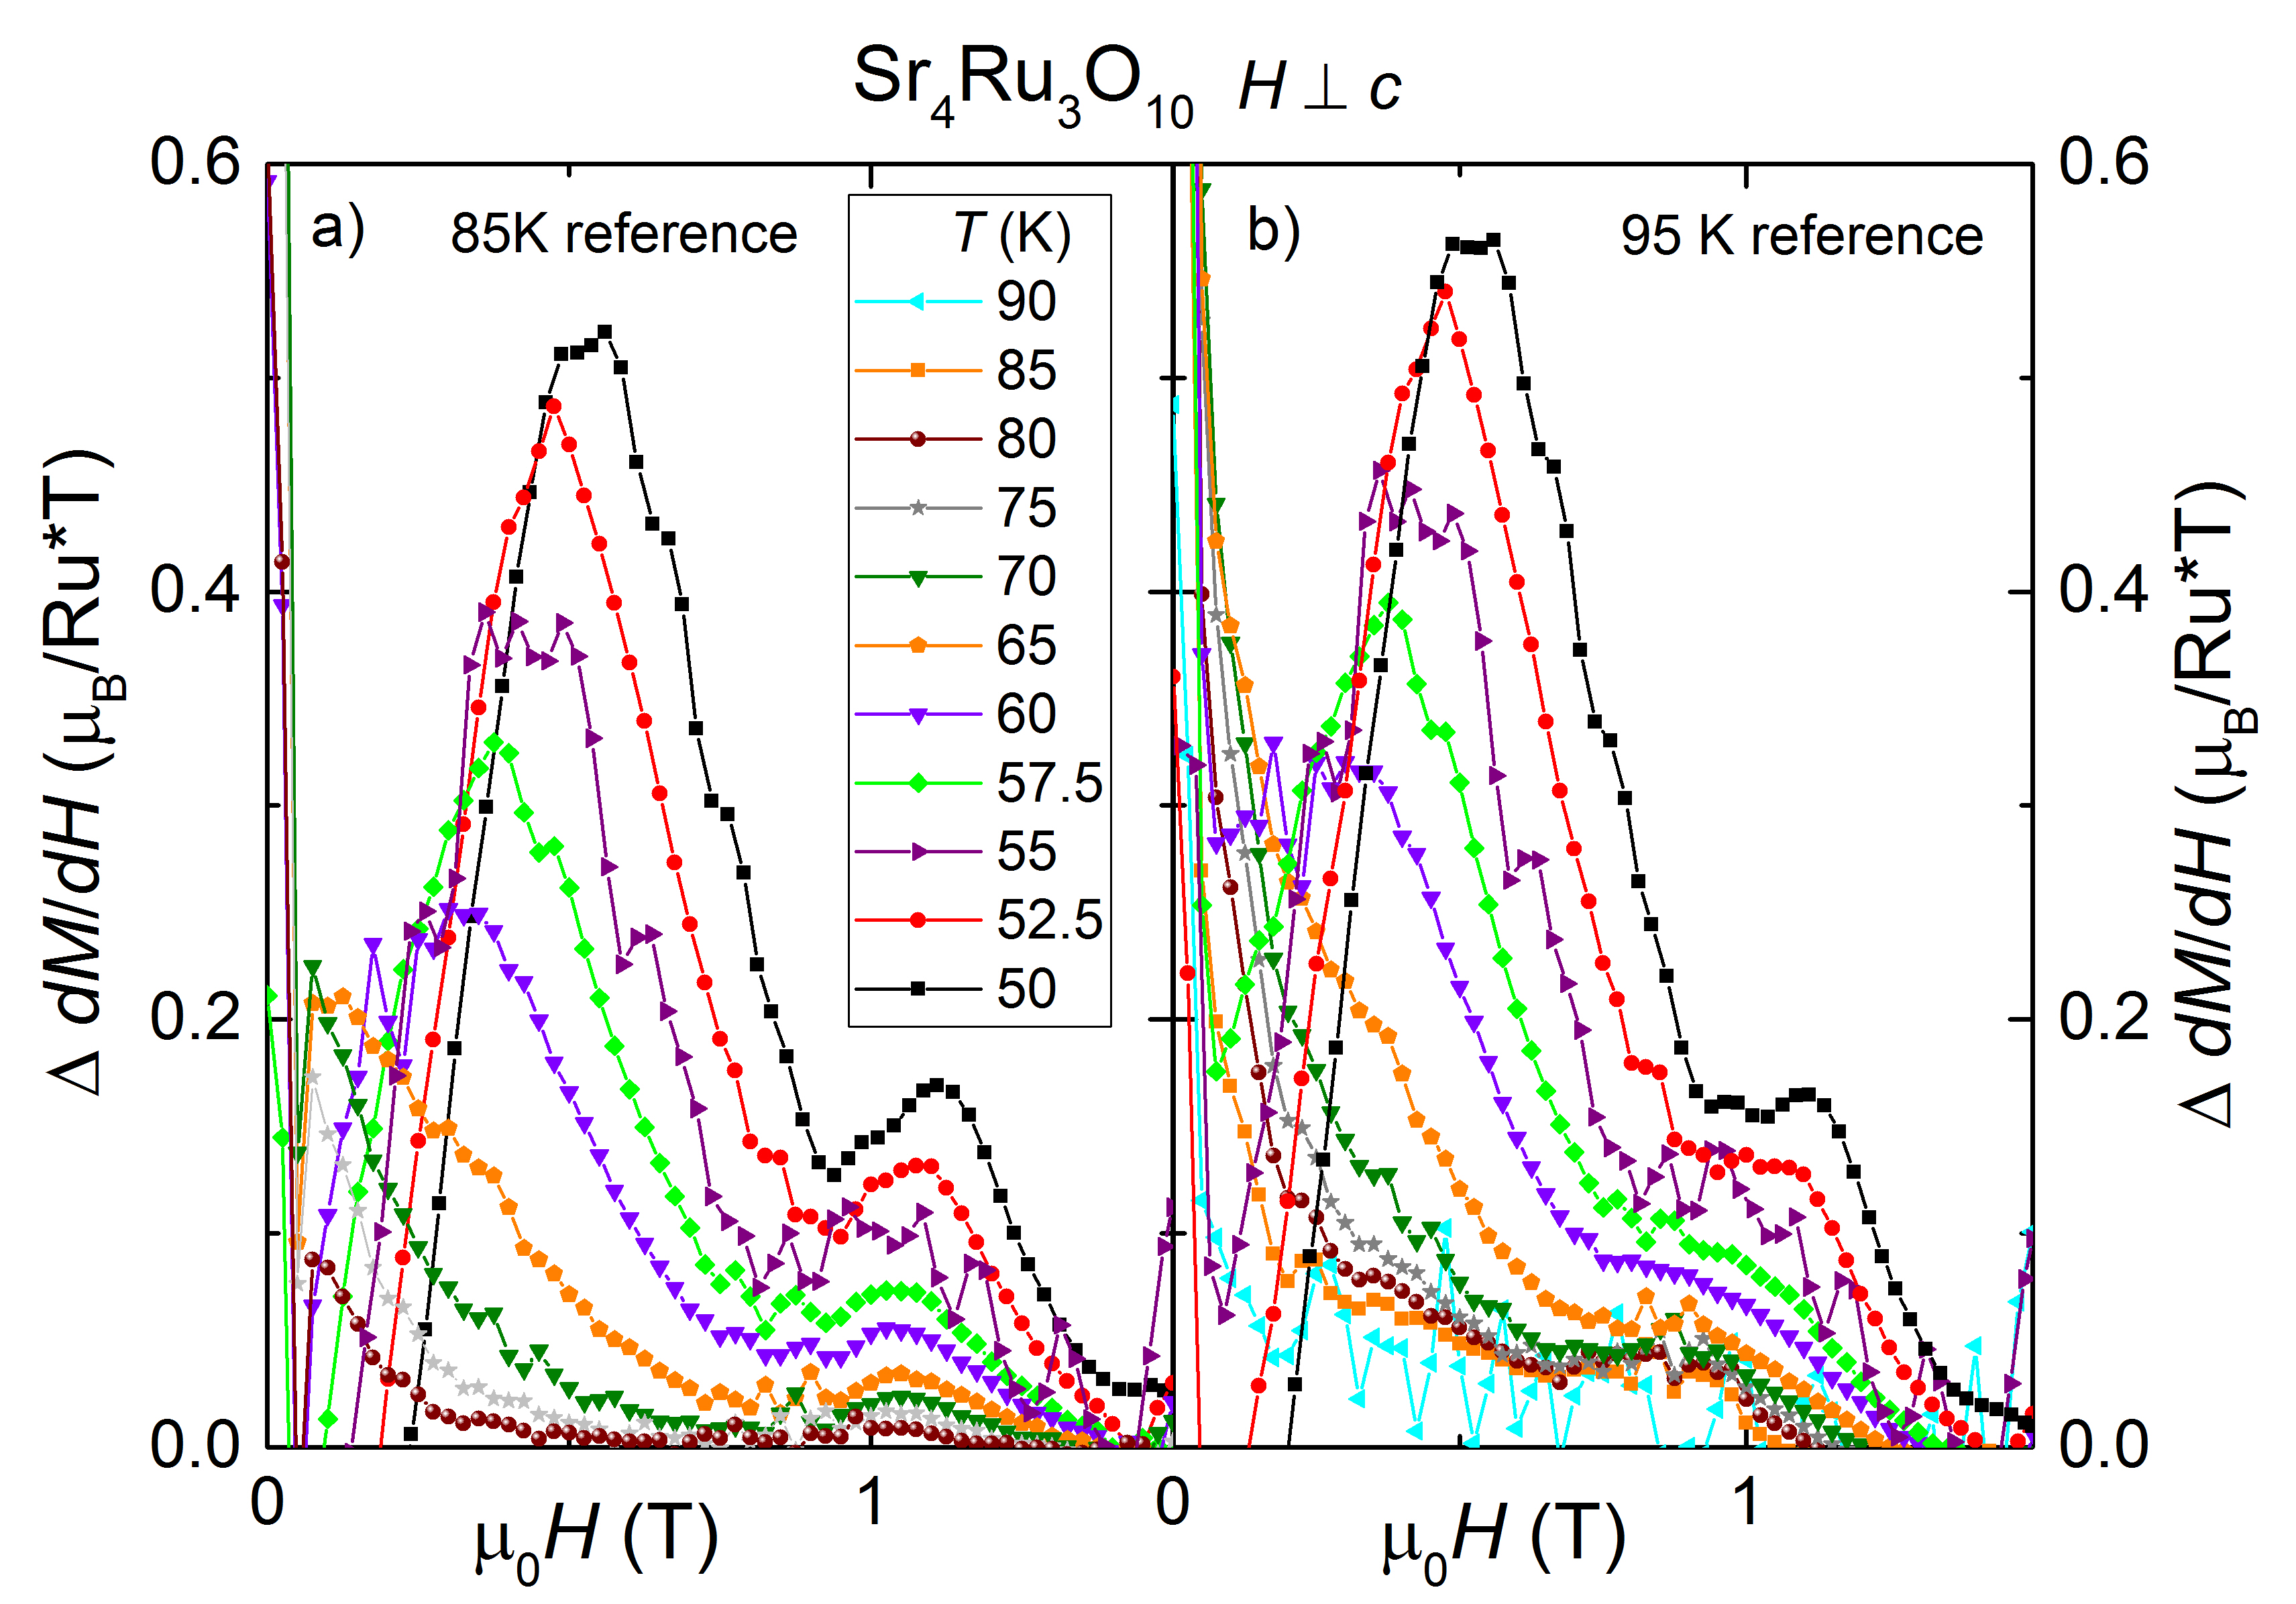
The position of the maxima in can be tracked in both sets of data all the way up to 80 K. We observe that moves to zero field whereas shifts only down to 1 T at high temperatures. There is a small difference in the position of and depending on the chosen background of 85 K or 95 K, however, the overall shape of the and phase boundaries are the same.
Discussion
Fig. 3 summarizes the magnetization results in the phase diagram. We add data points obtained by Carleschi et al. [2] below 60 K. The error bars of the critical fields reflect the discussed variation on the respective background subtraction in the intermediate temperature range.
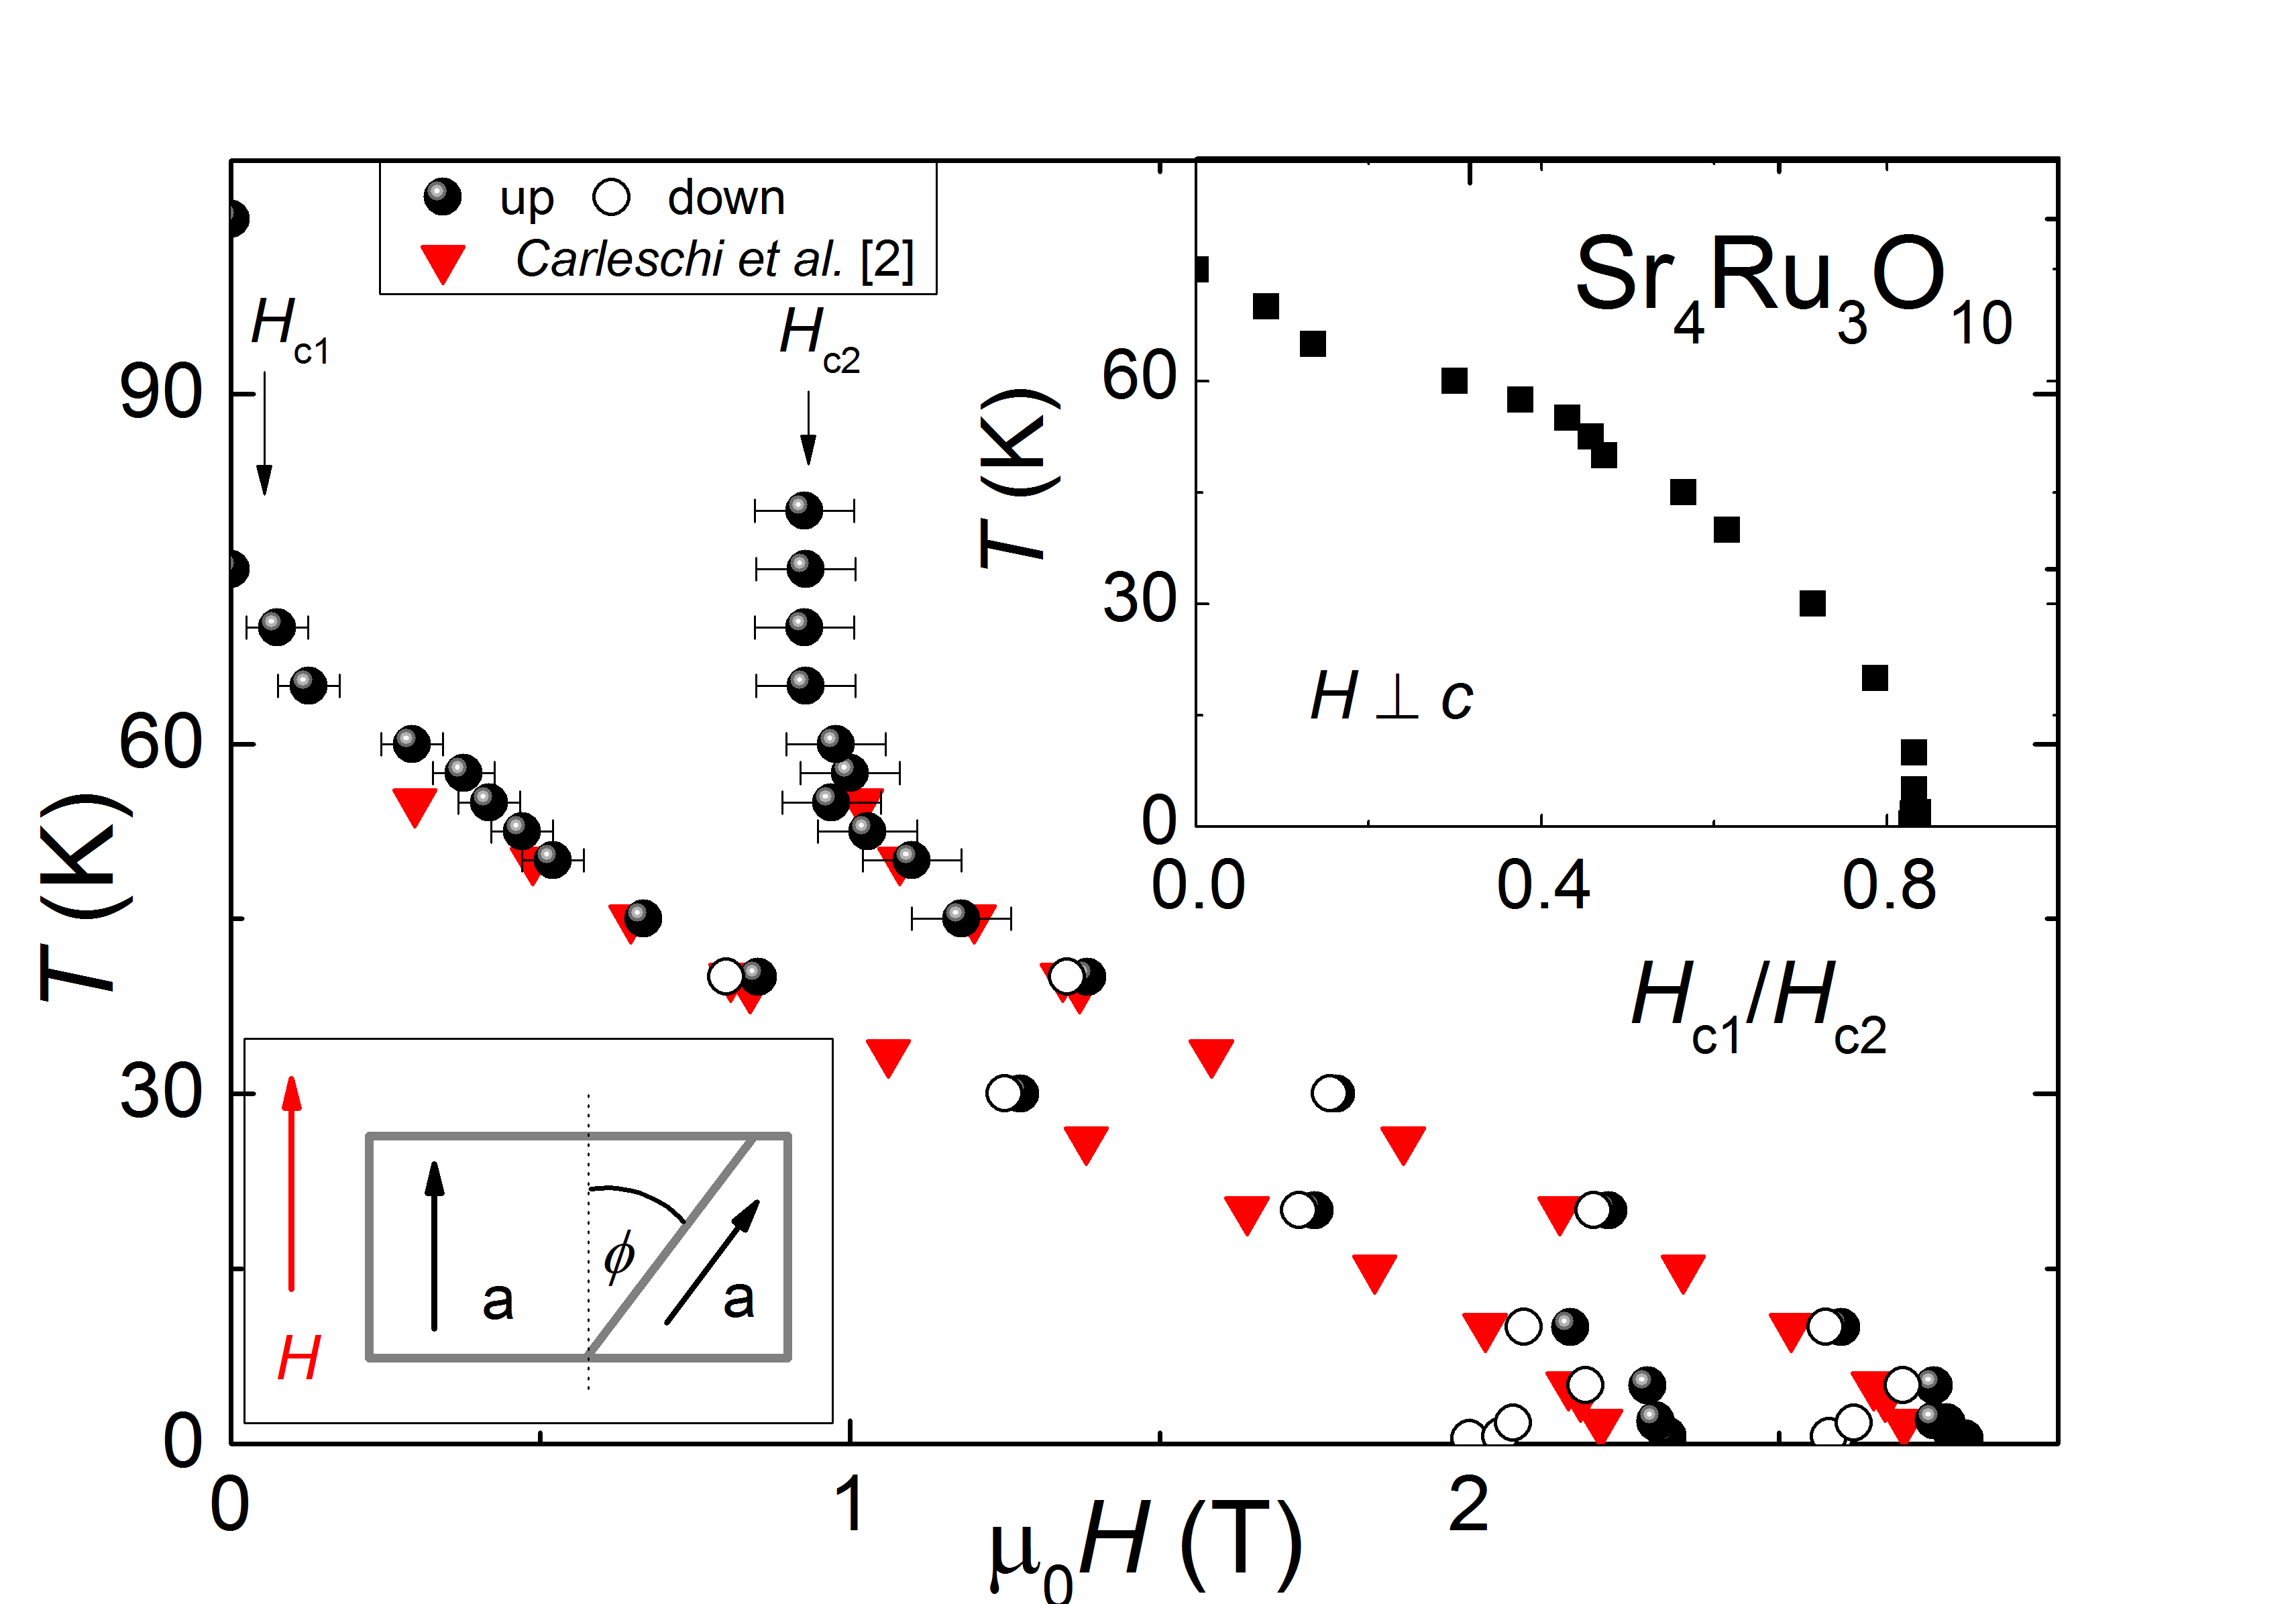
Striking in the phase diagram is that is a closed phase boundary connecting the temperature with the field axis. In contrast, is an open line starting at 2.8 T for lowest temperatures and ending in a critical end point around 80 K.
One explanation for the double step in at the MM transition could be that the measurements were done on a single crystal consisting of two different domains that are rotated in the -plane with respect to each other as sketched in Fig. 3, lower inset. This twinning under an angle could explain two different values for the critical field, because the rotated sample fraction sees a smaller effective applied field . Foregoing assumption implies that the ratio does not change with temperature. The upper inset of Fig. 3 displays the temperature evolution of . It clearly changes from 0.8 at low temperature to zero at 80 K where both MM transitions vanish. We interpret this temperature dependence as strong indication that the double step in the magnetization at the MM transition is an intrinsic property of Sr4Ru3O10 and not due to single crystal twinning or other geometrical effects.
Acknowledgment
F.W. and M.J. acknowledge support from the US NSF, Division of Material Research, Grant 1157490. L.C. and B.M. were supported by the US DOE, Office of Science, Basic Energy Sciences, Materials Sciences and Engineering Division. A.M.S. acknowledges financial support from the SA-NRF (93549) and from the UJ Research Committee.
References
References
- [1] M. K. Crawford, R. L. Harlow, W. Marshall, Z. Li, G. Cao, R. L. Lindstrom, Q. Huang, J. W. Lynn, Structure and magnetism of single crystal sr4ru3o10: A ferromagnetic triple-layer ruthenate, Physical Review B 65 (21) (2002) 214412–1–5.
- [2] E. Carleschi, B. P. Doyle, R. Fittipaldi, V. Granata, A. M. Strydom, M. Cuoco, A. Vecchione, Double metamagnetic transition in sr4ru3o10, Physical Review B 90 (2014) 205120–1–9.
- [3] F. Weickert, L. Civale, B. Maiorov, M. Jaime, M. B. Salamon, E. Carleschi, A. M. Strydom, R. Fittipaldi, V. Granata, A. Vecchione, Missing magnetism in sr4ru3o10: Indication for antisymmetric exchange interaction, Scientific Reports 7 (2017) 3867. doi:10.1038/s41598-017-03648-2.
- [4] D. Fobes, M. H. Yu, M. Zhou, J. Hooper, C. J. O’Connor, M. Rosario, Z. Q. Mao, Phase diagram of the electronic states of trilayered ruthenate sr4ru3o10, Physical Review B 75 (2007) 094429–1–5.
- [5] Z. Xu, X. Xu, R. S. Freitas, Z. Long, M. Zhou, D. Fobes, M. Fang, P. Schiffer, Z. Mao, Y. Liu, Magnetic, electrical transport, and thermoelectric properties of sr4ru3o10: Evidence for a field-induced electronic phase transition at low temperatures, Physical Review B 76 (9) (2007) 094405–1–6.
- [6] D. Fobes, T. J. Liu, Z. Qu, M. Zhou, J. Hooper, M. Salamon, Z. Q. Mao, Anisotropy of magnetoresistance in sr4ru3o10: Evidence for an orbital-selective metamagnetic transition, Physical Review B 81 (2010) 172402–1–4.
- [7] G. Cao, S. Chikara, J. W. Brill, P. Schlottmann, Anomalous itinerant magnetism in single crystal sr4ru3o10: A thermodynamic and transport investigation, Physical Review B 75 (2007) 024429–1–6.
- [8] R. Gupta, M. Kim, H. Barath, S. L. Cooper, G. Cao, Field- and pressure-induced phases in sr4ru3o10: A spectroscopic investigation, Physical Review Letters 96 (2006) 067004–1–4.
-
[9]
W. Schottenhamel, M. Abdel-Hafiez, R. Fittipaldi, V. Granata, A. Vecchione,
M. Hücker, A. U. B. Wolter, B. Büchner,
Dilatometric study
of the metamagnetic and ferromagnetic phases in the triple-layered
system, Phys. Rev. B
94 (2016) 155154.
doi:10.1103/PhysRevB.94.155154.
URL http://link.aps.org/doi/10.1103/PhysRevB.94.155154