The Discovery of a Five-Image Lensed Quasar at z = 3.34 using PanSTARRS1 and Gaia
Abstract
We report the discovery, spectroscopic confirmation, and mass modelling of the gravitationally lensed quasar system PS J06301201. The lens was discovered by matching a photometric quasar catalogue compiled from Pan-STARRS1 and WISE photometry to the Gaia DR1 catalogue, exploiting the high spatial resolution of the latter (FWHM ) to identify the three brightest component of the lensed quasar system. Follow-up spectroscopic observations with the WHT confirm the multiple objects are quasars at redshift . Further follow-up with Keck AO high-resolution imaging reveals that the system is composed of two lensing galaxies and the quasar is lensed into a 28 separation four-image cusp configuration with a fifth image clearly visible, and a 10 arc due to the lensed quasar host galaxy. The system is well-modelled with two singular isothermal ellipsoids, reproducing the position of the fifth image. We discuss future prospects for measuring time delays between the images and constraining any offset between mass and light using the faintly detected Einstein arcs associated with the quasar host galaxy.
keywords:
gravitational lensing: strong – quasars: general – methods: observational – methods: statistical1 Introduction
Gravitationally lensed quasars can be used as tools for a variety of astrophysical and cosmological applications (e.g. Treu, 2010; Jackson, 2013), including: mapping the dark matter substructure of the lensing galaxy (e.g. Metcalf & Madau, 2001; Kochanek & Dalal, 2004; Nierenberg et al., 2014; Vegetti et al., 2014; Birrer et al., 2017); determining the mass (e.g. Morgan et al., 2010) and spin (Reynolds et al., 2014) of black holes; and measuring the properties of distant host galaxies (e.g. Kochanek et al., 2001; Claeskens et al., 2006; Peng et al., 2006; Ding et al., 2017). In addition, they can also be used to constrain cosmological parameters with comparable precision to baryonic acoustic oscillation methods (e.g Suyu et al., 2010, 2013) and to probe the physical properties of quasar accretion disks through microlensing studies (e.g. Kochanek, 2004; Poindexter et al., 2008; Motta et al., 2012).
Ostrovski et al. (2017) found that, for the Dark Energy Survey (DES - DES Collaboration 2005; DES Collaboration et al. 2016), no simulated gravitationally lensed quasar system with image separation less than 15 is segmented into multiple catalogue sources due to limitations on survey resolution. As a result, only of simulated systems with pairs of quasar images are segmented into two sources. This means that to identify lensed quasars as groups of close sources of similar colours, one has to either employ 2D modelling techniques (Ostrovski et al. 2017, in prep.) or rely on cross-matching to higher resolution imaging surveys such as Gaia (FWHM 01; Lemon et al. 2017).
Gaia (Gaia Collaboration et al., 2016a) is a space observatory performing a full sky survey to study the Milky Way. Gaia data release 1 (DR1 - Lindegren et al. 2016) contains positions for a total of sources across the whole sky with a point source limiting magnitude of (Gaia Collaboration et al., 2016b).
Here, we present the discovery of the lensed quasar PS J06301201 from a preliminary search for gravitationally lensed quasars from Pan-STARRS1 (PS - Chambers et al. 2016) combined with the Wide-field Infrared Survey Explorer (WISE - Wright et al. 2010) by cross-matching to Gaia DR1 detections. All magnitudes are quoted on the AB system. Conversions from Vega to AB for the WISE data are and (Jarrett et al., 2011).
2 Lens Discovery and Confirmation
To select gravitationally lensed quasar candidates, we first create a morphology-independent (i.e., not restricted to objects consistent with the point spread function) photometric quasar catalogue using Gaussian Mixture Models, a supervised machine learning method of generative classification, as described in Ostrovski et al. (2017). We use WISE and PS photometry to define , , , and colours and we employ three model classes (point sources, extended sources, and quasars) to generate a catalogue of 378,061 quasar candidates from a parent sample of 80,028,181 objects with <20. To remove stellar contaminants at low galactic latitude, we apply conservative colour cuts based on the comparisons between the known quasar distribution and the distribution of our candidates as well as removal of objects with high point source probabilities. We also discard objects with a neighbouring candidate within 5′′ yielding a total of 296,967 objects, since the spatial resolution of PS is enough to flag these systems as potential lensed quasar candidates or binary pairs.
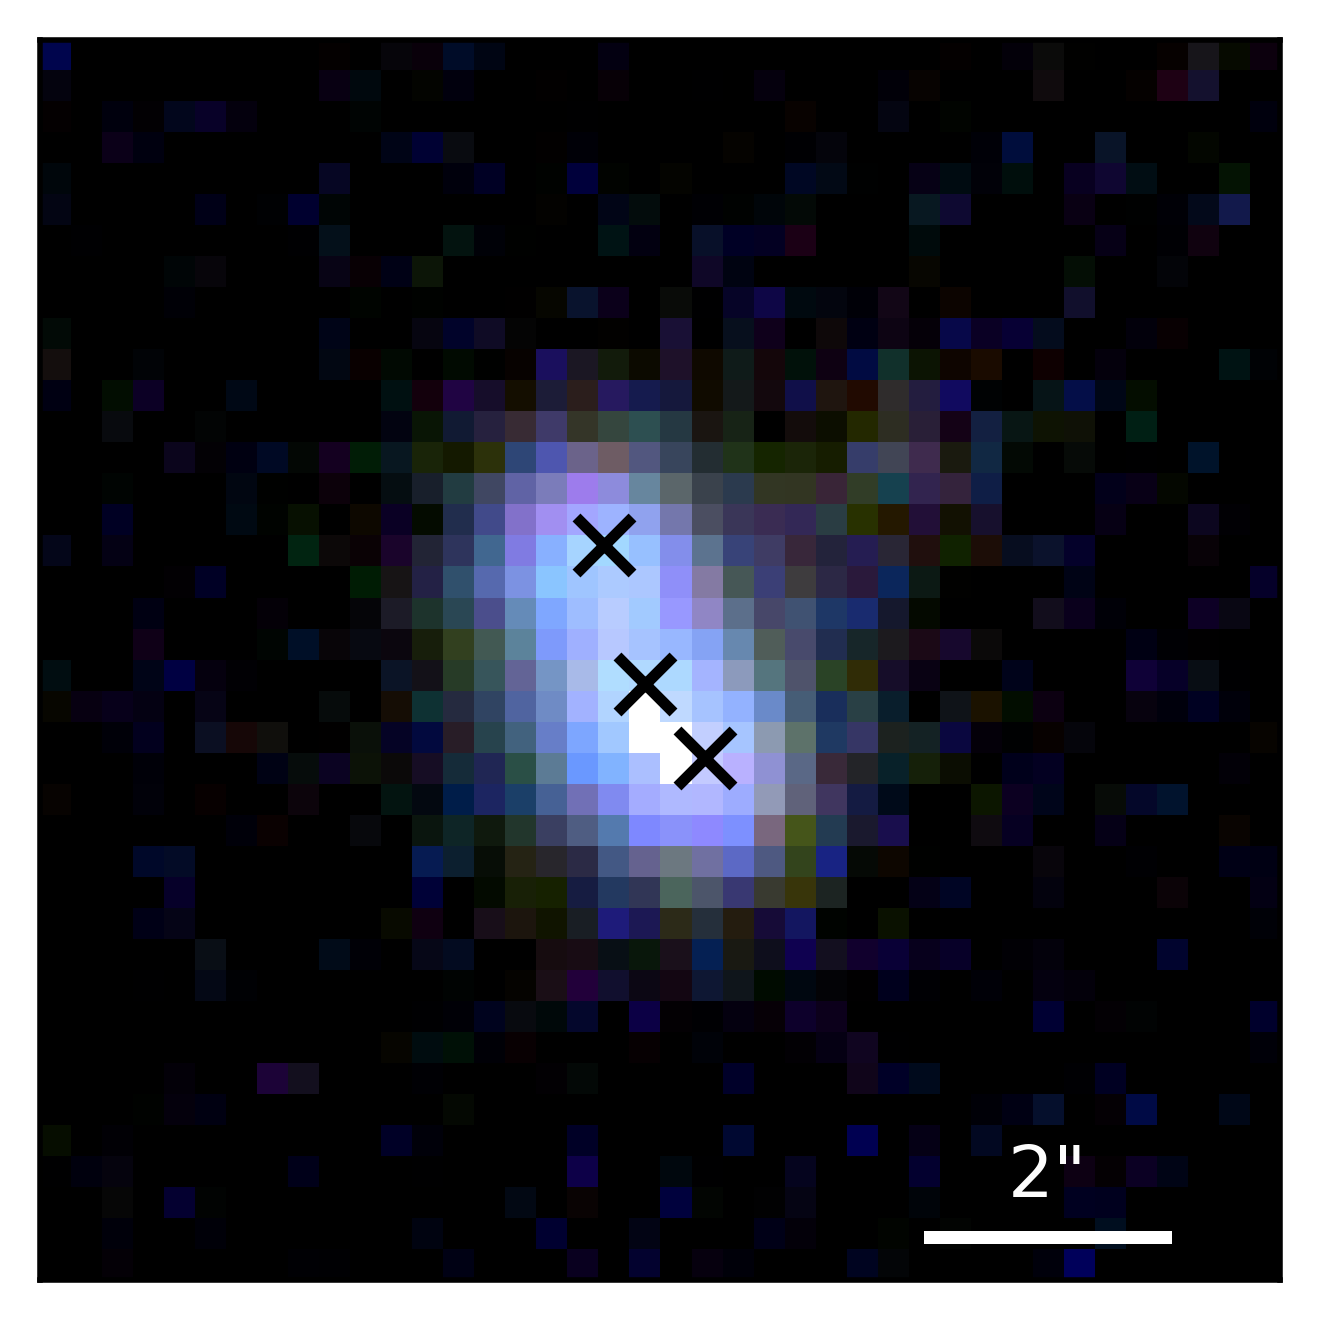
We then exploit the excellent spatial resolution and all-sky coverage of the Gaia DR1 catalogue to identify lensed quasar candidates by resolving the photometric quasars into multiple components. Gaia DR1 is known to be enormously incomplete for close-separation objects but nevertheless can identify multiple components of lensed quasars (see Lemon et al. 2017 for details). We cross-match our photometric quasar candidates with the Gaia DR1 catalogue using a 3′′ search radius and find that 1,401 of the quasar candidates have 2 Gaia objects associated with their PS position, whilst 26 of the candidates have 3 Gaia associations. Visual inspection of these 26 objects revealed one lens candidate, PS J06301201, shown in Fig. 1 with Gaia positions overlaid on the PS cutout, to be of interest. Its PS catalogue position, and PS and WISE photometry are listed in Table 1. The other objects with triple Gaia matches were ruled out as common contaminants, mainly single quasars with other objects nearby (that, despite being resolved in PS images, were not quasar candidates in our catalogue), as well as apparently faint interacting starbursting galaxies and likely duplicate entries in the Gaia catalogue (objects with separations of ).
| RA | 06h 30m 09.11s |
|---|---|
| DEC | 12d 01m 20.0s |
| 19.291 0.002 | |
| 18.566 0.002 | |
| 18.321 0.001 | |
| 17.949 0.001 | |
| 17.873 0.001 | |
| 16.886 0.027 | |
| 16.643 0.030 |
2.1 Spectroscopic Follow-up at the WHT
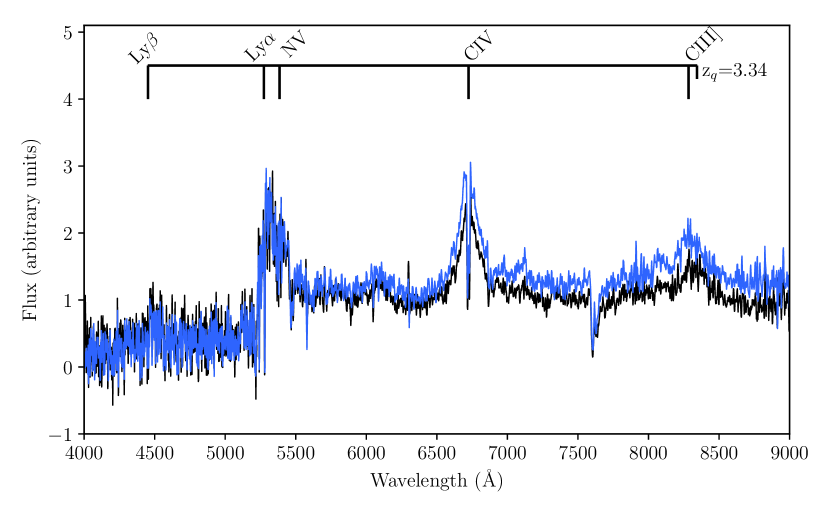
Spectroscopic follow-up observations to confirm that the multiple components are multiply-imaged quasars were performed with the dual-arm Intermediate dispersion Spectrograph and Imaging System (ISIS) on the William Herschel Telescope (WHT) on the night of April 01 2017 UT. The R300B grating was employed on the blue arm, providing wavelength coverage from Å to 5400Å with 4Å resolution, and the R158R grating on the red arm resulted in coverage from 5300Å to 10200Å with a resolution of 7.7Å; the 5300Å dichroic was used to split the beam to the blue and red arms. Two exposures of 600s each were obtained with a slit PA of 22.5 degrees, i.e., along the direction of the three brightest images, and two clearly separated traces were visible on the red arm, with the two southern-most images not deblended, whilst no clear separation was apparent in the blue data. Extractions of these traces are shown in Figure 2, revealing very similar spectra indicating a lensed quasar at . No features of a lower-redshift lensing galaxy are visible in the spectra.
2.2 Adaptive Optics Follow-up with Keck
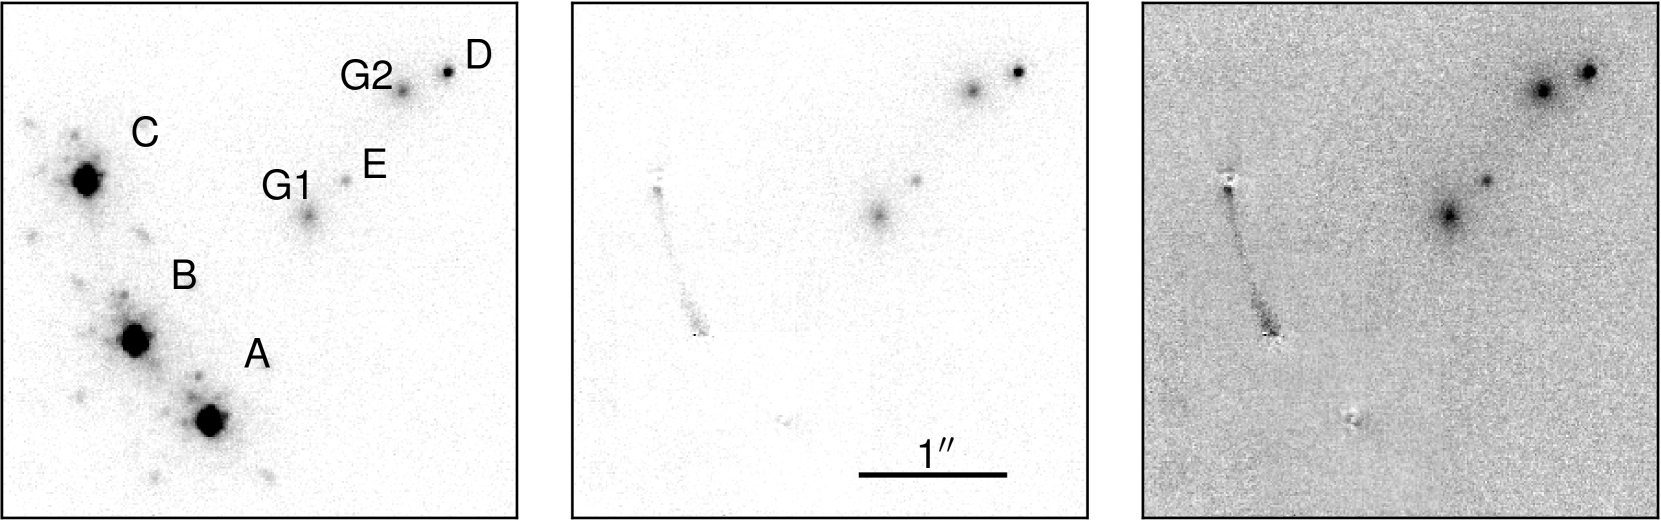
After the spectroscopic confirmation of multiple quasars, the system was observed on April 11 2017 UT with the NIRC2 camera mounted on Keck II, using Keck’s adaptive optics (AO) system. The NIRC2 narrow camera was used, giving a field of view and 10mas pixels, and four 180s exposures were obtained with the filter. These data clearly resolve the three quasars observed with WHT spectroscopy (A, B, and C in Figure 3), and also reveal two additional point-like objects (D and E) and two extended objects (G1 and G2). Note that most of the structure around the bright images is an artefact (“waffling”) due to AO correction problems with the low-bandwidth wavefront sensor.
The PSF of image C appears to have a structure extending down from the core of the PSF that is not seen in images A or B but could be consistent with a lensed arc. We therefore produced a pixellated model of the PSF around the images ABC to remove it and increase the dynamic range of the image. In the first iteration of this procedure an arc between images B and C was clearly visible, and we therefore re-fitted for the PSF excluding pixels that contain arc flux. The residuals of this fit are shown in the middle and right panels of Figure 3.
3 Lens Mass Modelling
The AO imaging data show that PS J06301201 is a lensed quasar in a ‘cusp’ configuration, with two lensing galaxies. The presence of a fifth point source, E in Figure 3, is intriguing as it is located approximately where the fifth (demagnified) image would be expected to appear. To understand the nature of E as a possible fifth quasar image, we initially create a mass model using the positions of the brighter quasar images (A to D) and the two lensing galaxies, and use this model to predict the location of any additional images. We first determine the position of each point source by modelling them with Gaussian or Moffat profiles, and we fit Sersic profiles to G1 and G2. We also perform moment-based centroiding in a range of apertures, and use the spread of all of our measurements to estimate the uncertainties on the positions; these are typically 1 mas for the point sources and 10 to 20 mas for the galaxies. However, we also find that the relative positions of the quasar images change from exposure to exposure, presumably due to atmospheric fluctuations, and we therefore impose a 5 mas minimum uncertainty on each position. We simultaneously fit the PS imaging data () whilst fitting the Keck data (), and our photometric and astrometric results are given in Table 2.
| A | 19.950.01 | 20.650.05 | 19.920.04 | 19.650.04 | 19.270.01 | 19.220.05 | 18.650.01 | 0.674 0.005 | 1.421 0.005 |
|---|---|---|---|---|---|---|---|---|---|
| B | 19.760.01 | 20.540.05 | 19.730.05 | 19.800.03 | 19.180.02 | 19.230.04 | 18.490.01 | 1.192 0.005 | 0.865 0.005 |
| C | 19.610.01 | 20.530.05 | 19.700.05 | 19.660.04 | 19.240.02 | 19.150.04 | 18.660.01 | 1.530 0.005 | 0.248 0.005 |
| D(+G2) | 23.030.16 | 21.800.05 | 21.590.04 | 21.320.04 | 20.850.03 | 21.300.01 | 0.966 0.005 | 0.994 0.005 | |
| E(+G1) | 23.330.34 | 23.160.14 | 21.930.09 | 21.830.09 | 21.600.09 | 22.760.01 | 0.257 0.005 | 0.241 0.005 | |
| G1 | 20.860.01 | 0.000 0.013 | 0.000 0.010 | ||||||
| G2 | 20.930.01 | 0.650 0.017 | 0.862 0.005 |
-
•
† Gaia DR1 catalogue -band photometry for components A,B, and C.
We use the positions of the galaxies and point sources to constrain a lensing mass model. The two galaxies are initially modelled as singular isothermal spheres and we use the positions of the four brighter images to infer their Einstein radii using the lensmodel software (Keeton, 2001). The best-fit lens model predicts a fifth image near the location of image E with a flux approximately half of image D, comparable to the observed flux ratio. We consequently use the position of E to constrain a more realistic lens model, allowing the two galaxies to have some ellipticity, and we include an external shear. This model has five free parameters for each galaxy (two position parameters, an Einstein radius, and an ellipticity with its orientation) and two additional parameters each for the position of the source and the external shear, i.e., there are 14 total parameters. We likewise have 14 constraints from the observed positions of the five quasar images and the two lensing galaxies.
Using image plane modelling, we sample the parameter space using emcee (Foreman-Mackey et al., 2013) and, as expected, find a best-fit model with . Both mass components are inferred to be coincident with the light, with Einstein radii for G1 and G2 of 1010.01 and 0580.01, respectively. Both masses are also mildly flattened, but we find that the light and mass orientations, given in Table 3, are misaligned, significantly so for G2. We also note that the shear is well constrained ( with PA ) and is particularly large, though there is no nearby galaxy along the shear direction. The total magnification for the system is 53.
| PA (light) | (light) | PA (mass) | (mass) | |
|---|---|---|---|---|
| G1 | 9 4 | 0.81 0.03 | 21 6 | 0.81 0.02 |
| G2 | 69 4 | 0.79 0.03 | 2 7 | 0.83 0.04 |
4 Discussion and conclusions
We have presented spectroscopic and imaging data that confirm that PS J06301201 is a quasar at lensed into five images by two lensing galaxies. We are able to fit the positions of the five images well with a two-SIE lens model and recover flux ratios to within 30% with discrepancies likely caused by microlensing and/or differential extinction and reddening, as evidenced by the strongly varying flux ratio between images B and C from optical to near-infrared wavelengths. However, we find that for both lenses the ellipticity of the mass is not consistent with the ellipticity of the galaxy light (Table 3) and the inferred shear is quite large. This could be the result of an additional mass component, e.g., a dark matter halo that is not coincident with either galaxy (e.g., Shu et al., 2016). In that case, the weak demagnification of the fifth image might indicate that the dark matter halo is not cuspy (e.g., Collett et al., 2017), although constraints from the quasar image positions alone are not sufficient to test this. Deeper imaging of the arc of the lensed host galaxy and observations at radio wavelengths, where extinction and the effects of microlensing are no longer important, will help to constrain a more complex model for the mass distribution.
The relatively bright fifth image of PS J06301201 also presents the possibility of obtaining four new time delay measurements, for a total of ten time delays. Based upon our current best lens model, these delays should range between 1 and 245 days assuming that the lens redshifts are (Table 4). Because of the overall compactness of the system and the presence of the two lensing galaxies, it would be difficult to obtain time delays from the fifth image with conventional seeing-limited monitoring programmes. However, if such a campaign observed a sudden brightening (or dimming) event in one of the brighter images, dedicated monitoring with a high-resolution facility (e.g., Robo-AO; Baranec et al., 2014) could yield an observation of the delayed brightening of the fifth image.
Several other lensed quasars have been observed to have bright additional images, and these systems typically also have multiple lensing galaxies (with the exception being the radio-loud double PMN J1632-0033, which has an observed highly de-magnified central image Winn et al., 2004). The cluster lens SDSS J1004+4112 (Inada et al., 2005) is a quad with an observed ‘central’ image, but the the complexity of the mass distribution makes it very difficult to estimate time delays (Fohlmeister et al., 2007). PMN J0134-0931 is a radio-loud quasar that is being lensed into five images by two galaxies (Winn et al., 2003). However, the image separations are very small so measuring time delays – expected to range from an hour to two weeks (Keeton & Winn, 2003) – will be extremely difficult. B1359+154 (Rusin et al., 2001) and SDSS J2222+2745 (Dahle et al., 2013) are six-image lens systems, and in both cases the lens is a compact group of three galaxies. These lenses have intrinsically more complex mass distributions, but time delays may still be informative for cosmography. However, most of the independent time delays are expected to be less than a day for B1359+154 (Rusin et al., 2001) and quite long (400 to 700 days) for SDSS J2222+2745 (Sharon et al., 2017). PS J06301201 therefore appears to be the most promising lens for measuring additional independent time delays.
| A | B | C | D | E | |
|---|---|---|---|---|---|
| A | 0.9 | 1.8 | 243 | 208 | |
| B | 0.4 | 2.7 | 242 | 207 | |
| C | 0.7 | 1.1 | 245 | 210 | |
| D | 97.8 | 97.4 | 98.5 | 35 | |
| E | 83.7 | 83.3 | 84.4 | 14.1 |
Acknowledgements
We are grateful to the STRIDES collaboration for many useful discussions about quasar lens finding. FO, CAL, RGM, and SLR acknowledge the support of the UK Science and Technology research Council (STFC), and MWA also acknowledges STFC support in the form of an Ernest Rutherford Fellowship. FO acknowledges the current support of the Conselho Nacional de Desenvolvimento Científico e Tecnológico (CNPq - grant number 150151/2017-9) and was supported jointly by CAPES (the Science without Borders programme) and the Cambridge Commonwealth Trust during part of this research. CDF and CER acknowledge support from the US National Science Foundation through grant number AST-1312329.
The Pan-STARRS1 Surveys (PS1) and the PS1 public science archive have been made possible through contributions by the Institute for Astronomy, the University of Hawaii, the Pan-STARRS Project Office, the Max-Planck Society and its participating institutes, the Max Planck Institute for Astronomy, Heidelberg and the Max Planck Institute for Extraterrestrial Physics, Garching, The Johns Hopkins University, Durham University, the University of Edinburgh, the Queen’s University Belfast, the Harvard-Smithsonian Center for Astrophysics, the Las Cumbres Observatory Global Telescope Network Incorporated, the National Central University of Taiwan, the Space Telescope Science Institute, the National Aeronautics and Space Administration under Grant No. NNX08AR22G issued through the Planetary Science Division of the NASA Science Mission Directorate, the National Science Foundation Grant No. AST-1238877, the University of Maryland, Eotvos Lorand University (ELTE), the Los Alamos National Laboratory, and the Gordon and Betty Moore Foundation.
This publication makes use of data products from the Wide-field Infrared Survey Explorer, which is a joint project of the University of California, Los Angeles, and the Jet Propulsion Laboratory/California Institute of Technology, funded by the National Aeronautics and Space Administration.
This work has made use of data from the European Space Agency (ESA) mission Gaia (https://www.cosmos.esa.int/gaia), processed by the Gaia Data Processing and Analysis Consortium (DPAC, https://www.cosmos.esa.int/web/gaia/dpac/consortium). Funding for the DPAC has been provided by national institutions, in particular the institutions participating in the Gaia Multilateral Agreement.
The William Herschel Telescope is operated on the island of La Palma by the Isaac Newton Group of Telescopes in the Spanish Observatorio del Roque de los Muchachos of the Instituto de Astrofísica de Canarias.
Some of the data presented herein were obtained at the W.M. Keck Observatory, which is operated as a scientific partnership among the California Institute of Technology, the University of California and the National Aeronautics and Space Administration. The Observatory was made possible by the generous financial support of the W.M. Keck Foundation. The authors wish to recognize and acknowledge the very significant cultural role and reverence that the summit of Mauna Kea has always had within the indigenous Hawaiian community. We are most fortunate to have the opportunity to conduct observations from this mountain.
This research made use of Astropy, a community-developed core Python package for Astronomy (Astropy Collaboration, 2013).
References
- Baranec et al. (2014) Baranec C., et al., 2014, ApJ, 790, L8
- Birrer et al. (2017) Birrer S., Amara A., Refregier A., 2017, J. Cosmology Astropart. Phys., 5, 037
- Chambers et al. (2016) Chambers K. C., et al., 2016, preprint, (arXiv:1612.05560)
- Claeskens et al. (2006) Claeskens J.-F., Sluse D., Riaud P., Surdej J., 2006, A&A, 451, 865
- Collett et al. (2017) Collett T. E., et al., 2017, ApJ, 843, 148
- DES Collaboration (2005) DES Collaboration 2005, preprint, (arXiv:astro-ph/0510346)
- DES Collaboration et al. (2016) DES Collaboration et al., 2016, MNRAS,
- Dahle et al. (2013) Dahle H., et al., 2013, ApJ, 773, 146
- Ding et al. (2017) Ding X., et al., 2017, preprint, (arXiv:1703.02041)
- Fohlmeister et al. (2007) Fohlmeister J., et al., 2007, ApJ, 662, 62
- Foreman-Mackey et al. (2013) Foreman-Mackey D., Hogg D. W., Lang D., Goodman J., 2013, PASP, 125, 306
- Gaia Collaboration et al. (2016a) Gaia Collaboration et al., 2016a, A&A, 595, A1
- Gaia Collaboration et al. (2016b) Gaia Collaboration et al., 2016b, A&A, 595, A2
- Inada et al. (2005) Inada N., et al., 2005, PASJ, 57, L7
- Jackson (2013) Jackson N., 2013, Bulletin of the Astronomical Society of India, 41, 19
- Jarrett et al. (2011) Jarrett T. H., et al., 2011, ApJ, 735, 112
- Keeton (2001) Keeton C. R., 2001, preprint, (arXiv:astro-ph/0102340)
- Keeton & Winn (2003) Keeton C. R., Winn J. N., 2003, ApJ, 590, 39
- Kochanek (2004) Kochanek C. S., 2004, ApJ, 605, 58
- Kochanek & Dalal (2004) Kochanek C. S., Dalal N., 2004, ApJ, 610, 69
- Kochanek et al. (2001) Kochanek C. S., Keeton C. R., McLeod B. A., 2001, ApJ, 547, 50
- Lemon et al. (2017) Lemon C. A., Auger M. W., McMahon R. G., Koposov S. E., 2017, preprint, (arXiv:1709.08976)
- Lindegren et al. (2016) Lindegren L., et al., 2016, preprint, (arXiv:1609.04303)
- Metcalf & Madau (2001) Metcalf R. B., Madau P., 2001, ApJ, 563, 9
- Morgan et al. (2010) Morgan C. W., Kochanek C. S., Morgan N. D., Falco E. E., 2010, ApJ, 712, 1129
- Motta et al. (2012) Motta V., Mediavilla E., Falco E., Muñoz J. A., 2012, ApJ, 755, 82
- Nierenberg et al. (2014) Nierenberg A. M., Treu T., Wright S. A., Fassnacht C. D., Auger M. W., 2014, MNRAS, 442, 2434
- Ostrovski et al. (2017) Ostrovski F., et al., 2017, MNRAS, 465, 4325
- Peng et al. (2006) Peng C. Y., Impey C. D., Rix H.-W., Kochanek C. S., Keeton C. R., Falco E. E., Lehár J., McLeod B. A., 2006, ApJ, 649, 616
- Poindexter et al. (2008) Poindexter S., Morgan N., Kochanek C. S., 2008, ApJ, 673, 34
- Reynolds et al. (2014) Reynolds M. T., Walton D. J., Miller J. M., Reis R. C., 2014, ApJl, 792, L19
- Rusin et al. (2001) Rusin D., et al., 2001, ApJ, 557, 594
- Sharon et al. (2017) Sharon K., et al., 2017, ApJ, 835, 5
- Shu et al. (2016) Shu Y., Bolton A. S., Moustakas L. A., Stern D., Dey A., Brownstein J. R., Burles S., Spinrad H., 2016, ApJ, 820, 43
- Suyu et al. (2010) Suyu S. H., Marshall P. J., Auger M. W., Hilbert S., Blandford R. D., Koopmans L. V. E., Fassnacht C. D., Treu T., 2010, ApJ, 711, 201
- Suyu et al. (2013) Suyu S. H., et al., 2013, ApJ, 766, 70
- Treu (2010) Treu T., 2010, ARA&A, 48, 87
- Vegetti et al. (2014) Vegetti S., Koopmans L. V. E., Auger M. W., Treu T., Bolton A. S., 2014, MNRAS, 442, 2017
- Winn et al. (2003) Winn J. N., Kochanek C. S., Keeton C. R., Lovell J. E. J., 2003, ApJ, 590, 26
- Winn et al. (2004) Winn J. N., Rusin D., Kochanek C. S., 2004, Nature, 427, 613
- Wright et al. (2010) Wright E. L., et al., 2010, AJ, 140, 1868