Synchronous Detection of Longitudinal and Transverse Bunch Signals at a Storage Ring
Abstract
To understand and control dynamics in the longitudinal phase space, time-resolved measurements of different bunch parameters are required. For a reconstruction of this phase space, the detector systems have to be synchronized. This reconstruction can be used for example for studies of the micro-bunching instability which occurs if the interaction of the bunch with its own radiation leads to the formation of sub-structures on the longitudinal bunch profile. These sub-structures can grow rapidly – leading to a sawtooth-like behaviour of the bunch. At KARA, we use a fast-gated intensified camera for energy spread studies, Schottky diodes for coherent synchrotron radiation studies as well as electro-optical spectral decoding for longitudinal bunch profile measurements. For a synchronization, a synchronization scheme is used which compensates for hardware delays. In this paper, the different experimental setups and their synchronization are discussed and first results of synchronous measurements presented.
pacs:
Valid PACS appear hereI Introduction
The investigation of the dynamics of short bunches in a storage ring sets stringent requirements for the diagnostics: Response time and repetition rate of the different detector systems must be sufficient to study a single bunch in a multi-bunch environment on a single-turn basis. The required time scales are given by the RF frequency and the revolution time. In addition, the different detector systems must be synchronized to study simultaneous changes for example in the bunch shape and in the emitted synchrotron radiation.
II Micro-bunching instability
Under certain conditions, periodic bursts of coherent synchrotron radiation (CSR) were recorded at different facilities (e.g. NSLS VUV Carr et al. (2001), SURF II Arp et al. (2001), ALS Byrd et al. (2002), BESSY-II Abo-Bakr et al. (2003), Diamond Shields et al. (2012), SOLEIL Evain et al. (2012)). Theoretical studies of this phenomena gave hints to a self-interaction of the bunch with its own wake-field Stupakov and Heifets (2002), which can lead to the occurrence of sub-structures in the longitudinal phase space. The rising amplitude of these sub-structures can be explained by the CSR impedance Venturini and Warnock (2002). The rapid increase of the amplitude is coupled to an overall increase in projected bunch size. At one point, diffusion and radiation damping outweigh the growth of the sub-structures and they start to dissolve and damp down, leading to a reduction of the bunch size. The reduced bunch size leads again to a stronger wake-field and subsequently the next CSR instability cycle starts over. Thus, the bunch size is modulated with a repetitive sawtooth pattern in time Warnock (2006). Due to the changing bunch profile, the CSR is emitted in bursts and the behavior is referred to as bursting.
As the longitudinal phase space is spanned by time and energy, it can be studied by time-resolved measurements of the longitudinal bunch profile and energy spread. The CSR intensity depends on the longitudinal bunch profile, so it can also be used to probe the dynamics. A monitoring of the longitudinal phase space leads to a deeper understanding of the beam dynamics, especially above the bursting threshold and could potentially lead to methods for control. Such a reconstruction requires synchronous measurements of the different bunch properties.
At KARA, we use different diagnostics tools for theses measurements which are integrated in a hardware synchronization system to enable simultaneous data acquisition.
III KARA
KARA (Karlsruhe Research Accelerator), the 2.5 GeV KIT storage ring, can be operated in different modes including a short bunch mode. In this mode, the momentum-compaction factor is lowered by changing the magnet optics Müller et al. (2012) to study the micro-bunching instability Brosi et al. (2016); Steinmann et al. (2017).
At KARA, the revolution time is 368 ns and the bunch spacing of 2 ns is defined by the radio frequency (RF) of 500 MHz. One single measurement should take at most 2 ns, so that only the signal of one bunch is detected. As part of the bunch detection setup, several systems have been installed and commissioned: A fast-gated intensified camera (FGC) to measure the horizontal bunch position and size, fast THz detectors to detect the coherent synchrotron radiation (CSR) as well as an electro-optical bunch profile monitor to determine the longitudinal bunch profile Fisher et al. (2006); Hübers et al. (2005); Wilke et al. (2002).
IV Horizontal bunch size measurements
Measurements of the horizontal bunch size allow studies of the energy spread as they are related by Wiedemann (2007)
in a dispersive section. Therefore, a time-resolved measurement of the horizontal bunch size reveals changes in energy spread. We use a fast-gated intensified camera (FGC). It is located at the Visible Light Diagnostics (VLD) port at KARA which uses incoherent bending radiation from a 5∘ port of a dipole magnet Kehrer et al. (2015). The FGC setup consists of a camera and a fast-rotating mirror which sweeps the incoming light over the entrance aperture of the FGC during the image acquisition. In combination with a fast switching of the image intensifier, this allows single turn images of a bunch, even in a multi-bunch fill Schütze et al. (2015); Schütze (2017). The resolution of the setup is confined by a rectangular crotch absorber with a horizontal width of 20 mm which is located 1600 mm downstream of the radiation source point Hiller et al. (2011). Taking diffraction effects into account, the resolution is estimated to be 77 m using a wavelength of 400 nm (Hofmann and Méot, 1982, Eq. 30).
Fig. 1 shows a raw image recorded with the FGC.
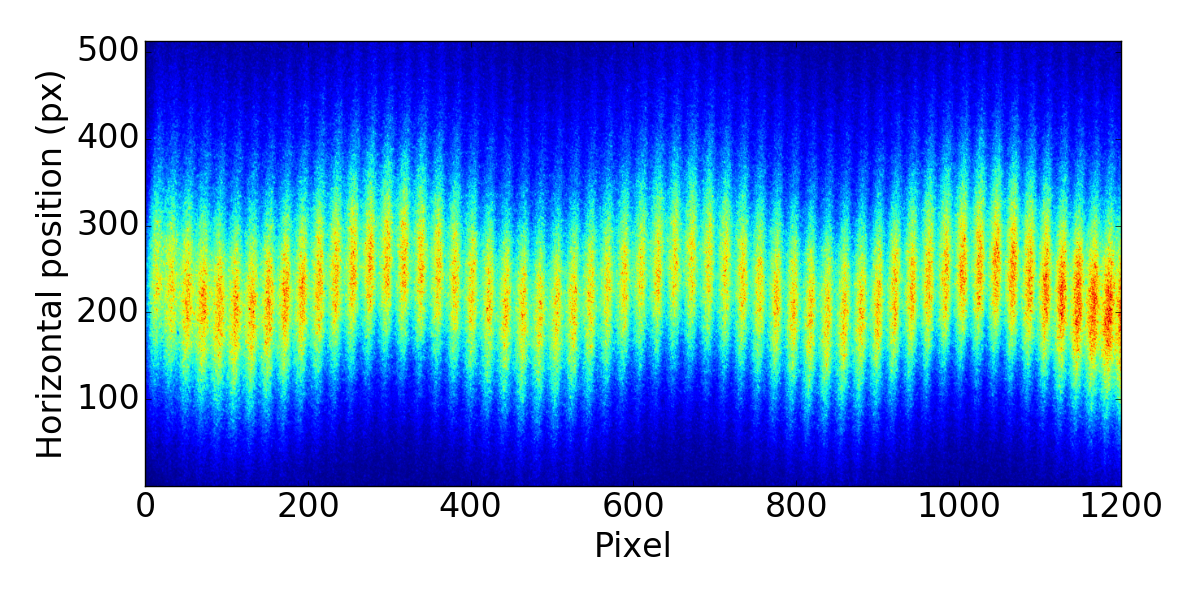
Here, the machine was operated without an active feedback system, therefore the bunch is undergoing a synchrotron oscillation ( 11.24 kHz). The individual spots on this image are the convolution of the charge distribution with the so-called filament beam spread function (FBSF). The FBSF can be seen as an extension of the point spread function for a moving point-like source, in this case a moving single electron Andersson et al. (2006). We use the software OpTalix 111OpTalix Pro 8.82, www.optenso.com to simulate the optical system and the imaging process. Instead of deconvolving the FBSF from the data and fitting a Gaussian curve, we fit a convolution of the FBSF with a Gaussian curve. Compared to the deconvolution this has the advantage that no estimation of the signal-to-noise ratio is required, in addition, this method is fast and robust. For one spot of an FGC raw image, this analysis is illustrated in Fig. 2.
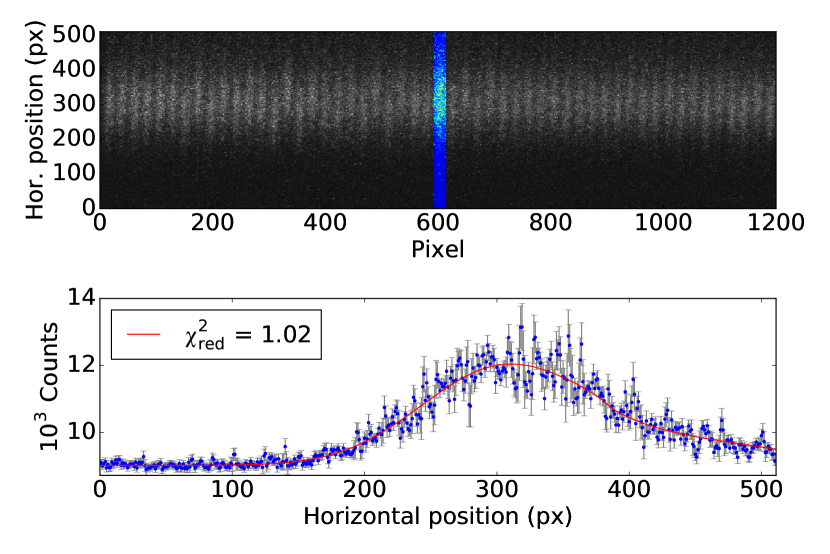
It can be seen that the fit reproduces the distorted shape of the profile very well, enabling a determination of the horizontal bunch size with single turn resolution.
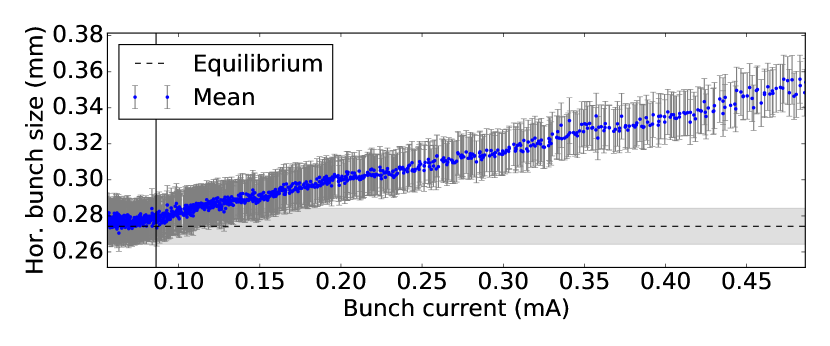
Experimental studies showed that the horizontal bunch size remains constant below the bursting threshold, while it starts to increase for currents above the threshold Bane et al. (2005). For the equilibrium case below the bursting threshold, the measured bunch size is in good agreement with simulated values using the accelerator toolbox for Matlab (AT) Nash et al. (2015) and the lattice model of KARA, see Fig. 3. For the AT model, LOCO fits Safranek et al. (2009) are used to determine the quadrupole strengths from measurements of the orbit response matrix and the dispersion.
A quantitative determination of the energy spread is not possible due to the unknown contribution of the horizontal emittance to the horizontal bunch size, therefore we are limited to qualitative studies with the horizontal bunch size taken as a measure for the energy spread. Besides the studies of the micro-bunching instability, the system can be used to study different kinds of instabilities, e.g. during the injection or on the energy ramp.
V Coherent synchrotron radiation
The investigation of the CSR dynamics includes THz detectors that are fast enough to resolve the emitted synchrotron radiation for each bunch in a multi-bunch environment. We use commercially available room temperature zero-bias Schottky diode detectors with different sensitivity ranges Brosi et al. (2016); Steinmann et al. (2017). To read out these detectors we use the data acquisition (DAQ) system KAPTURE Caselle et al. (2014, 2017a). KAPTURE is a fast FPGA-based system with four input channels that can be used to sample the signal of one detector with four sample points per bunch and turn. Alternatively, it is possible to sample up to four detectors in parallel with a bunch-by-bunch sampling rate of 500 MHz. For the measurements presented here, we configured KAPTURE to digitize the peak intensity of multiple different detectors simultaneously.
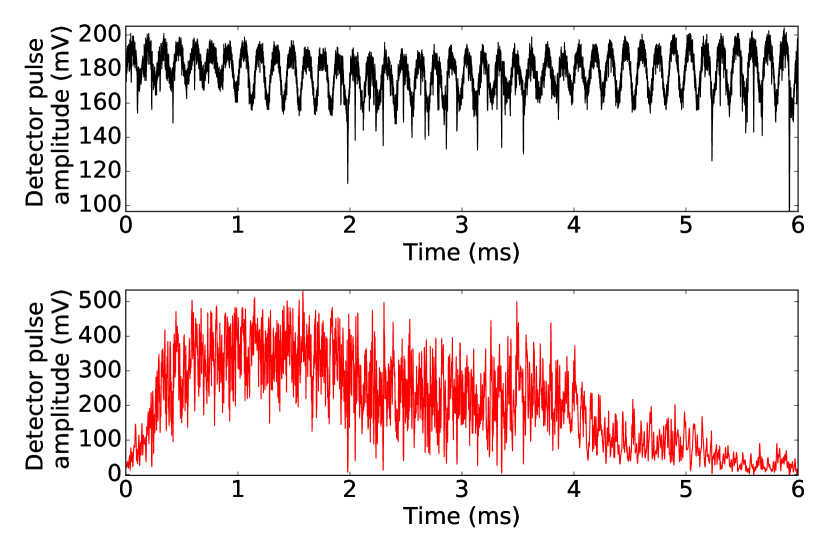
Figure 4 illustrates this multi-detector operation mode. It shows the signals recorded by an avalanche photo diode (APD) sensitive to incoherent synchrotron radiation in the visible range and a Schottky diode sensitive in the THz range. The APD is insensitive to arrival time oscillations caused by synchrotron oscillation, as the duration of the APD pulse is longer than the amplitude of the synchrotron oscillation and KAPTURE samples at a fixed phase relative to the RF. Thus, the observed oscillation of the APD signal is due to an intensity fluctuation. The bunch oscillates horizontally around the focal point of the optics and the limited aperture of the beam line optics transfers this into an intensity oscillation. This signal will play a vital role for the calibration of the synchronization in Sec. VII.
The combination of KAPTURE and Schottky diodes is used for detailed and systematic studies of the CSR emission during the micro-bunching instability. The analysis of the fluctuation of the CSR intensity allows for example a fast and precise mapping of the bursting threshold Brosi et al. (2016). Using four Schottky diodes with different frequency bands we can configure the KAPTURE system into a bunch-by-bunch spectrometer for CSR studies Steinmann et al. (2017).
VI Longitudinal bunch profile
The technique of electro-optical spectral decoding (EOSD) Jiang and Zhang (1998) is used to determine the longitudinal bunch profile and arrival time Roussel et al. (2016). This is done by inserting an electro-optical crystal into the vacuum pipe to sample the electric near-field of the bunch Hiller et al. (2014). This field turns the crystal birefringent. A laser pulse, chirped on the ps-time scale, is directed through the crystal and the induced birefringence turns the initial linear polarization into an elliptical. Thus the bunch profile is imprinted into the polarization of the laser pulse. A crossed polarizer transfers this into an intensity modulation and, due to the unique, ideally linear, correlation between time and wavelength in the chirped laser pulse, the bunch profile can be determined by recording the modulated laser pulse spectrum. Measuring in the near field has the advantage that there is no frequency cut-off of the electric field by the beam-line.
The spectrometer used for this measurement is based on the KALYPSO system (KArlsruhe Linear arraY detector for MHz-rePetition rate SpectrOscopy Rota et al. (2016); Caselle et al. (2017b)). KALYPSO consists of a 256-pixel line array that can be read out with a turn-by-turn frame rate of 2.7 MHz.
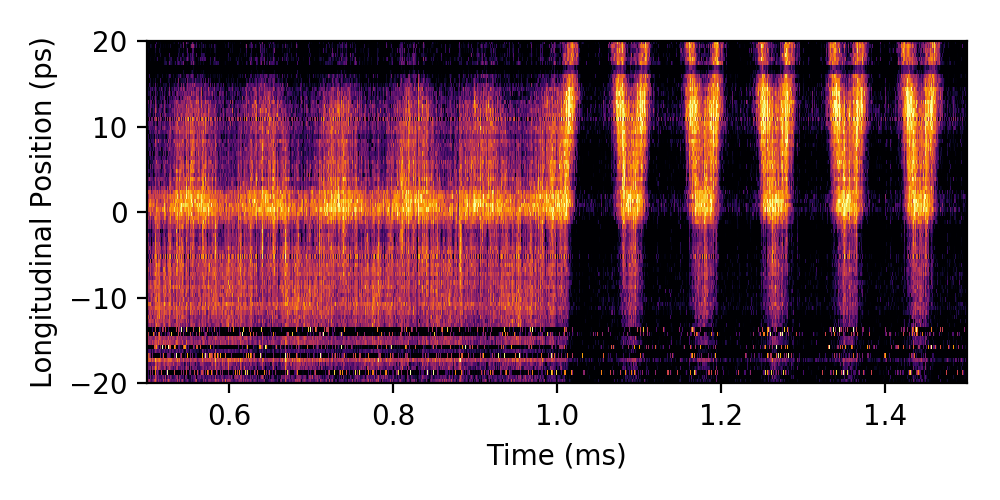
An example recorded by this system is shown in Fig. 5. It shows color-coded longitudinal bunch profiles (in units of ps) as a function of time. These measurements were taken with an early development version of the KALYPSO system, which manifests in pixel errors and other artifacts. They are visible for example as dark horizontal lines between -10 and -20 ps. At the beginning, the bunch is undergoing a synchrotron oscillation as also here the feedback system was switched off. At 1 ms, this oscillation abruptly changes its amplitude due to a triggered step in the RF phase at this point in time. For these measurements, the EO system was adjusted such that the phase step has the maximum possible effect on the signal. So, the bunch shape is not reproduced optimally. Instead, the frequency of the forced synchrotron oscillation after the RF phase step can be seen clearly. This enables to take the system into account for the detector synchronization.
Generally, the EOSD system can also be set up to allow measurements of the bunch profile with a sub-ps resolution, that allows to resolve sub-structures on the longitudinal bunch profile Funkner et al. . By using KALYPSO this setup allows turn-by-turn measurements (Rota et al., 2016, Fig. 3).
VII Detector synchronization
A straight forward way to measure synchronously the different bunch parameters is to feed the signals from the different detectors into one common DAQ system, e.g. an oscilloscope. This is suitable if all devices are located close to each other at a storage ring with compact design (e.g. Arp et al. (2001)). In our case, this is not directly possible for several reasons. The first point is the location of the detector systems at different positions around the storage ring. In addition, at these systems dedicated post-processing of the raw-data is required. The FGC and the EOSD setup delivers 2D images while the KAPTURE system provides – in the multi-detector mode – one data point per bunch, turn, and detector. The acquisition has to be aligned temporally to enable correlation studies between derived parameters like CSR intensity, energy spread and bunch length.
To provide a common origin for the time axis with single-turn resolution, we need to synchronize the acquisition. The timing system Hofmann et al. (2010) – based on one event generator (EVG) and several event receivers (EVR) – is used to generate a synchronized measurement trigger.
Furthermore, the intrinsic hardware delays have to be taken into account. KAPTURE and KALYPSO sample continuously, independent of the coupled detectors. The acquisition trigger starts the data storage into memory and therefore an instantaneous synchronization of the recording is achieved.
For the FGC this is different: Due to the measurement controls and the inertia of the rotating mirror, a certain advance time is needed before the first sample can be recorded. To protect the sensor from overexposure, the rotating mirror has a hold position in which the light is not on the sensor. Thus the light spot has to be driven first onto the sensor to be recorded. This also ensures the measurement is taken in the regime of linear mirror motion. The synchronization schemes takes these delays into account and compensates for them by triggering the FGC the required time before other devices (see (Kehrer et al., 2016, Fig. 2)).
The test of the synchronization requires a signal with a signature on the longitudinal and horizontal plane of the beam that all detectors are sensitive to. We used the low-level RF (LLRF) system to trigger a step in the RF phase. This sudden change leads to the onset of a synchrotron oscillation around the new longitudinal equilibrium, which all different measurement stations are sensitive to. For the calibration of KAPTURE, we used the visible light APD as a reference. This convenient reference is insensitive to fluctuations on the bunch profile that can occur following a sudden RF phase-step, which can affect the CSR signal recorded by Schottky detectors.
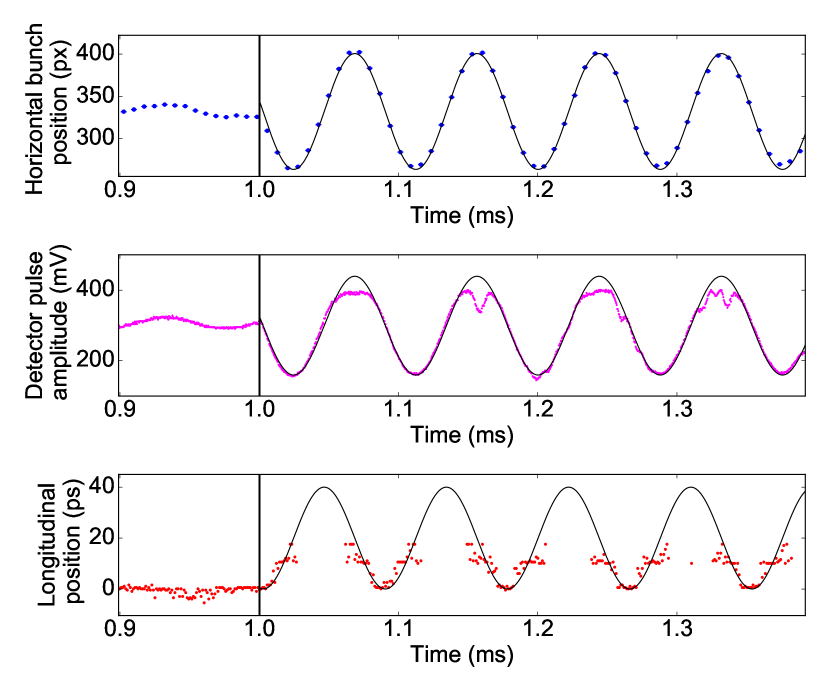
Figure 6 shows a successful synchronization event. The onset of the synchrotron oscillation is recorded by all detectors at the same time. While the synchrotron oscillation on the FGC and the APD are in phase and both in the horizontal plane, the one from KALYPSO is phase-shifted by . This can be explained by the dynamics in longitudinal phase space. Here, the synchrotron oscillation corresponds to a rotation of the longitudinal electron phase space density. The projection onto the position and energy axes are separated by . The FGC and the APD are sensitive to the energy because their source points are located in dispersive sections. KALYPSO, in contrast, measures the arrival time.
The APD signal recorded with KAPTURE shows voltage dips at the highest values and maximum bunch deflection. The origin of the dips are unclear, but are likely due to intensity cut-off from the finite aperture of the optical beam path or jumps in the timing trigger as KAPTURE samples at a fixed phase. Nevertheless, the main feature, a strong synchrotron oscillation, can be seen and used to determine the phase and the frequency of the electron beam motion.
As discussed before, the EOSD setup was optimized for temporal resolution. Due to the finite size of the line array and the length of the chirped laser pulse, this leads to a cut-off of the upper part of the signal showing the longitudinal bunch position.
VIII Synchronous measurements
Synchronization of the detector systems allows time-resolved studies of the beam dynamics. In the following, we limit our studies to energy spread and the CSR emission during the micro-bunching instability.
Figures 7 and 8 show two synchronous measurements of the horizontal bunch for the energy spread (top) and the corresponding CSR emission (bottom) recorded with a broadband Schottky diode detector (50 GHz - 2 THz). In both cases, the two curves have the same modulation period. This behaviour was predicted by simulations Warnock (2006) and also observed experimentally at SURF III Arp et al. (2001).
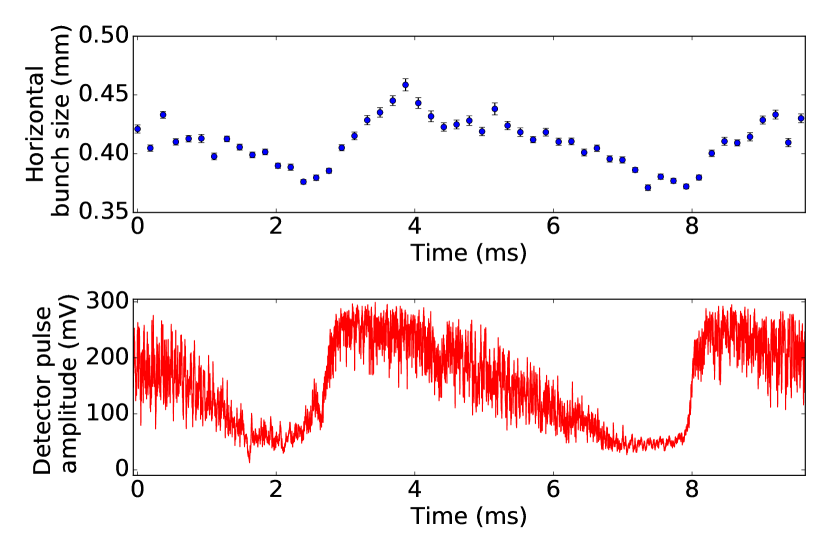
Beam parameter: : 8.1 kHz, : 1500 kV, : 0.88 mA
In Fig. 7, the CSR intensity decreases until it reaches a constant level between two bursts. After the blow-up at the onset of a burst, the energy spread decreases until it reaches the same lower limit where it is blown-up again. At the same time, the CSR burst starts to arise.
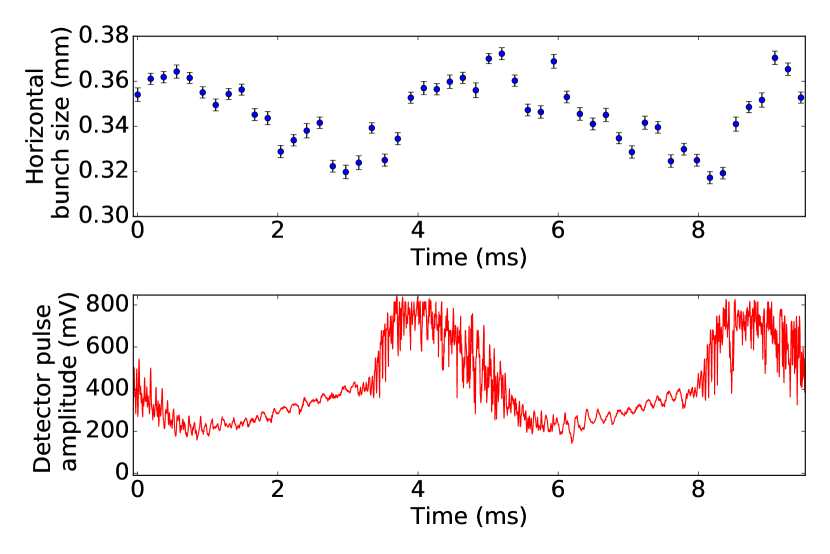
Beam parameter: : 6.7 kHz, : 1500 kV, : 0.25 mA.
Fig. 8 shows a different case using different machine settings and a lower bunch current. Here, the CSR intensity is not constant between two bursts, but increases slightly while the energy spread is still decreasing. This can be explained by the coupling of bunch length and energy spread in the longitudinal phase space. If the bunch gets shorter, it emits more CSR – regardless of sub-structures. The sensitivity to these bunch length fluctuations is dependent on the frequency band of the detector and possible shielding of the CSR due to apertures in the beam line. Thus, we do not observe it for longer bunches.
For both cases, the bunch contracts until an instability threshold is reached. At this point, the charge density inside the bunch is high enough and the bunch becomes unstable. Numerical simulations of the longitudinal phase space using the Vlasov-Fokker-Planck solver Inovesa Schönfeldt et al. (2017) showed, that at this point the amplitude of the sub-structures starts to grow rapidly Boltz (2017).
To study these effects in more detail, the FGC can be configured to record shorter time ranges with a higher temporal resolution. For the third example discussed here, the gate separation was set to 24 turns and a time range of 500 was recorded. In this case an additional narrow-band Schottky diode was used synchronously. The result is illustrated in Fig. 9. At the beginning, the energy spread given by the horizontal bunch size (top panel) is slightly decreasing due to damping effects while the CSR intensity on the broadband Schottky diode is constant, for the narrow-band diode it is almost zero. Around t = 0.1 ms, the first changes can be seen when the CSR intensity on the broadband Schottky diode starts to increase, while for the narrow-band this increase starts approximately 0.1 ms later. The earlier increase of the signal on the broadband Schottky diode is due to its lower limit in the frequency sensitivity Steinmann et al. (2017).
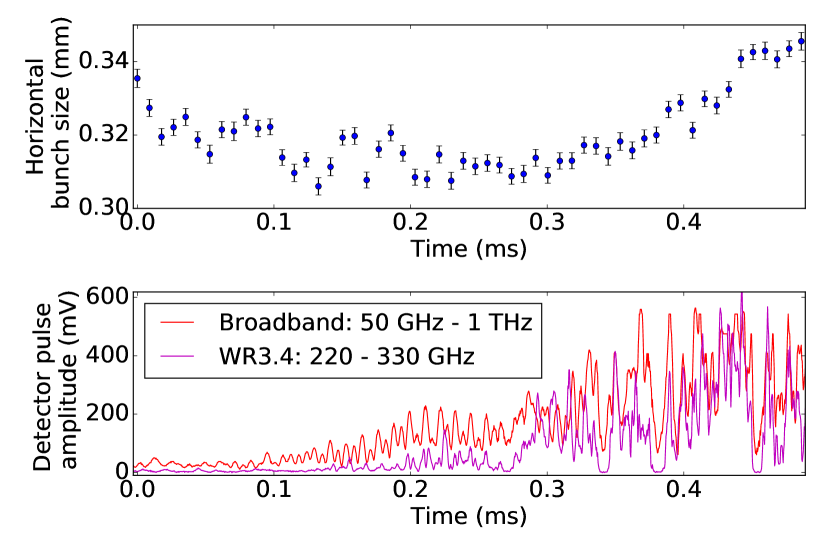
Beam parameter: : 13.4 kHz, : 1500 kV, : 1.57 mA
While the CSR intensity starts to increase, the energy spread is still decreasing due to damping effects. At 0.27 ms, it reaches a lower limit triggering the onset of another burst.
These examples clearly illustrate the diagnostic capability of synchronized detector systems. It allows to fully exploit the potential of the different, synchronous systems. While with KAPTURE in the multi-detector mode it is possible to study phase differences between the different frequency bands of the CSR Steinmann et al. (2017), these phase studies can now be extended to take multiple detector systems into account.
IX Summary
The analysis of fast rising instabilities, like the micro-bunching instability, benefits from turn-by-turn detector systems. To resolve complimentary features in 6-D phase space, several detector systems which observe different bunch parameters need to be synchronized. At KARA, several independent detector systems with a single-turn resolution are combined in a distributed sensor network. The energy spread is investigated using an FGC, while the CSR intensity is measured using a KAPTURE system and Schottky diodes. For studies of the longitudinal bunch profile an EOSD setup is used in the near-field combined with KALYPSO. The integration of these systems into a hardware synchronization scheme opens up new diagnostics opportunities. While the individual setups allowed an insight into the dynamics of the micro-bunching instability, successful synchronization is a first step towards a multi-dimensional analysis of the longitudinal phase space. We experimentally showed that the energy spread and the CSR undergo a modulation with the same period length. In addition, detailed studies revealed a certain phase difference between the CSR in different frequency ranges and energy spread.
In the future we will improve and upgrade the individual detector systems while keeping the capability for synchronized recording. A fast line array optimized for the visible frequency range will be combined with KALYPSO and replace the FGC setup. This will allows us to continuously stream horizontal bunch profiles at each revolution. It will also be used at the EOSD setup with a line array, optimized for the laser frequency and improving the signal-to-noise ratio. Further, the next version of KALYPSO will support a streaming rate of up to 10 Mfps and up to 2048 pixels Caselle et al. (2017b). A new version of KAPTURE, KAPTURE2 will provide 8 simultaneous readout paths, allowing more accurate peak reconstruction and the measurement of the arrival time Caselle et al. (2017a). Alternatively, the amplitudes of up to 8 different detectors can be recorded. With narrow-band detectors, sensitive in different frequency ranges, this allows recording single-shot spectra Steinmann et al. (2017).
X Acknowledgements
We would like to thank Anton Plech, Yves-Laurent Mathis and Michael Süpfle for their support. This work has been supported by the Initiative and Networking Fund of the Helmholtz Association under contract number VH-NG-320 and by the BMBF under contract numbers 05K10VKC and 05K13VKA. Miriam Brosi, Patrik Schönfeldt and Johannes Steinmann acknowledge the support of the Helmholtz International Research School for Teratronics (HIRST) and Edmund Blomley the support of the Karlsruhe School of Elementary Particle and Astroparticle Physics (KSETA).
References
- Carr et al. (2001) G. Carr, S. Kramer, J. Murphy, R. Lobo, and D. Tanner, Nuclear Instruments and Methods in Physics Research Section A: Accelerators, Spectrometers, Detectors and Associated Equipment 463, 387 (2001).
- Arp et al. (2001) U. Arp, G. T. Fraser, A. R. Hight Walker, T. B. Lucatorto, K. K. Lehmann, K. Harkay, N. Sereno, and K.-J. Kim, Phys. Rev. ST Accel. Beams 4, 054401 (2001).
- Byrd et al. (2002) J. M. Byrd, W. P. Leemans, A. Loftsdottir, B. Marcelis, M. C. Martin, W. R. McKinney, F. Sannibale, T. Scarvie, and C. Steier, Phys. Rev. Lett. 89, 224801 (2002).
- Abo-Bakr et al. (2003) M. Abo-Bakr, J. Feikes, K. Holldack, P. Kuske, and G. Wüstefeld, in Proceedings of PAC’03, Vol. 5 (IEEE, 2003) pp. 3023–3025.
- Shields et al. (2012) W. Shields, R. Bartolini, G. Boorman, P. Karataev, A. Lyapin, J. Puntree, and G. Rehm, Journal of Physics: Conference Series 357, 012037 (2012).
- Evain et al. (2012) C. Evain, J. Barros, A. Loulergue, M. A. Tordeux, R. Nagaoka, M. Labat, L. Cassinari, G. Creff, L. Manceron, J. B. Brubach, P. Roy, and M. E. Couprie, EPL (Europhysics Letters) 98, 40006 (2012).
- Stupakov and Heifets (2002) G. Stupakov and S. Heifets, Phys. Rev. ST Accel. Beams 5, 054402 (2002).
- Venturini and Warnock (2002) M. Venturini and R. Warnock, Phys. Rev. Lett. 89, 224802 (2002).
- Warnock (2006) R. Warnock, Workshop on High Intensity Beam Dynamics (Coulomb’05) Senigallia, Italy, September 12-16, 2005, Nucl. Instrum. Meth. A561, 186 (2006).
- Müller et al. (2012) A.-S. Müller, N. Hiller, H. A., E. Huttel, K. Il’in, V. Judin, B. Kehrer, M. Klein, S. Marsching, C. Meuter, S. Naknaimueang, M. Nasse, A. Plech, P. Probst, A. Scheuring, M. Schuh, M. Schwarz, M. Siegel, N. Smale, M. Streichert, F. Caspers, A. Semenov, H.-W. Hübers, and E. Bründermann, ICFA Beam dynamics newsletter 57, 154 (2012).
- Brosi et al. (2016) M. Brosi, J. L. Steinmann, E. Blomley, E. Bründermann, M. Caselle, N. Hiller, B. Kehrer, Y.-L. Mathis, M. J. Nasse, L. Rota, M. Schedler, P. Schönfeldt, M. Schuh, M. Schwarz, M. Weber, and A.-S. Müller, Phys. Rev. Accel. Beams 19, 110701 (2016).
- Steinmann et al. (2017) J. L. Steinmann, M. Brosi, E. Bründermann, M. Caselle, B. Kehrer, L. Rota, P. Schönfeldt, M. Schuh, M. Siegel, M. Weber, and A.-S. Müller, submitted to PRAB, preprint on arXiv (2017), arXiv:1710.09568 .
- Fisher et al. (2006) A. Fisher, M. Petree, R. Kraus, Y.-S. Au, B. Chan, T. Meyer, and R. Webber, in AIP Conference Proceedings, Vol. 868 (AIP, 2006) pp. 303–312.
- Hübers et al. (2005) H.-W. Hübers, A. Semenov, K. Holldack, U. Schade, G. Wüstefeld, and G. Gol’tsman, Applied Physics Letters 87, 184103 (2005).
- Wilke et al. (2002) I. Wilke, A. M. MacLeod, W. A. Gillespie, G. Berden, G. M. H. Knippels, and A. F. G. van der Meer, Phys. Rev. Lett. 88, 124801 (2002).
- Wiedemann (2007) H. Wiedemann, Particle accelerator physics (Springer Science & Business Media, 2007).
- Kehrer et al. (2015) B. Kehrer, A. Borysenko, E. Hertle, N. Hiller, M. Holz, A.-S. Müller, P. Schönfeldt, and P. Schütze, in Proceedings of IPAC’15 (2015) pp. 866–868.
- Schütze et al. (2015) P. Schütze, A. Borysenko, E. Hertle, N. Hiller, B. Kehrer, A.-S. Müller, and P. Schönfeldt, in Proceedings of IPAC’15 (2015) pp. 872–875.
- Schütze (2017) P. Schütze, Transversale Strahldynamik bei der Erzeugung kohärenter Synchrotronstrahlung, BestMasters (Springer, 2017).
- Hiller et al. (2011) N. Hiller, A. Hofmann, E. Huttel, V. Judin, B. Kehrer, M. Klein, S. Marsching, and A.-S. Müller, in Proceedings of IPAC’11 (2011) pp. 2951–2953.
- Hofmann and Méot (1982) A. Hofmann and F. Méot, Nuclear Instruments and Methods in Physics Research 203, 483 (1982).
- Andersson et al. (2006) Å. Andersson, V. Schlott, M. Rohrer, A. Streun, and O. Chubar, in Proceedings of EPAC’06 (2006) pp. 1223 – 1225.
- Note (1) OpTalix Pro 8.82, www.optenso.com.
- Bane et al. (2005) K. L. F. Bane, K. Oide, and M. Zobov, in 1st CARE-HHH-APD Workshop on Beam Dynamics in Future Hadron Colliders and Rapidly Cycling High-Intensity Synchrotrons (2005).
- Nash et al. (2015) B. Nash, N. Carmignani, L. Farvacque, S. Liuzzo, T. Perron, P. Raimondi, R. Versteegen, and S. White, in Proceedings of IPAC’15 (2015) pp. 113–116.
- Safranek et al. (2009) J. Safranek, G. Portmann, and X. Huang, ICFA Beam Dynamics Newsletter 44, 43 (2009).
- Caselle et al. (2014) M. Caselle, M. Brosi, S. Chilingaryan, T. Dritschler, V. Judin, A. Kopmann, A.-S. Müller, J. Raasch, N. Smale, J. Steinmann, M. Vogelgesang, S. Wuensch, M. Siegel, and M. Weber, in Real Time Conference (RT), 2014 19th IEEE-NPSS (IEEE, 2014) pp. 1–3.
- Caselle et al. (2017a) M. Caselle, L. Ardila Perez, M. Balzer, A. Kopmann, L. Rota, M. Weber, M. Brosi, J. Steinmann, E. Bründermann, and A.-S. Müller, Journal of Instrumentation 12, C01040 (2017a).
- (29) Virginia Diodes, Inc., http://vadiodes.com/index.php/en/.
- Jiang and Zhang (1998) Z. Jiang and X.-C. Zhang, Applied Physics Letters 72, 1945 (1998).
- Roussel et al. (2016) E. Roussel, S. Bielawski, A. Borysenko, C. Evain, N. Hiller, A.-S. Müller, P. Schönfeldt, J. L. Steinmann, and C. Szwaj, in Proceedings of IBIC’15 (2016) pp. 33–37.
- Hiller et al. (2014) N. Hiller, A. Borysenko, E. Hertle, V. Judin, B. Kehrer, S. Marsching, A. Müller, and M. Nasse, in Proceedings of IPAC’14 (2014).
- Rota et al. (2016) L. Rota, M. Balzer, M. Caselle, M. Weber, G. Niehues, P. Schönfeldt, M. Nasse, A.-S. Müller, N. Hiller, A. Mozzanica, C. Gerth, B. Steffen, D. Makowski, and A. Mielczarek, in Proceedings of IBIC’16 (2016) pp. 740 – 743.
- Caselle et al. (2017b) M. Caselle, L. Rota, M. Balzer, M. Brosi, S. Funkner, B. Kehrer, M. Nasse, G. Niehuse, M. Patil, P. Schönfeldt, M. Schuh, J. Steinmann, M. Yan, E. Bründermann, M. Weber, A.-S. Müller, G. Borghi, M. Boscardin, and S. Ronchin, in Proceedings of IBIC’17 (2017) pp. 12–17.
- (35) S. Funkner, E. Blomley, E. Bründermann, M. Caselle, N. Hiller, M. J. Nasse, G. Niehues, L. Rota, P. Schönfeldt, S. Walther, M. Weber, and A.-S. Müller, arXiv.org arXiv:1809.07530 .
- Hofmann et al. (2010) A. Hofmann, I. Birkel, M. Fitterer, S. Hillenbrand, N. Hiller, E. Huttel, V. Judin, M. Klein, S. Marsching, A.-S. Müller, N. Smale, K. Sonnad, and P. Tavares, in Proceedings of IPAC’10 (2010) pp. 924–926.
- Kehrer et al. (2016) B. Kehrer, E. Blomley, M. Brosi, E. Bründermann, N. Hiller, A.-S. Müller, M. J. Nasse, M. Schedler, P. Schönfeldt, M. Schuh, P. Schütze, N. Smale, and J. L. Steinmann, in Proceedings of IPAC’16 (2016) pp. 109–111.
- Steinmann et al. (2018) J. Steinmann, M. Brosi, E. Bründermann, M. Caselle, S. Funkner, B. Kehrer, M. Nasse, G. Niehues, L. Rota, P. Schönfeldt, M. Siegel, M. Weber, and A.-S. Müller, in Proceedings of the 60th ICFA Advanced Beam Dynamics Workshop on Future Light Sources (2018).
- Kehrer et al. (2017) B. Kehrer, E. Blomley, M. Brosi, E. Bründermann, N. Hiller, A.-S. Müller, M. Nasse, M. Schedler, M. Schuh, M. Schwarz, P. Schönfeldt, P. Schütze, N. Smale, and J. Steinmann, in Proceedings of IPAC’17 (2017) pp. 53–56.
- Schönfeldt et al. (2017) P. Schönfeldt, M. Brosi, M. Schwarz, J. L. Steinmann, and A.-S. Müller, Phys. Rev. Accel. Beams 20, 030704 (2017).
- Boltz (2017) T. Boltz, Comprehensive Analysis of Micro-Structure Dynamics in Longitudinal Electron Bunch Profiles, Master thesis, Karlsruhe Institute of Technology (2017).