Fast Vehicle Detection in Aerial Imagery
Abstract
In recent years, several real-time or near real-time object detectors have been developed. However these object detectors are typically designed for first-person view images where the subject is large in the image and do not directly apply well to detecting vehicles in aerial imagery. Though some detectors have been developed for aerial imagery, these are either slow or do not handle multi-scale imagery very well. Here the popular YOLOv2 detector is modified to vastly improve it’s performance on aerial data. The modified detector is compared to Faster RCNN on several aerial imagery datasets. The proposed detector gives near state of the art performance at more than 4x the speed.
1 Introduction
Object detection from ground view is a popular problem with a lot of interest from the academic computer vision community. Detection from aerial views, while there is some interest, is significantly less studied. Consequently recent advancements are primarily large in image object detection and classification, mostly using deep convolutional neural networks (CNNs). Often these neural networks do not work well when directly applied to small in image objects. However the networks can often be modified to improve their performance on this type of data.
Of particular interest is detecting vehicles from aerial platforms at near real-time speeds. While Faster RCNN[11] has been proven to be effective at detecting vehicles in aerial imagery, it is unable to reach anywhere near the real time speeds desired for many applications. Other methods use sliding window techniques which can also be slow. Newer detectors that can run on whole images are much faster but have yet to be proven on aerial imagery. In this paper, an open-source fast deep CNN is modified into a near real-time multi-scale detector for aerial imagery.
The rest of this paper is organized as follows. Section 2 introduces the deep CNNs used in this paper. Section 3 covers the aerial imagery datasets used. How the net was modified is described in Section 4. Section 5 gives the results. The paper is concluded in Section 6.
2 Deep learning object detection algorithms
Since a deep CNN easily won the 2012 ImageNet competition, CNNs have become the state of the art in object detection in images. Whereas before hand crafted features such gradients, color, etc., were used to detect objects; now CNNs can automatically learn which features are relevant for detection. This work focused on version 2 of the you only look once (YOLO) detector[10], however it is compared to Faster RCNN, which is considered by most to be state of the art. For testing, open-source TensorFlow[1] versions of the detectors were used[12, 2].
2.1 Faster RCNN
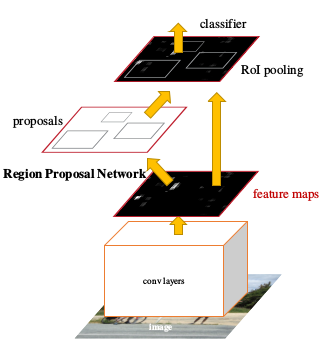
Faster RCNN is the follow on to Fast RCNN[4] and RCNN[5]. Faster RCNN starts with a CNN adds a Region Proposal Network (RPN) to create proposals (bounding boxes) from the features given by the CNN. Then ROI pooling and a classifier is used to classify and score each bounding box. A diagram of the net from the original paper is given in Figure 1. Due to its speed and accuracy, Faster RCNN has been heavily used since its inception in 2015.
2.2 YOLOv2
YOLOv2 not surprisingly is the improved version YOLO[9], a net that reached near Faster RCNN accuracy at much greater speeds. YOLOv2 also starts with a CNN, and then is followed by two more CNNs that simultaneously produce bounding boxes, object confidence scores, and class scores. Additionally YOLOv2 includes a route and reorg layers that allow the net to use features from earlier in the net similar to SSD[8].
3 Datasets
To train a deep neural network object detector requires a vast amount of data; hence the coupling of deep learning with big data. The neural nets in the previous section all provide pretrained network weights, usually started on ImageNet and then on PASCAL VOC[3] or MS COCO[7]. Detailed in Table 1, these datasets provide thousands of images, and the detectors trained on them are good general purpose object detectors. However these datasets largely contain imagery taken from personal cameras at ground level and contain very little to no aerial data. Additionally these images are relatively low resolution compared to aerial imagery.
| Dataset | Number of Training Images |
|---|---|
| ImageNet | 450000+ |
| MS COCO | 200000+ |
| PASCAL VOC (2007+2012) | ~20000 |
There are several publicly available aerial/elevated imagery detection datasets. Additionally AFRL has some in house aerial imagery, referred to as Air Force aerial vehicle imagery dataset (AFVID), that has been truthed.
3.1 Dataset descriptions
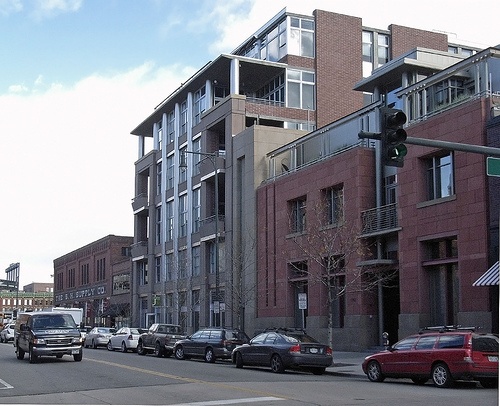
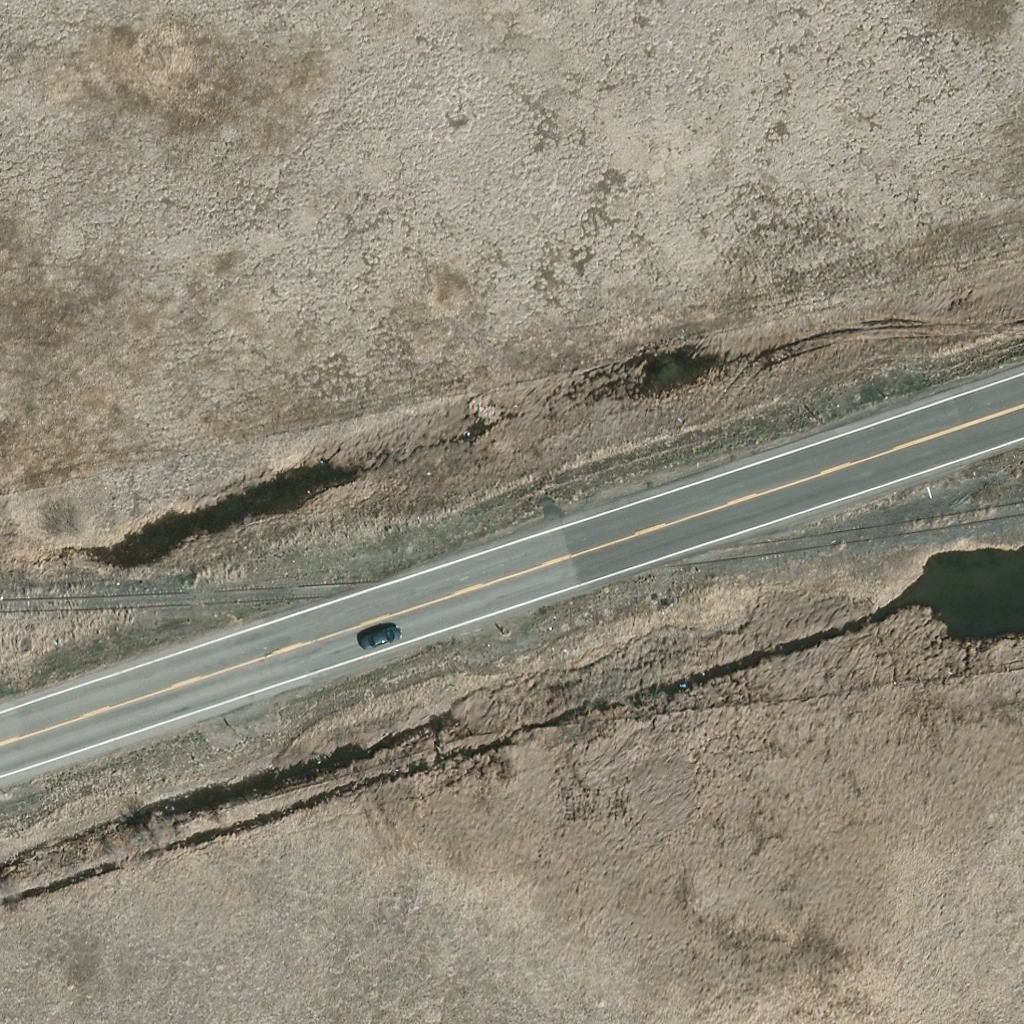
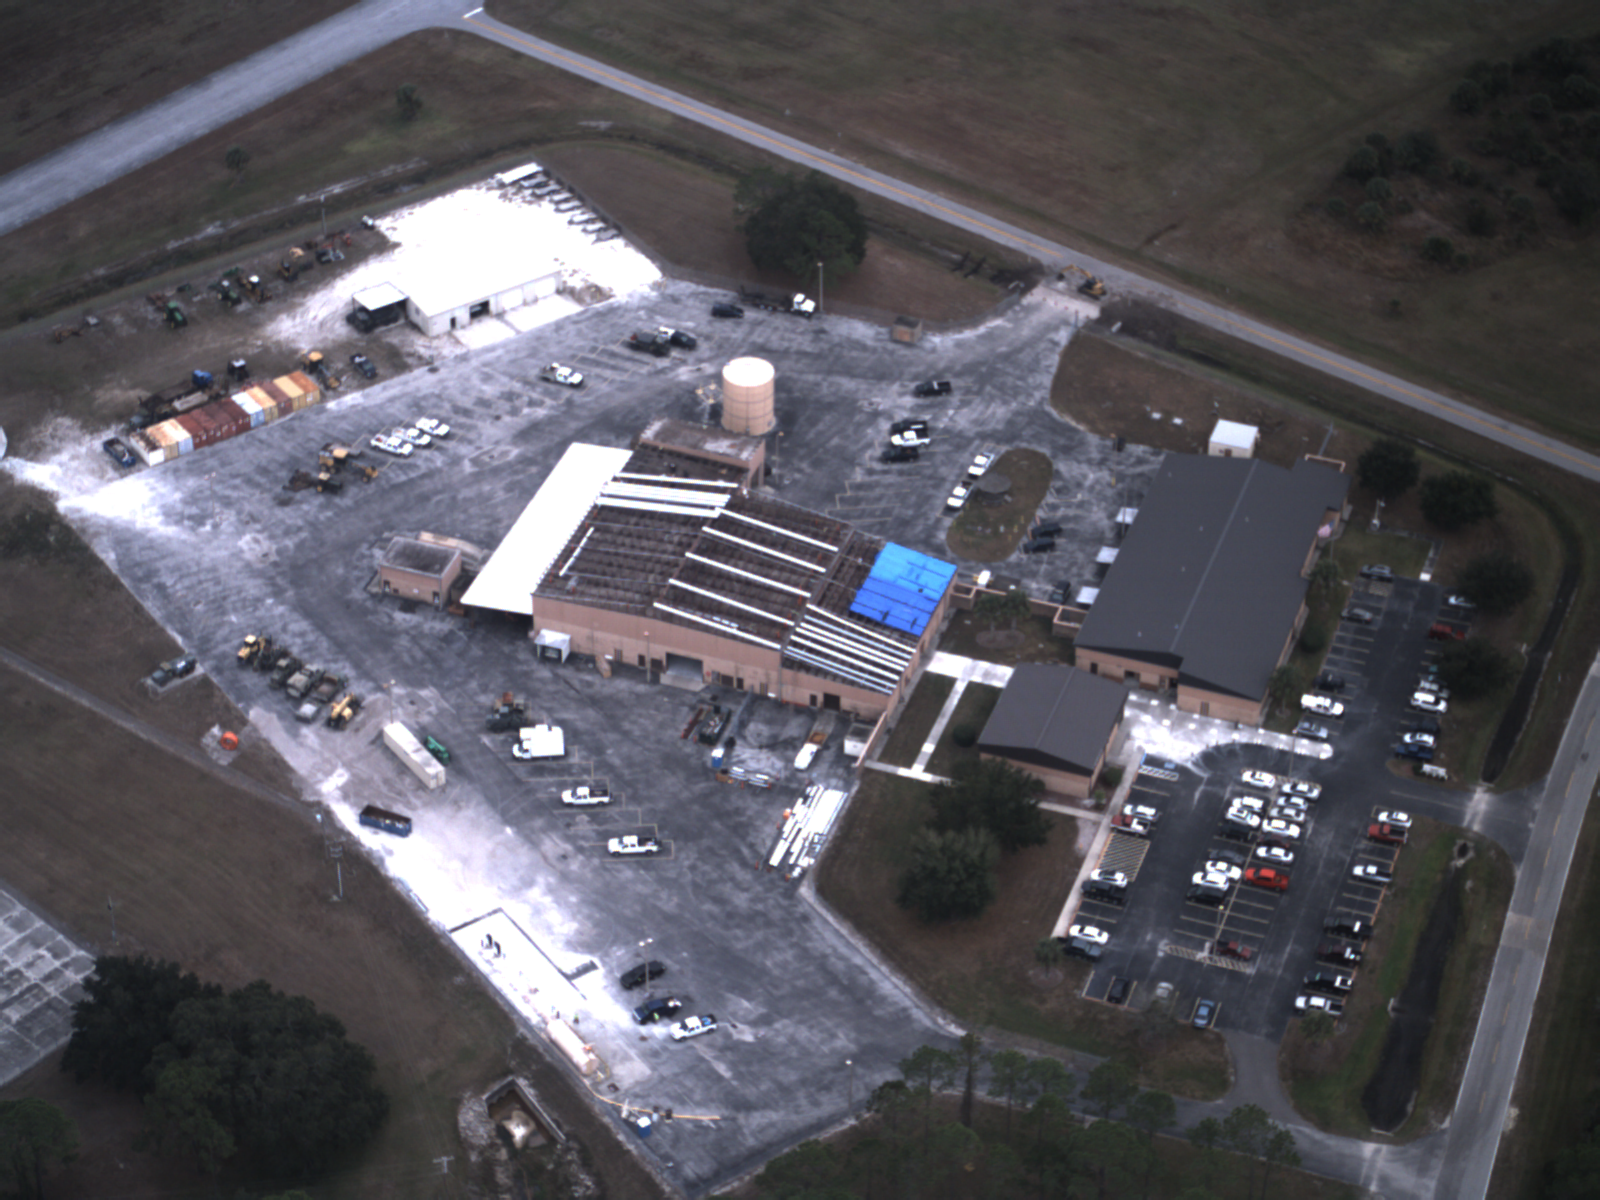
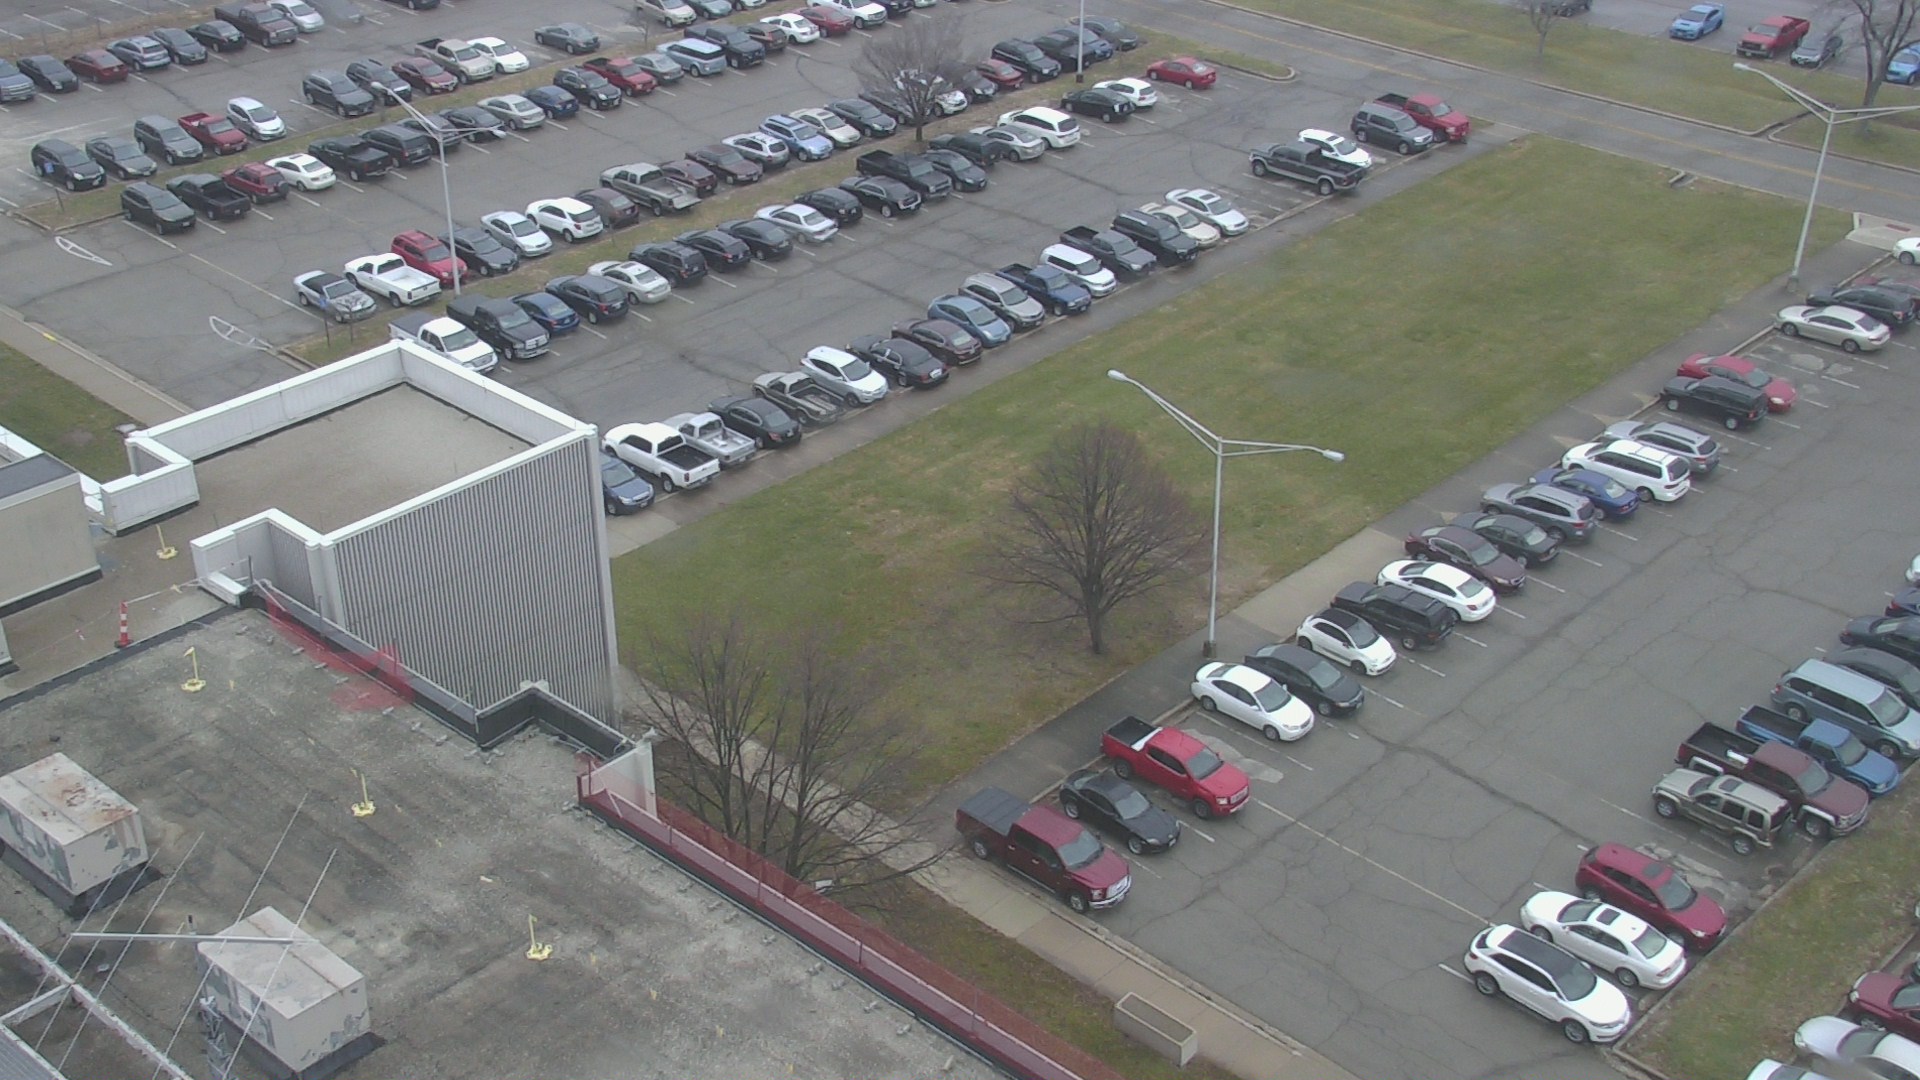
Aerial data can be surprisingly diverse. It can be from different view points, have different ground sampling distances (gsd), different image sizes, aspect ratios, color, etc. Vehicles in different data may be significantly different in size and appearance. Figure 2 shows different images from four different datasets. It is obvious how different the VOC data is from any of the elevated data, while the VEDAI and AFVID data are somewhat similarities, and the AF Building Camera data is more similar to the aerial and satellite data. A more detailed look at the aerial datasets is available in Table 2.
| Dataset | Image Width, Height | Mean Vehicle Width,Height | Ratio Target Area/Image Area | Percent of Targets Overlapping |
|---|---|---|---|---|
| VEDAI | 1024, 1024 | 41.2, 40.8 | 0.0016 | 5 |
| DLR3k | 5616, 3744 | 30.4, 30.0 | 0.00004 | 14 |
| NeoVision2-Helicopter | 1920, 1080 | 124.6, 85.8 | 0.0069 | 20 |
| AFVID 1 | 1600, 1200 | 39.4, 34.2 | 0.0008 | 33 |
| AFVID 2 | 1600, 1200 | 55.6, 63.7 | 0.0019 | 54 |
| AFVID 3 | 1600, 1200 | 43.5, 38.6 | 0.0009 | 40 |
| AFVID 4 | 1600, 1200 | 67.7, 63.5 | 0.0026 | 34 |
| AF Building Camera | 1920, 1080 | 51.7, 35.5 | 0.0012 | 53 |
VEDAI
Vehicle Detection in Aerial Imagery (VEDAI) dataset consists of satellite imagery taken over Utah in 2012. There are 1,210 orthonormal images in RGB and IR. Only RGB is used here.
DLR3k
Data from the German Aerospace Center (DLR),there are 20 images taken from a camera on an airplane about 1000 feet over Munich, Germany.
NeoVision2 - Helicopter
A set of 32 video clips taken from an HD camera on helicopter flying in Los Angeles, California area.
AFVID
Video clips taken from a small UAV flying about 1000 feet over Avon Park, Florida or flying about 700 feet over Camp Atterbury, Indiana.
AF Building Camera
Handful of images taken from cameras on a tower at Wright Patterson Air Force Base.
3.2 Dataset segmentation
Much of aerial imagery is given as video clips, meaning it can not be considered independent and identically distributed(IID), unlike the the large detection image datasets. This means even though there may be thousands of images, some of it may be so close in appearance that effectively there is less data and none of our datasets are anywhere near the size of even PASCAL VOC. Ideally each dataset should be separated into train (60%), validation (20%), and test (20%) sets. Typically this should only be done with datasets that have independent images. Some of the datasets consist of a short video sequences where at least two videos are kept out, one for validation and one for testing.
4 Modifying YOLOv2
YOLO provides models and pretrained weights for the MS COCO and PASCAL VOC datasets, both which are capable of detecting vehicles that are relatively large in the image. To detect objects that are small relative to the size of the image and to detect different numbers of classes the YOLO net needs to be modified and fine-tuned using appropriate data.
4.1 Number of classes
In the configuration file that defines the YOLO net model there is a ’classes’ definition that is used to define the number of classes. To change the number of classes used, more the just the classes setting will need to be changed; the number of filters in the last convolutional layer must be altered to reflect the changed number of classes. The number of filters is set by , where num is number of anchor boxes, and coords is four corresponding to the four coordinates used to define a bounding box.
4.2 Net resolution and depth
The standard YOLOv2 net has input resolution of 416x416 and after pass-through and max-pooling has an output feature resolution of 26x26 and 13x13. For a 1024x1024 image that would create feature resolutions corresponding to about 40 and 80 pixels, which is approximately the size of and twice the size of the vehicles in the VEDAI imagery, meaning a vehicle may correspond to a single point on a feature map. Ideally there should be multiple points per vehicle. To increase net feature resolution and consequently the number of feature points per vehicle, there are two methods: increase the input resolution or to decrease the net depth.
Increasing the net input resolution simply means increasing the width and height of the first layer of the net. In the previous example doubling the width and height leads to output sizes of 52x52 and 26x26 and 20/40 pixels per feature, so that there can be about four feature points for the average vehicle. However, this significantly increases GPU memory usage and decreases the speed of the net.
To decrease the net depth, convolutional and max pooling layers are removed so the net is downsampled less, making the net shallower. This goes against the now conventional wisdom that deeper nets are typically better, but has been shown to work well on aerial data[6, 13]. Removing one max pooling layer and associated CNN layers gives the same output resolution as doubling the input resolution without having as great as an effect the memory usage or speed of the net. A sample shallower YOLO net is given in Appendix A Table 7b alongside a typical net.
4.3 Net shape
YOLO provide pretrained square shaped nets, however most of our data is not square. In YOLOv2, the shape of the net can be changed to closer match the aspect ratio of the input data. Faster RCNN does this automatically.
4.4 Anchors
In [13], the Faster RCNN anchors were fixed, as the bounding boxes were refined to be of fixed shape and size. For multi-scale detection, it should be better to have multiple anchor box sizes. The five anchor sizes in YOLOv2 were determined from a k-means approach using the bounding boxes in the VOC dataset. Due to the difference in orientation and scale of vehicles, most of the anchors were kept, with only the largest being removed, since it is not expected that there will be large objects in the image.
5 Experiments and results
To calculate how the detectors are performing, two metrics are used:
| (1) |
and
| (2) |
In defense applications, the false alarm rate (FAR) is often used instead of precision but
| (3) |
and recall is sometimes referred to the detection rate. The another metric used here is frames per second (FPS). To match detections to ground truth, intersection over union (IOU) is used. IOU is ratio between the area in which the two boxes overlap and the total area of each box not including the overlap.
A detector was desired for aerial imagery with small vehicles. Only a single class, vehicle, was used in training and testing. Therefore average precision (AP) and average recall (AR) refer to the average over all the test images at an IOU threshold of 0.5.
5.1 Pretrained object detectors
Most open source detectors provide their best trained for PASCAL VOC and/or MS COCO. Since these datasets are large and somewhat diverse they make good general purpose object detectors. The results for these detectors tested on aerial imagery is given in Table 3. While Faster RCNN gives the best precision and recall, it is the slowest of the tested detectors. All of the detectors performed quite poorly without fine-tuning for aerial data.
| Net - trained | AFVID | VEDAI | AF Building Camera | FPS |
|---|---|---|---|---|
| YOLO - VOC+COCO | AP: 0.0 AR: 0.03 | AP: 0.0 AR: 0.03 | AP: 0.05 AR: 0.07 | 16 |
| YOLO - VOC | AP: 0.0 AR: 0.0 | AP: 0.0 AR: 0.01 | AP: 0.04 AR: 0.04 | 15 |
| Faster RCNN - COCO | AP: 0.04 AR: 0.18 | AP: 0.01 AR: 0.12 | AP: 0.13 AR: 0.19 | 3 |
5.2 YOLO modifications
The biggest increases in performance come from altering the net’s size and depth. Table 4 compares the performance of results of several modified YOLO nets and a shallow Faster RCNN net based on [13]. All the nets were fine-tuned using AFVID and VEDAI data. The YOLO nets were based off of the YOLO-VOC net but Faster RCNN was from COCO. The first YOLO listed is the standard YOLO modified for one class (vehicles). While it is five times faster than Faster RCNN, the performance across the board is much weaker. Doubling the size as described in 4.2, gives a performance boost, particularly on the AFVID dataset, but halves the speed. Removing several convolutional layers and a max pooling layer greatly improves precision, recall, and speed. With the standard input resolution but shallower, YOLO is approximately seven times faster the shallower Faster RCNN, but still has lower recall and lower precision on the AFVID and VEDAI datasets. Increasing the size of the shallower net decreases the speed of the net again, but still boosts precision and recall. Changing the input shape of the shallow YOLO net to better match the aspect ratio of the AFVID data causes a large increase in the precision for that data, but causes a small decrease on the square VEDAI data. On the AF Building Camera data, which none of the nets were trained on, the shallow YOLO nets do better than Faster RCNN.
| Net | Input Size | AFVID | VEDAI | AF Building Camera | FPS |
|---|---|---|---|---|---|
| Shallow Faster RCNN | 600xA | AP: 0.88 AR: 0.89 | AP: 0.78 AR: 0.91 | AP: 0.05 AR: 0.08 | 3 |
| YOLO | 416x416 | AP: 0.0 AR: 0.03 | AP: 0.0 AR: 0.01 | AP: 0.01 AR: 0.02 | 15 |
| YOLO | 832x832 | AP: 0.01 AR: 0.13 | AP: 0.0 AR: 0.05 | AP: 0.0 AR: 0.04 | 6 |
| Shallow YOLO | 416x416 | AP: 0.1 AR: 0.37 | AP: 0.46 AR: 0.72 | AP: 0.14 AR: 0.21 | 25 |
| Shallow YOLO | 832x832 | AP: 0.21 AR: 0.79 | AP: 0.66 AR: 0.91 | AP: 0.15 AR: 0.3 | 8 |
| Shallow YOLO | 864x480 | AP: 0.76 AR: 0.87 | AP: 0.61 AR: 0.81 | AP: 0.21 AR: 0.3 | 13 |
One application is to use this CNN network on live data from the AF Building Cameras, which has a larger variance in vehicle sizes than most aerial datasets. The nets were trained on the AFVID data and a few images from the AF Building Cameras. The results in Table 5, show that rectangular shallow YOLO outperforms Faster RCNN on this data, while the shallow Faster RCNN is still better on AFVID and VEDAI data.
| Net | Input Size | AFVID | VEDAI | AF Building Camera | FPS |
|---|---|---|---|---|---|
| Shallow Faster RCNN | 600xA | AP: 0.88 AR: 0.89 | AP: 0.1 AR: 0.46 | AP: 0.42 AR: 0.58 | 3 |
| Shallow YOLO | 416x416 | AP: 0.13 AR: 0.47 | AP: 0.03 AR: 0.22 | AP: 0.25 AR: 0.39 | 25 |
| Shallow YOLO | 864x480 | AP: 0.74 AR: 0.82 | AP: 0.05 AR: 0.27 | AP: 0.5 AR: 0.66 | 13 |
5.3 Deeper look at results
For cases where the input to the net is an entire image, the object size relative the size of image is more important to than the size of the object itself. For example, in the MSCOCO dataset images are typically 640x480 and the benchmark define a small object to be less than 32x32 a medium object between 32x32 and 96x96. While most of the mean object sizes in the aerial imagery fall in the medium category by this definition, the image sizes are larger so when resized to the input resolution of the nets they equivalently fall into the small category. Hence the categories were redefined in terms of the image size, such that small objects are 0.1% or less, medium objects are between 0.1% and 0.3% and large objects are greater than 0.3% of the original image. Looking at the results in terms of size on AF Building Camera data in Table 6 shows a surprising result for Faster RCNN, the medium size is actually has the worst performance. Shallow YOLO performs as expected.
| Detector | mAP | mAP Large | mAP Medium | mAP Small |
|---|---|---|---|---|
| Shallow Faster RCNN | 0.080 | 0.171 | 0.080 | 0.117 |
| Shallow YOLO (864x480) | 0.124 | 0.404 | 0.329 | 0.102 |
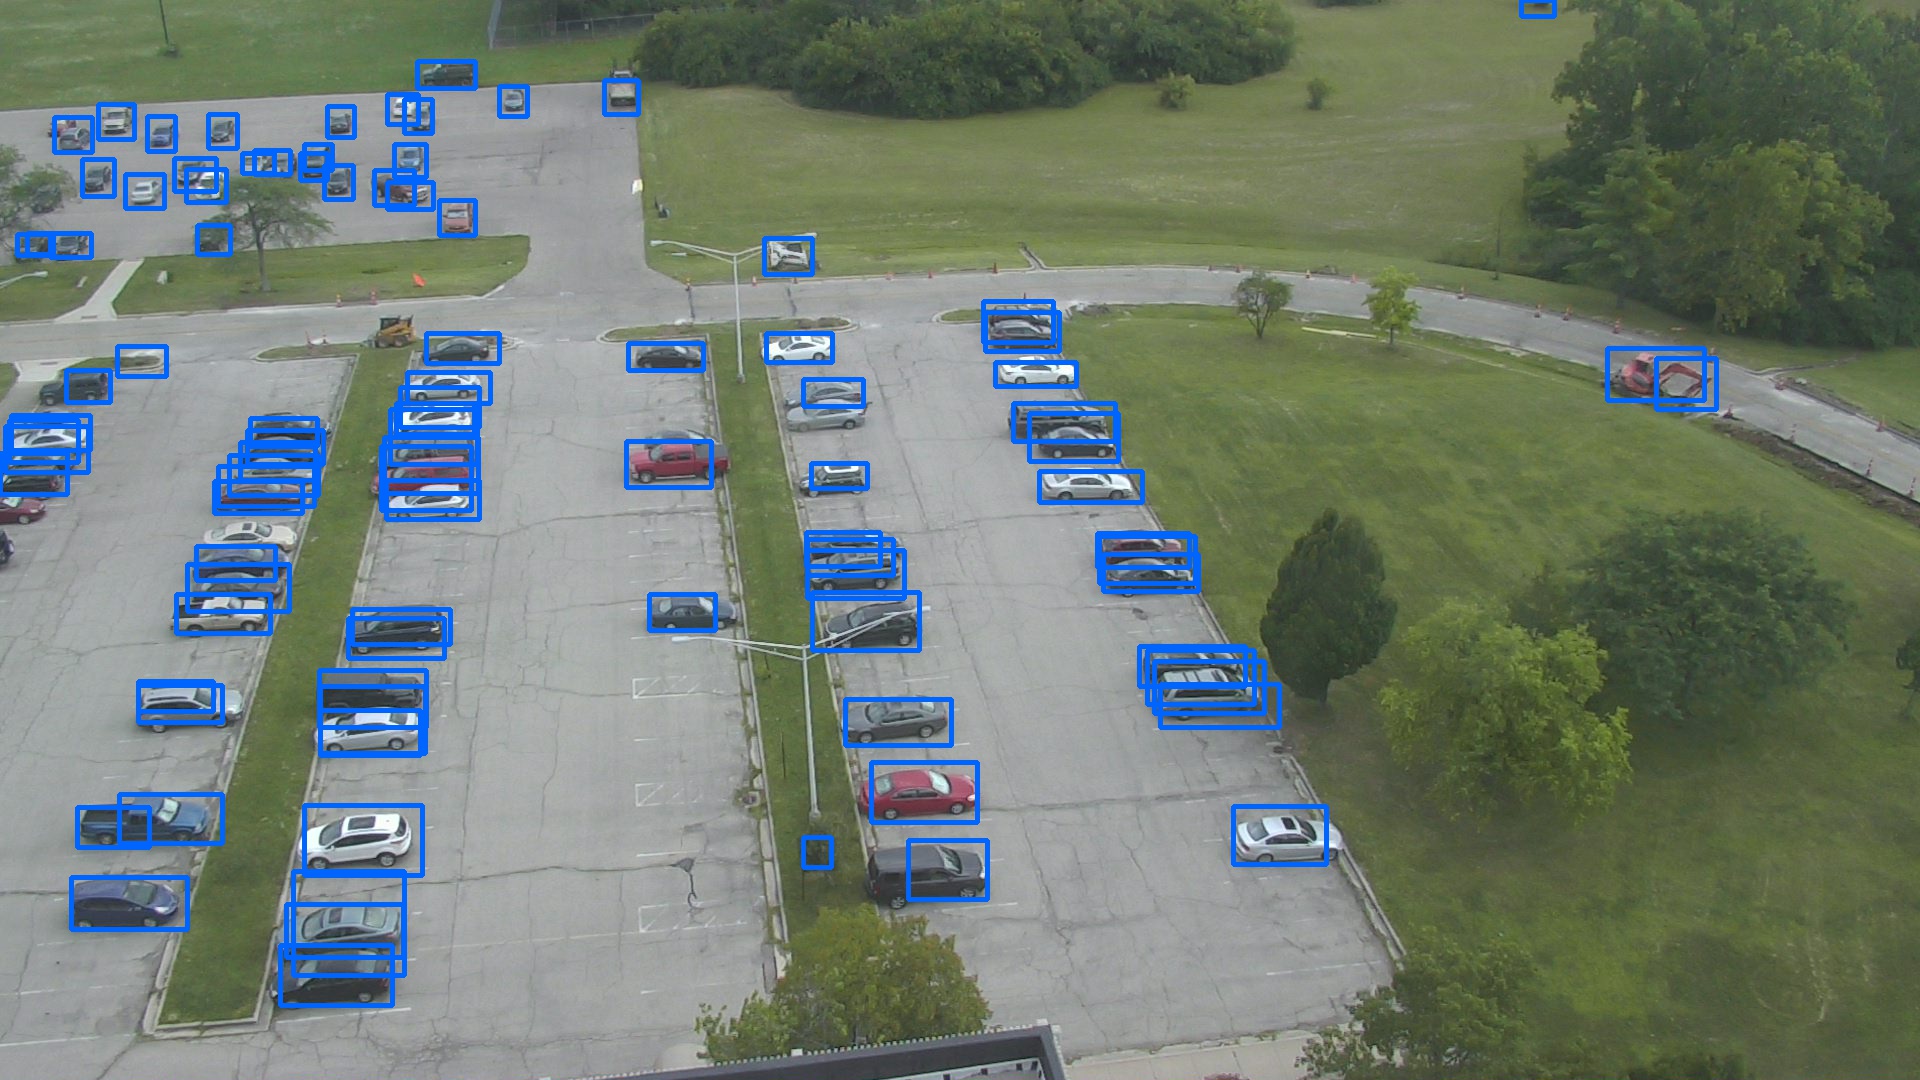
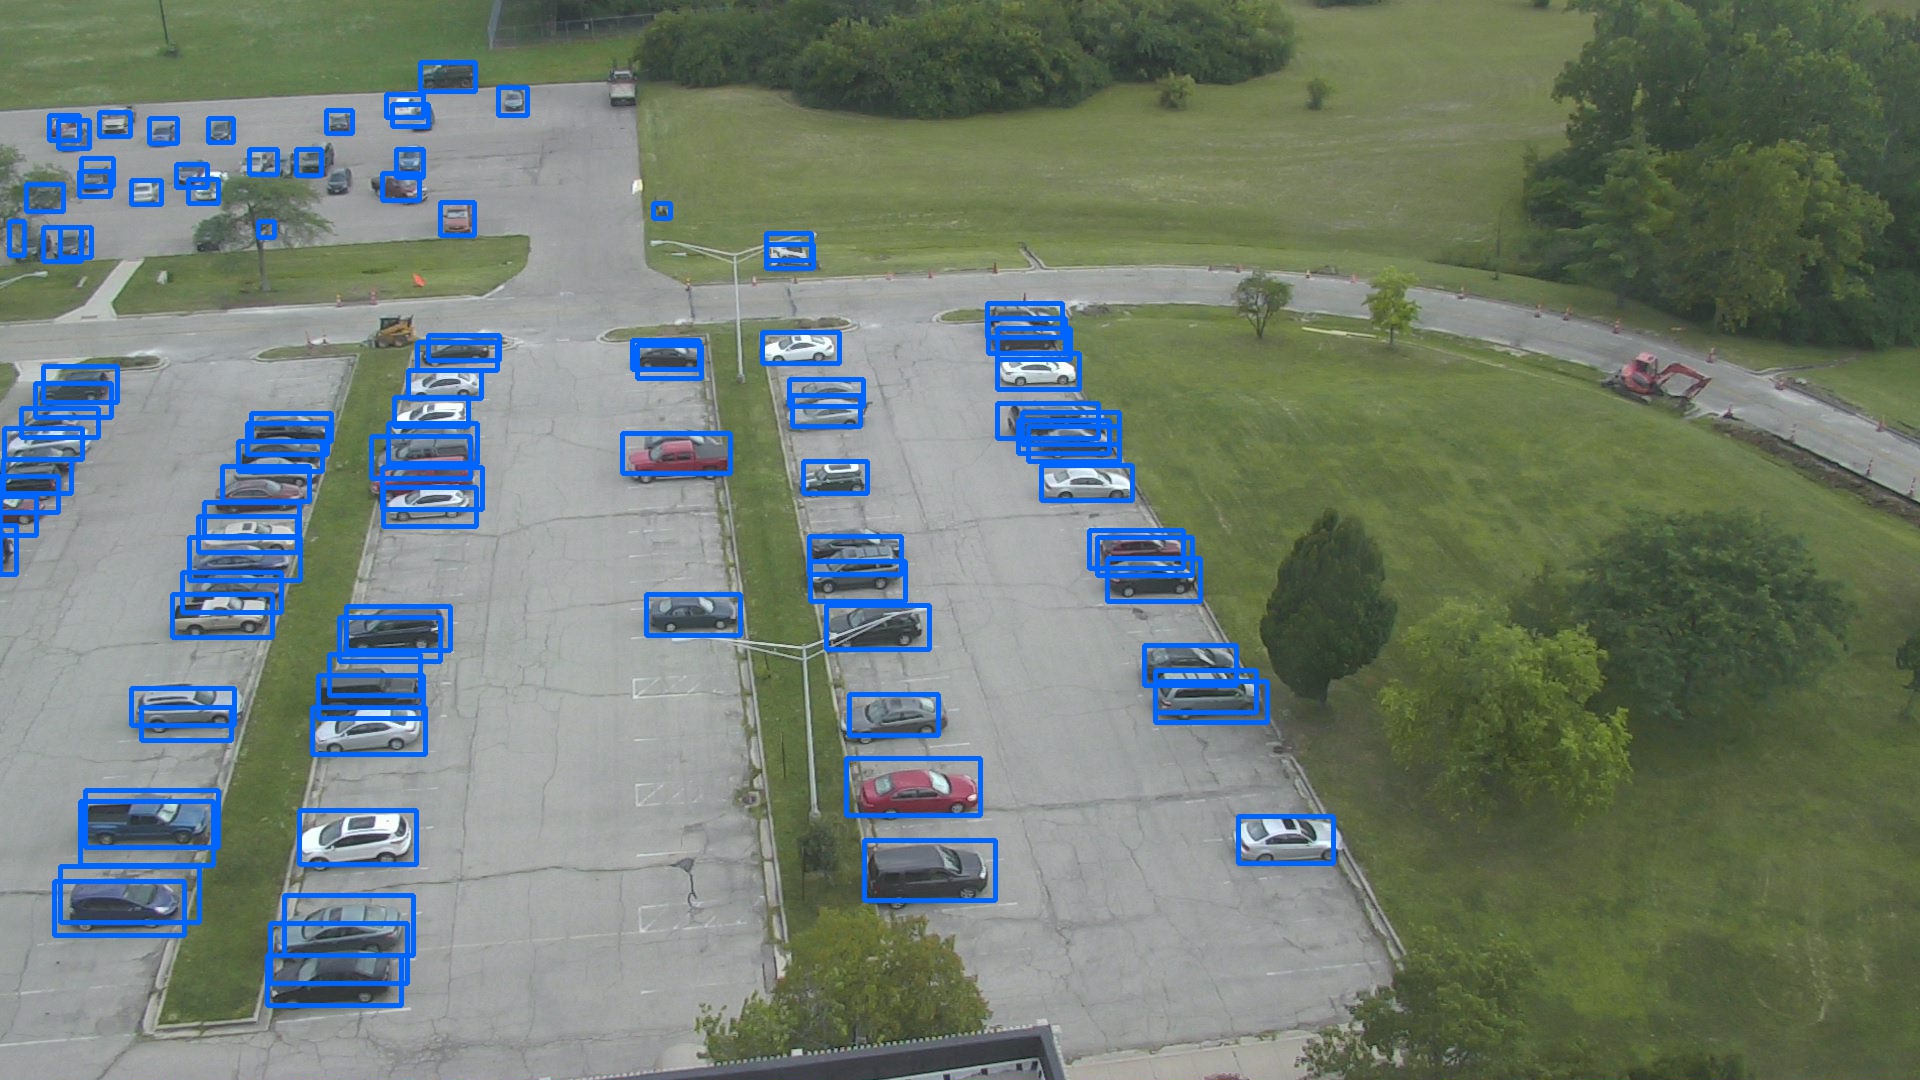
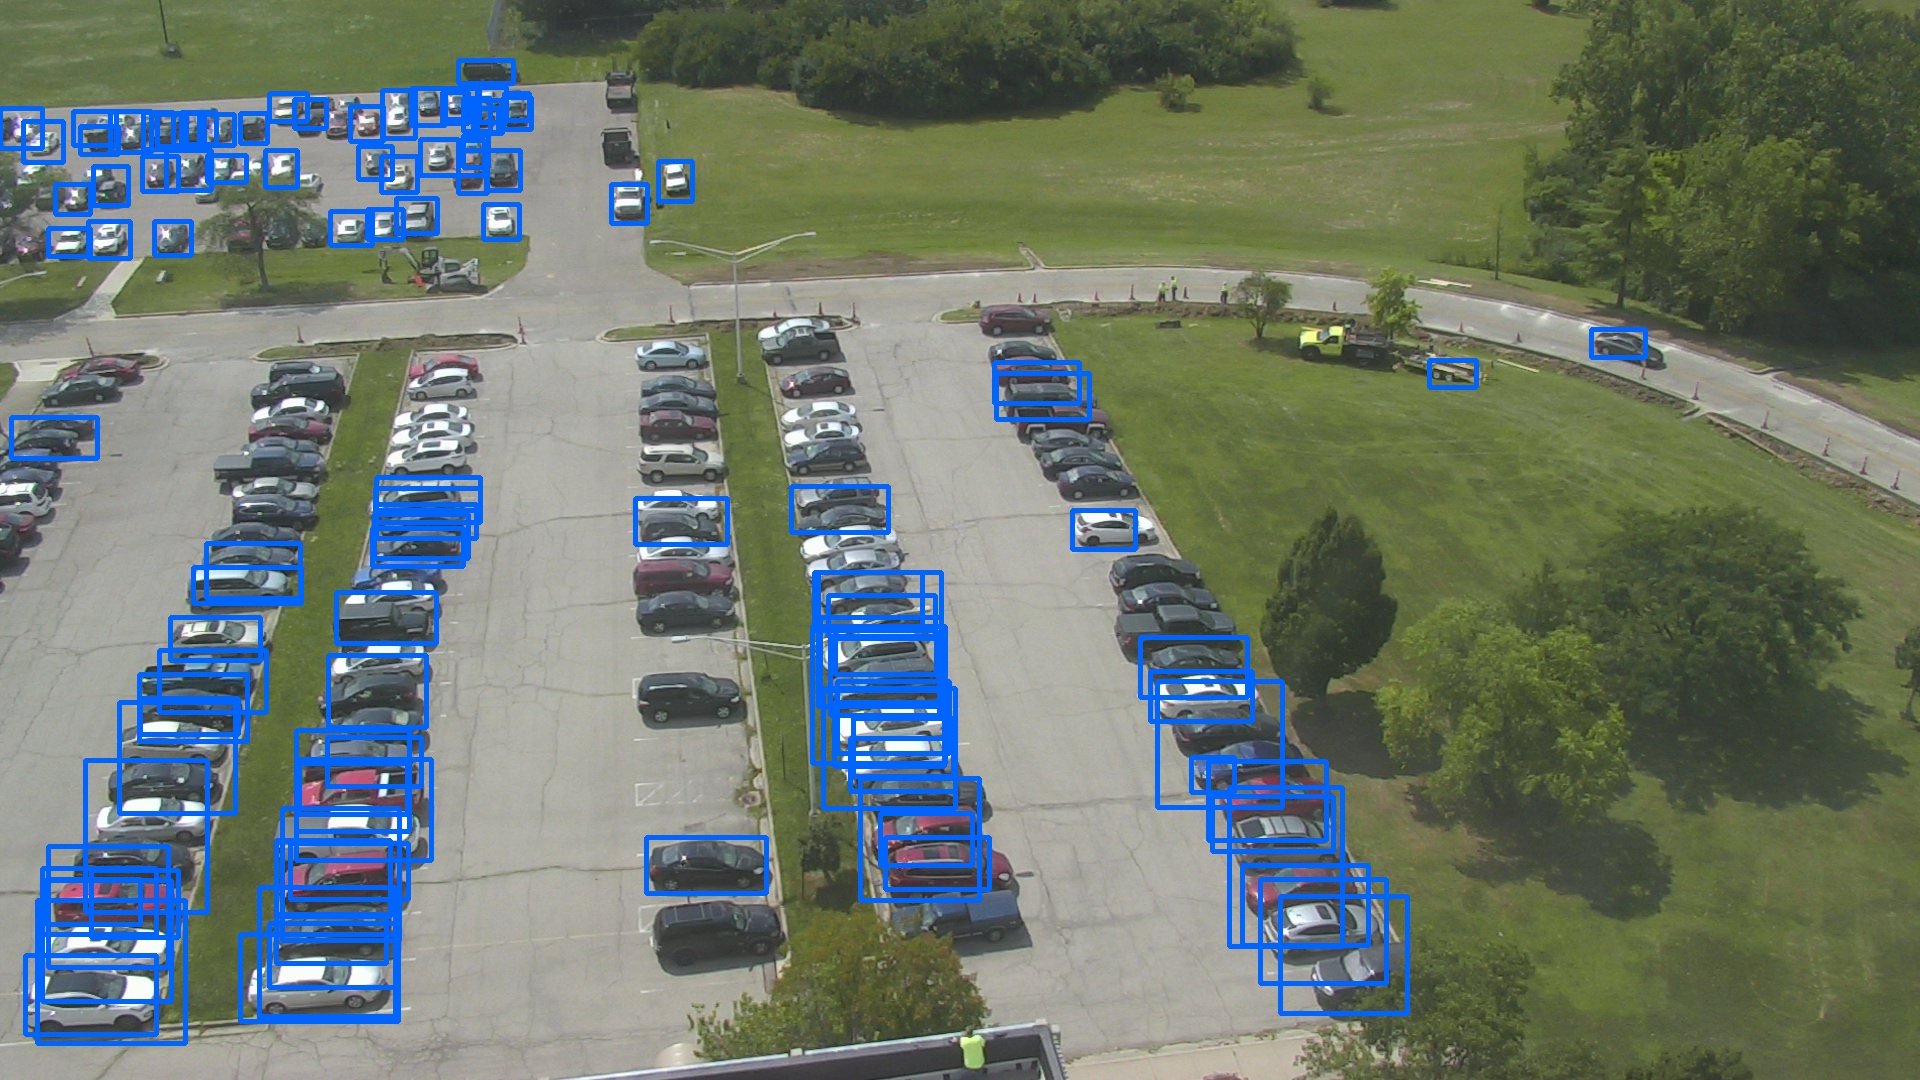
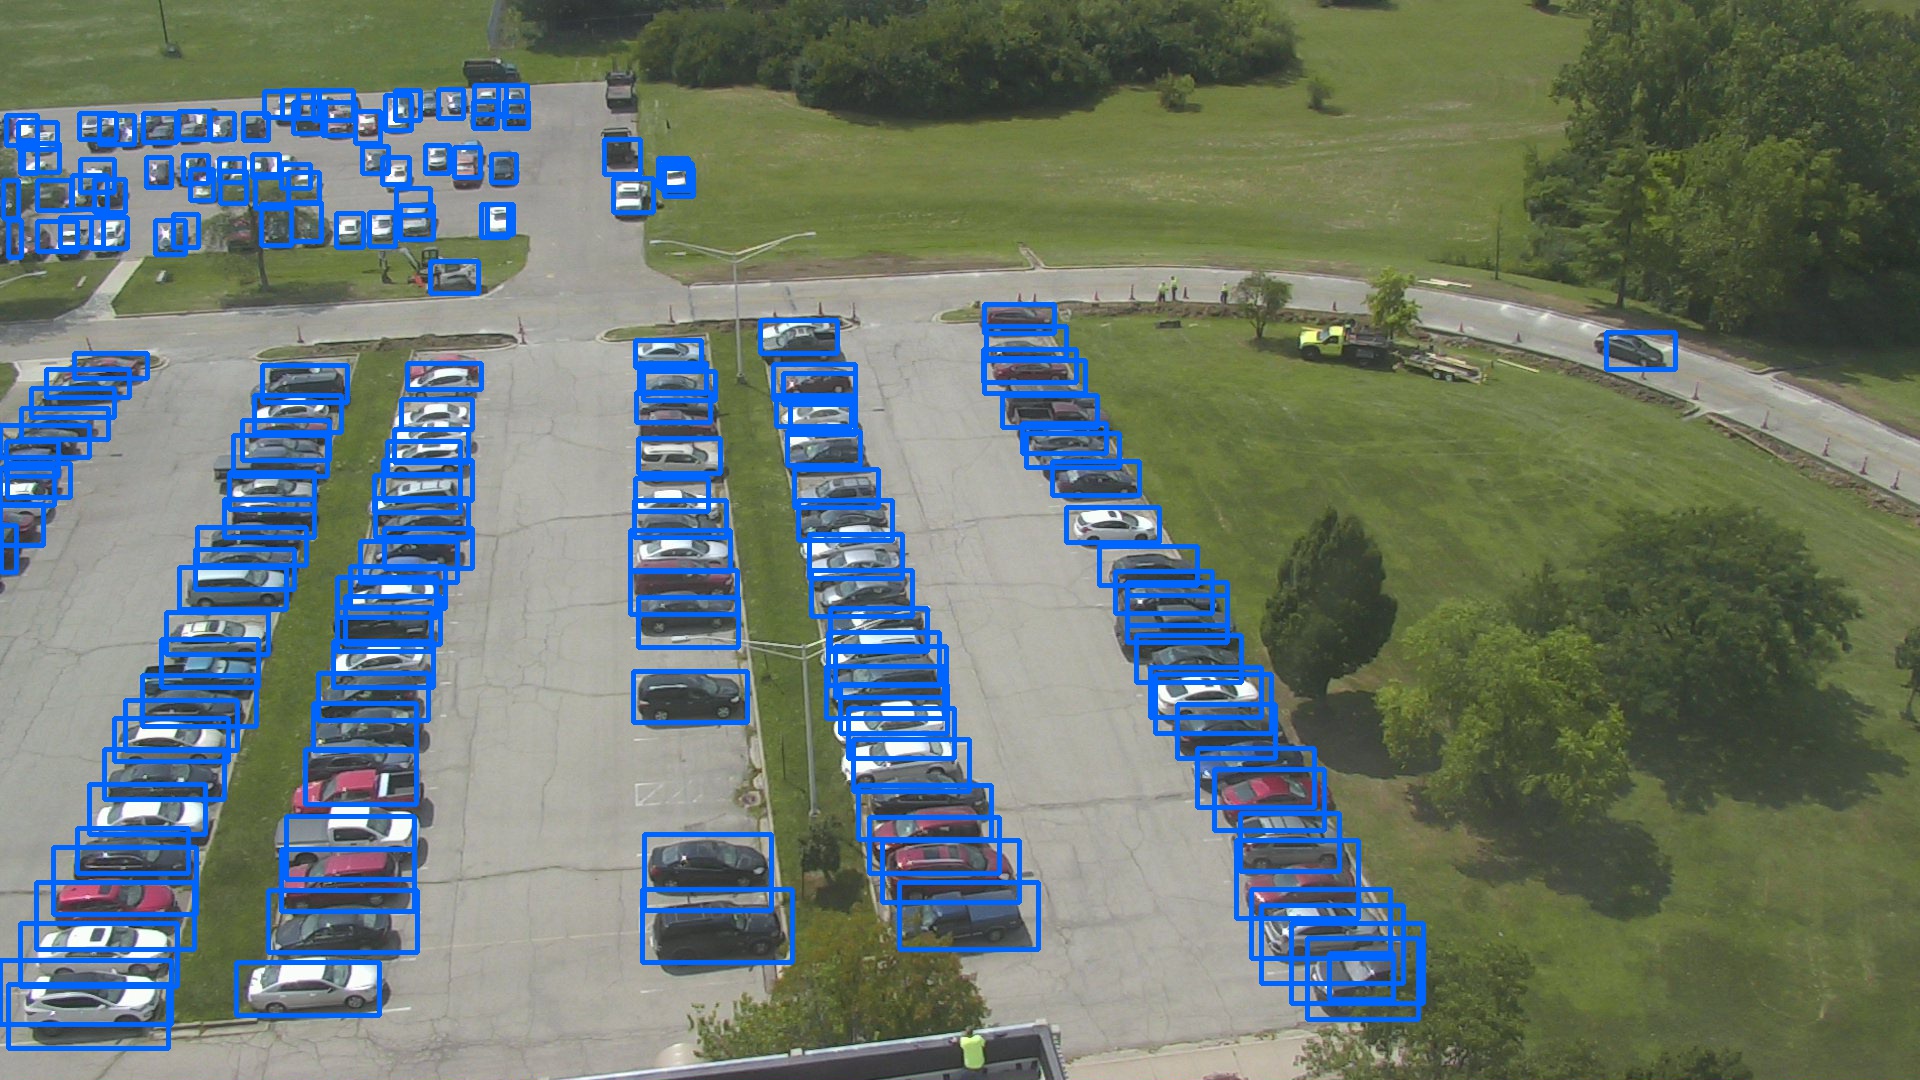
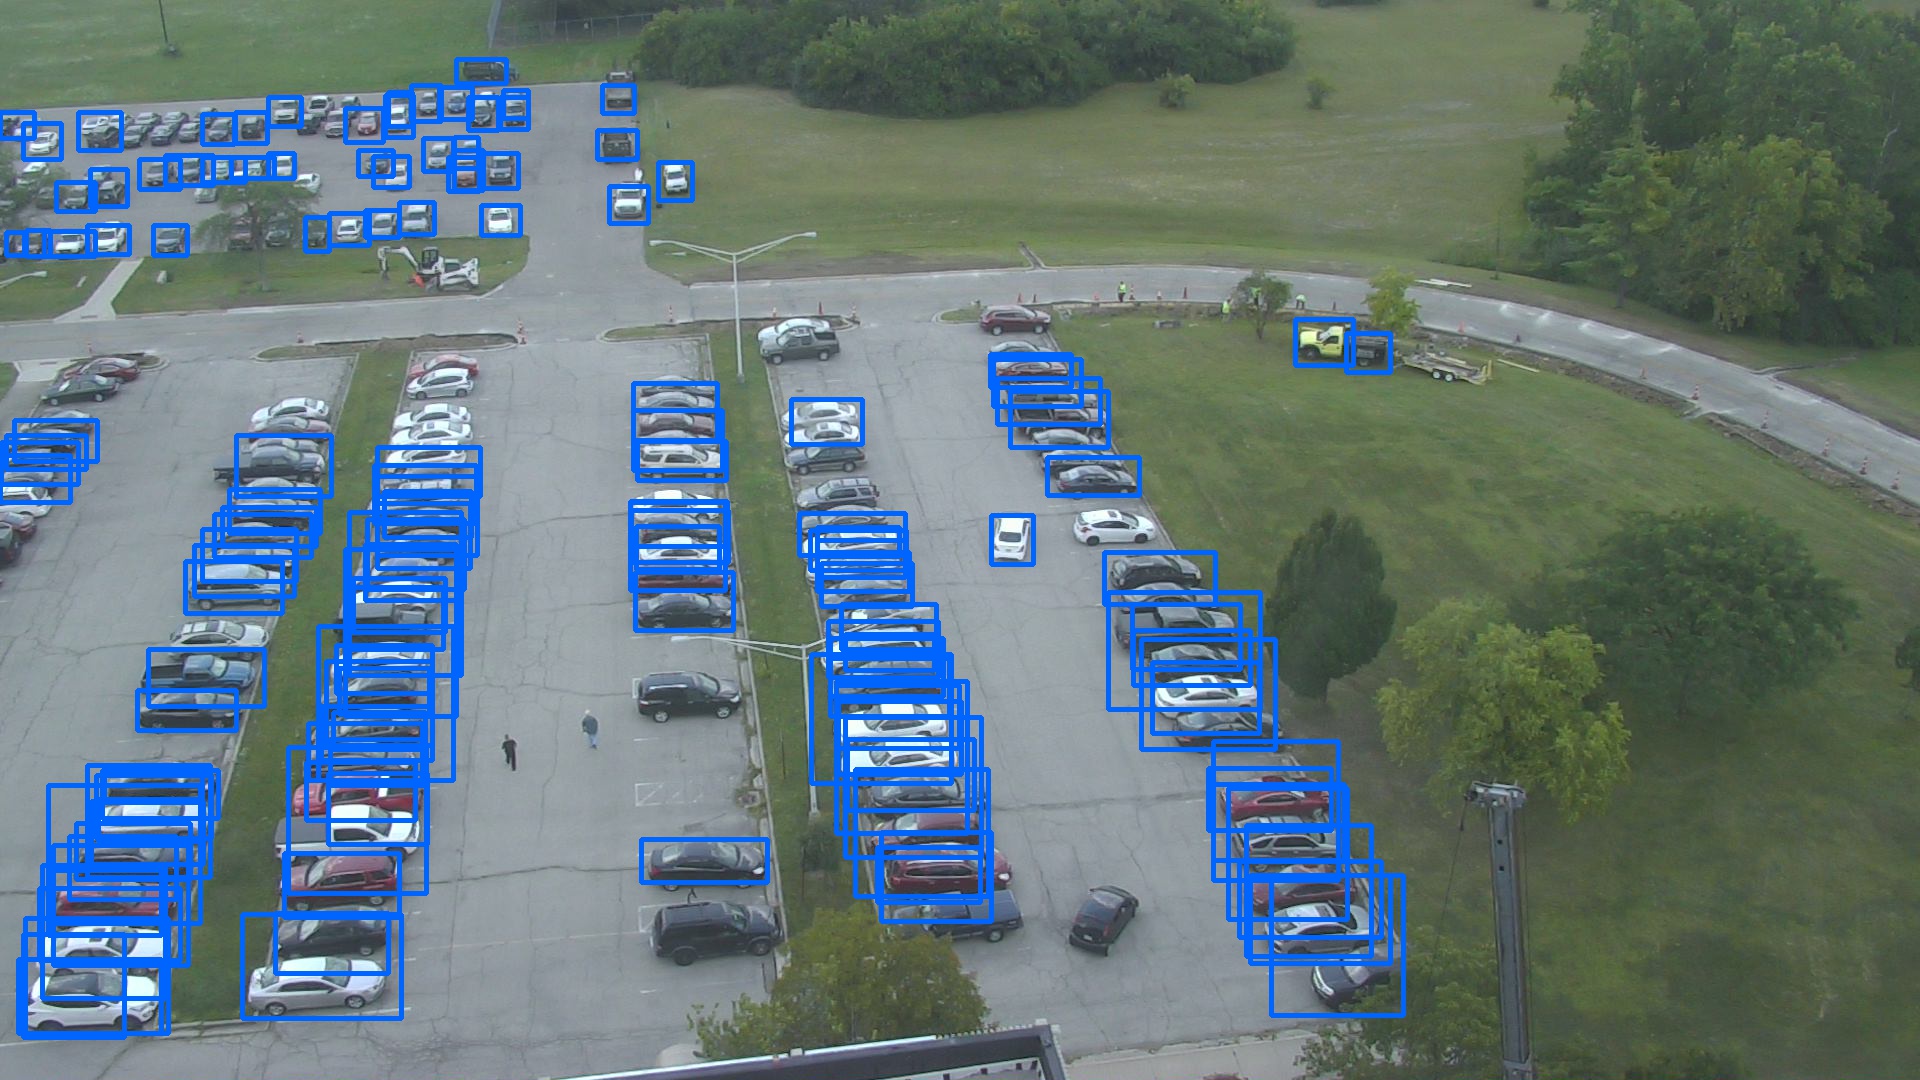
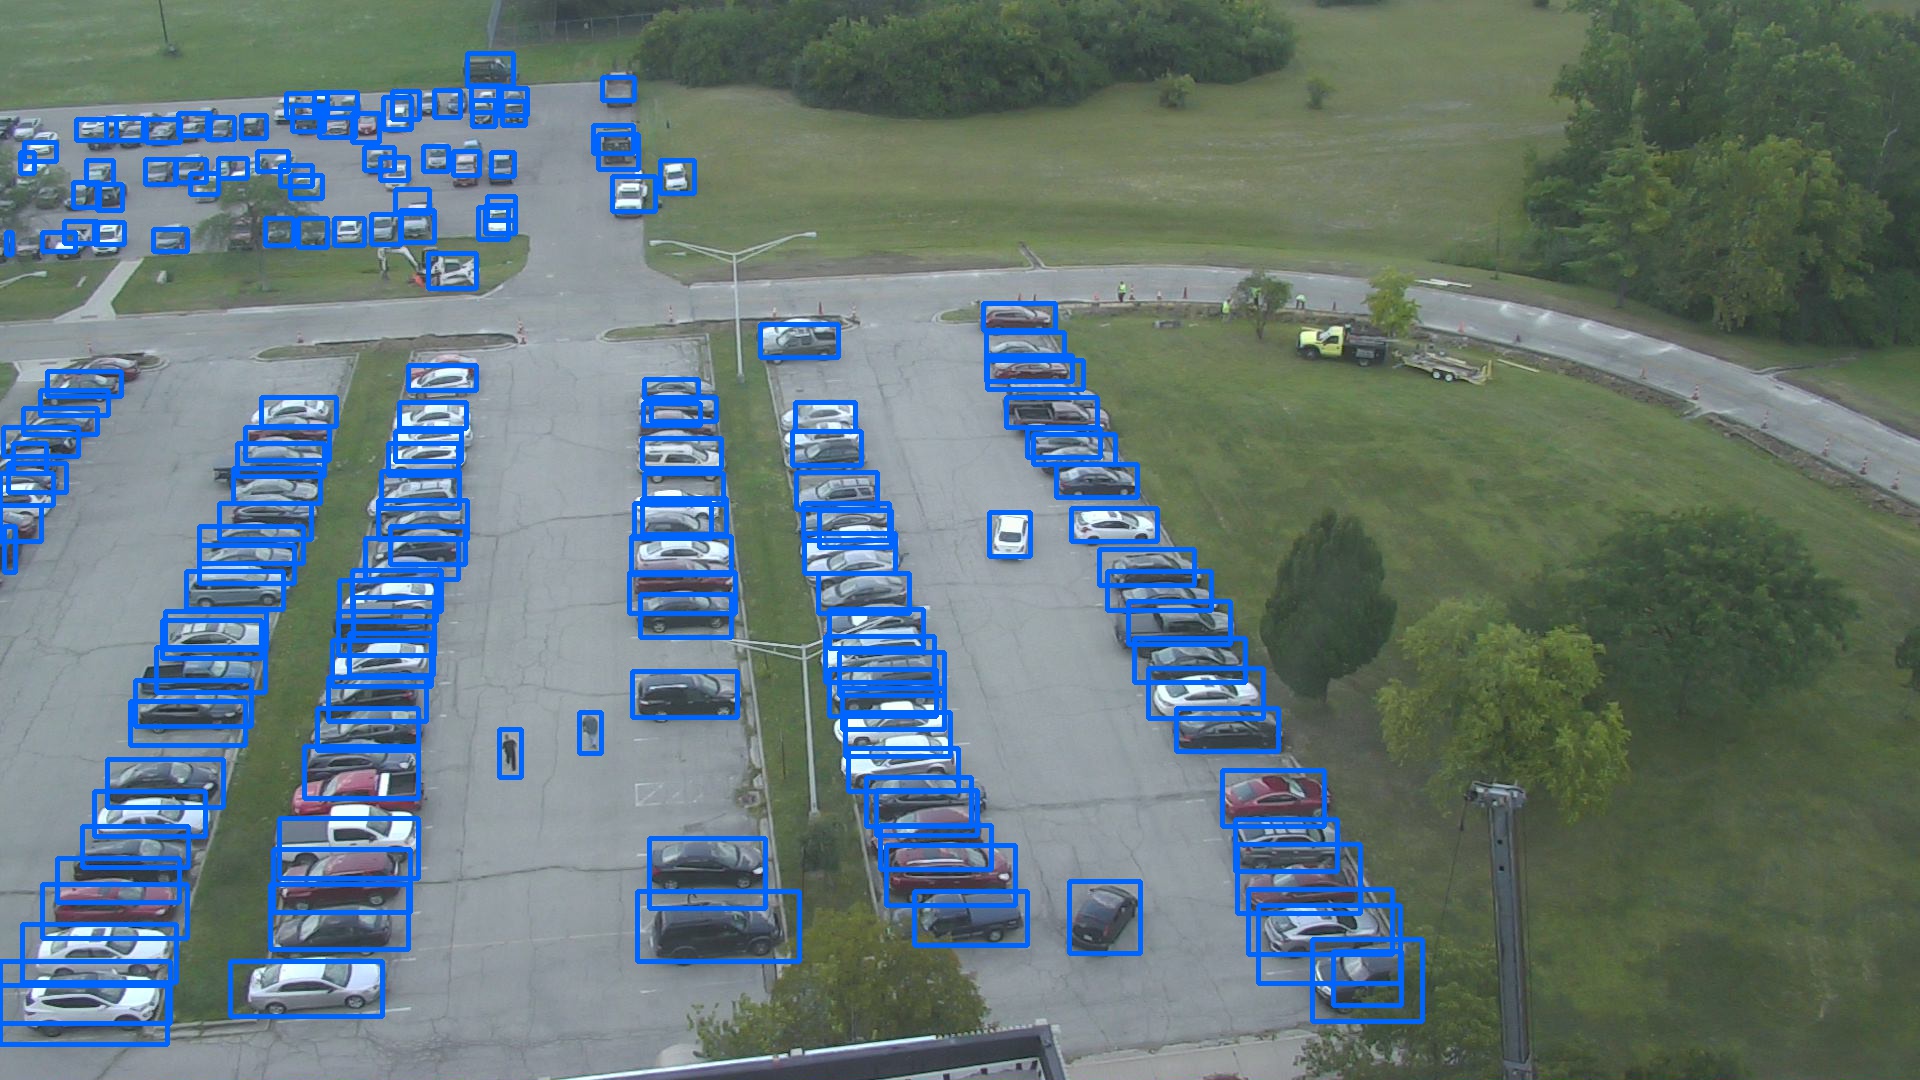
The irregularity in the medium size objects in Faster RCNN may be due to a quirk in the small AF Building Camera dataset. Shown in Figure 3 is a set images taken by the same camera at different times, with the last two sets of images taken only a few minutes apart. Both detectors do well when the cars are sparse and most have visible separation. However when the parking lot is full and the cars are densely packed the Faster RCNN sometimes fails to detect some of the vehicles while YOLO does a much better job, irregardless of illumination. Therefore the poor performance on medium sized objects by this Faster RCNN net may be due to its inability handle heavily overlapping objects in some images.
6 Conclusions
While the out of the box YOLO performs poorly on aerial imagery, a few modifications can greatly improve its performance. First making the net shallower to increase its output resolution. Second changing the net shape to more closer match the aspect ratio of the data. While the modified YOLO’s precision and recall is still typically a bit worse than Faster RCNN, it’s increased speed makes a it good option when near real-time vehicle detectors for aerial imagery are required.
References
- [1] M. Abadi, A. Agarwal, P. Barham, E. Brevdo, Z. Chen, C. Citro, G. S. Corrado, A. Davis, J. Dean, M. Devin, S. Ghemawat, I. Goodfellow, A. Harp, G. Irving, M. Isard, Y. Jia, R. Jozefowicz, L. Kaiser, M. Kudlur, J. Levenberg, D. Mané, R. Monga, S. Moore, D. Murray, C. Olah, M. Schuster, J. Shlens, B. Steiner, I. Sutskever, K. Talwar, P. Tucker, V. Vanhoucke, V. Vasudevan, F. Viégas, O. Vinyals, P. Warden, M. Wattenberg, M. Wicke, Y. Yu, and X. Zheng. TensorFlow: Large-scale machine learning on heterogeneous systems, 2015. Software available from tensorflow.org.
- [2] X. Chen and A. Gupta. An implementation of faster RCNN with study for region sampling. CoRR, abs/1702.02138, 2017.
- [3] M. Everingham, L. Van Gool, C. K. I. Williams, J. Winn, and A. Zisserman. The pascal visual object classes (voc) challenge. International Journal of Computer Vision, 88(2):303–338, June 2010.
- [4] R. Girshick. Fast r-cnn. In International Conference on Computer Vision (ICCV), 2015.
- [5] R. Girshick, J. Donahue, T. Darrell, and J. Malik. Rich feature hierarchies for accurate object detection and semantic segmentation. In Computer Vision and Pattern Recognition, 2014.
- [6] T. Huster and N. C. Gale. Deep learning for pedestrian detection in aerial imagery. In MSS Passive Sensors, 2016.
- [7] T. Lin, M. Maire, S. J. Belongie, L. D. Bourdev, R. B. Girshick, J. Hays, P. Perona, D. Ramanan, P. Dollár, and C. L. Zitnick. Microsoft COCO: common objects in context. CoRR, abs/1405.0312, 2014.
- [8] W. Liu, D. Anguelov, D. Erhan, C. Szegedy, S. E. Reed, C. Fu, and A. C. Berg. SSD: single shot multibox detector. CoRR, abs/1512.02325, 2015.
- [9] J. Redmon, S. K. Divvala, R. B. Girshick, and A. Farhadi. You only look once: Unified, real-time object detection. CoRR, abs/1506.02640, 2015.
- [10] J. Redmon and A. Farhadi. Yolo9000: Better, faster, stronger. arXiv preprint arXiv:1612.08242, 2016.
- [11] S. Ren, K. He, R. Girshick, and J. Sun. Faster R-CNN: Towards real-time object detection with region proposal networks. In Advances in Neural Information Processing Systems (NIPS), 2015.
- [12] T. H. Trieu. Darkflow. https://github.com/thtrieu/darkflow, 2017.
- [13] G. K. W. A. Sakla, N. T. Mundhenk. Deep multi-modal vehicle detection in aerial isr imagery. In IEEE Winter Conference on Applications of Computer Vision, 2017.
Appendix
| layer | filters | kernal size | net size |
|---|---|---|---|
| Input | - | - | 416 x 416 x 3 |
| Convolutional | 32 | 3 x 3 / 1 | 416 x 416 x 32 |
| Max Pooling | - | 2 x 2 / 2 | 208 x 208 x 32 |
| Convolutional | 64 | 3 x 3 / 1 | 208 x 208 x 64 |
| Max Pooling | - | 2 x 2 / 2 | 104 x 104 x 64 |
| Convolutional | 128 | 3 x 3 / 1 | 104 x 104 x 128 |
| Convolutional | 64 | 1 x 1 / 1 | 104 x 104 x 64 |
| Convolutional | 128 | 3 x 3 / 1 | 104 x 104 x 128 |
| Max Pooling | - | 2 x 2 / 2 | 52 x 52 x 128 |
| Convolutional | 256 | 3 x 3 / 1 | 52 x 52 x 256 |
| Convolutional | 128 | 1 x 1 / 1 | 52 x 52 x 128 |
| Convolutional | 256 | 3 x 3 / 1 | 52 x 52 x 256 |
| Max Pooling | - | 2 x 2 / 2 | 26 x 26 x 256 |
| Convolutional | 512 | 3 x 3 / 1 | 26 x 26 x 512 |
| Convolutional | 256 | 1 x 1 / 1 | 26 x 26 x 256 |
| Convolutional | 512 | 3 x 3 / 1 | 26 x 26 x 512 |
| Convolutional | 256 | 1 x 1 / 1 | 26 x 26 x 256 |
| Convolutional | 512 | 3 x 3 / 1 | 26 x 26 x 512 |
| Max Pooling | - | 2 x 2 / 2 | 13 x 13 x 512 |
| Convolutional | 1024 | 3 x 3 / 1 | 13 x 13 x 1024 |
| Convolutional | 512 | 1 x 1 / 1 | 13 x 13 x 512 |
| Convolutional | 1024 | 3 x 3 / 1 | 13 x 13 x 1024 |
| Convolutional | 1024 | 1 x 1 / 1 | 13 x 13 x 1024 |
| Convolutional | 1024 | 3 x 3 / 1 | 13 x 13 x 1024 |
| Convolutional | 1024 | 3 x 3 / 1 | 13 x 13 x 1024 |
| Convolutional | 1024 | 3 x 3 / 1 | 13 x 13 x 1024 |
| Route | - | - | 26 x 26 x 512 |
| Convolutional | 64 | 1 x 1 / 1 | 26 x 26 x 64 |
| Reorg | - | - | 13 x 13 x 256 |
| Route | - | - | 13 x 13 x 1280 |
| Convolutional | 1024 | 3 x 3 / 1 | 13 x 13 x 1024 |
| Convolutional | 125 | 1 x 1 / 1 | 13 x 13 x 125 |
| layer | filters | kernal size | net size |
|---|---|---|---|
| Input | - | - | 416 x 416 x 3 |
| Convolutional | 32 | 3 x 3 / 1 | 416 x 416 x 32 |
| Max Pooling | - | 2 x 2 / 2 | 208 x 208 x 32 |
| Convolutional | 64 | 3 x 3 / 1 | 208 x 208 x 64 |
| Max Pooling | - | 2 x 2 / 2 | 104 x 104 x 64 |
| Convolutional | 128 | 3 x 3 / 1 | 104 x 104 x 128 |
| Convolutional | 64 | 1 x 1 / 1 | 104 x 104 x 64 |
| Convolutional | 128 | 3 x 3 / 1 | 104 x 104 x 128 |
| Max Pooling | - | 2 x 2 / 2 | 52 x 52 x 128 |
| Convolutional | 256 | 3 x 3 / 1 | 52 x 52 x 256 |
| Convolutional | 128 | 1 x 1 / 1 | 52 x 52 x 128 |
| Convolutional | 256 | 3 x 3 / 1 | 52 x 52 x 256 |
| Max Pooling | - | 2 x 2 / 2 | 26 x 26 x 256 |
| Convolutional | 512 | 3 x 3 / 1 | 26 x 26 x 512 |
| Convolutional | 256 | 1 x 1 / 1 | 26 x 26 x 256 |
| Convolutional | 512 | 3 x 3 / 1 | 26 x 26 x 512 |
| Convolutional | 256 | 1 x 1 / 1 | 26 x 26 x 256 |
| Convolutional | 512 | 3 x 3 / 1 | 26 x 26 x 512 |
| Route | - | - | 52 x 52 x 256 |
| Convolutional | 64 | 1 x 1 / 1 | 52 x 52 x 64 |
| Reorg | - | - | 26 x 26 x 256 |
| Route | - | - | 26 x 26 x 768 |
| Convolutional | 1024 | 3 x 3 / 1 | 26 x 26 x 1024 |
| Convolutional | 125 | 1 x 1 / 1 | 26 x 26 x 30 |