11email: francesco.taddia@astro.su.se 22institutetext: Department of Astronomy, San Diego State University, San Diego, CA 92182, USA 33institutetext: Kavli IPMU (WPI), UTIAS, The University of Tokyo, Kashiwa, Chiba 277-8583, Japan 44institutetext: Benoziyo Center for Astrophysics, Weizmann Institute of Science, Rehovot 76100, Israel 55institutetext: Cahill Center for Astrophysics, California Institute of Technology, Pasadena, CA 91125, USA 66institutetext: Astronomy Department, University of California at Berkeley, Berkeley, CA 94720, USA 77institutetext: Lawrence Berkeley National Laboratory, 1 Cyclotron Road, MS 50B-4206, Berkeley, CA 94720, USA 88institutetext: Université de Lyon 1, Villeurbanne; CNRS/IN2P3, Institut de Physique Nucléaire de Lyon, F-69622, Lyon, France 99institutetext: Tsinghua Center for Astrophysics, Tsinghua University, Beijing 100084, China 1010institutetext: Centre de Physique des Particules de Marseille, Aix-Marseille Université, CNRS/IN2P3, 163 avenue de Luminy - Case 902 - 13288 Marseille Cedex 09, France
PTF11mnb: the first analog of supernova 2005bf
Abstract
Aims. We study PTF11mnb, a He-poor supernova (SN) whose light curves resemble those of SN 2005bf, a peculiar double-peaked stripped-envelope (SE) SN, until the declining phase after the main peak. We investigate the mechanism powering its light curve and the nature of its progenitor star.
Methods. Optical photometry and spectroscopy of PTF11mnb are presented. Light curves, colors and spectral properties are compared to those of SN 2005bf and normal SE SNe. A bolometric light curve is built and modeled with the SNEC hydrodynamical code explosion of a MESA progenitor star, as well as with semi-analytic models.
Results. The light curve of PTF11mnb turns out to be similar to that of SN 2005bf until 50 d, when the main (secondary) peaks occur at mag. The early peak occurs at 20 d, and is about 1.0 mag fainter. After the main peak, the decline rate of PTF11mnb is remarkably slower than what was observed in SN 2005bf, and it traces well the 56Co decay rate. The spectra of PTF11mnb reveal a SN Ic, with no traces of He unlike in the case of SN Ib 2005bf, although with velocities comparable to those of SN 2005bf. The whole evolution of the bolometric light curve is well reproduced by the explosion of a massive ( 7.8 ), He-poor star characterized by a double-peaked 56Ni distribution, a total 56Ni mass of 0.59 and an explosion energy of 2.21051 erg. Alternatively, a normal SN Ib/c explosion (M(56Ni)0.11 , = 0.21051 erg, 1 ) can power the first peak while a magnetar (with a magnetic field characterized by =5.01014 G, and a rotation period of ms) provides energy for the main peak. The early -band light curve can be fit with a shock-breakout cooling-tail or an extended envelope model, from which a radius of at least 30 is obtained.
Conclusions. We presented a scenario where PTF11mnb was the explosion of a massive, He-poor star, characterized by a double-peaked 56Ni distribution. In this case, the ejecta mass and the absence of He imply a large ZAMS mass () for the progenitor, which most likely was a Wolf-Rayet star, surrounded by an extended envelope formed either by a pre-SN eruption or due to a binary configuration. Alternatively, PTF11mnb could be powered by a SE SN with a less massive progenitor during the first peak and by a magnetar afterwards.
Key Words.:
supernovae: general – supernovae: individual: PTF11mnb, SN 2005bf, iPTF15dtg.1 Introduction
The majority of stripped-envelope (SE) supernovae (SNe) share rather similar light-curve properties (see e.g., Drout et al. 2011; Cano 2013; Bianco et al. 2014; Taddia et al. 2015; Lyman et al. 2016; Prentice et al. 2016; Taddia et al. 2017), with typical rise times of days in the optical, slower decline and peak magnitudes between 17 and 18 mag. Most of these SNe are inferred to have ejected , with energies of a few 1051 erg and 56Ni masses between 0.15–0.20 . Assuming these SNe gave birth to compact remnants with the mass of a neutron star, their rather modest ejecta masses suggest that SE SNe arise from relatively low-mass (M 15) progenitors, which then must have been stripped of their H/He envelopes by a companion star (e.g., Yoon et al. 2010; Eldridge et al. 2013; Lyman et al. 2016).
A few SE SN events show clearly different properties, with light curves characterized by a more complex morphology and different time scales. Two examples are SN 2011bm (Valenti et al. 2012) and iPTF15dtg (Taddia et al. 2016a) which are characterized by longer rise-times (30–40 d) and broader light curves. iPTF15dtg (and perhaps SN 2011bm) also exhibits an early declining phase in the optical light curves (Taddia et al. 2016a). These SNe may have large ejecta masses (10 ) compared to normal SE SNe, and might come from single massive stars. Another unusual SE SN is the double-peaked SN 2005bf. This transient was discovered by Monard et al. (2005) and became one of the most peculiar SE SNe ever observed. SN 2005bf has remained unique until the discovery of PTF11mnb, which we present in this paper.
Therefore, we start by reviewing the main properties of SN 2005bf as presented in the literature.
Anupama et al. (2005) reported optical photometry and spectroscopy around and post peak for SN 2005bf. This SN revealed a Type Ib (helium rich) spectrum at peak, which occurred unusually late for a SE SN (40 d). The peak bolometric magnitude of 18 mag was consistent with those of luminous SNe Ibc. Anupama et al. (2005) observed that the He i lines were less blueshifted than the Fe lines, and reported traces of H lines at 15000 km s-1. These authors suggested that SN 2005bf was the explosion of a massive He star with some H left.
Tominaga et al. (2005) reported that the light curve of SN 2005bf actually had two maxima, the first at 20 d and the main (secondary) peak at 40 d. After the second peak the light curve faded rapidly. Tominaga et al. (2005) noted that the He I lines strengthened and their velocities increased with time. A double-peaked 56Ni distribution was proposed to explain the two maxima, with a small amount at high velocity and most of the 56Ni at low velocity. The fast decline after peak could be due to -rays escaping from low-density regions. The evolution of the He lines was then explained by enhanced -ray deposition in the He layer with time, as these -rays were leaking out from the core. From their models, Tominaga et al. (2005) estimated a large ejecta mass (6–7 ), kinetic energy of ergs, and a large 56Ni mass (0.32 ). The progenitor was claimed to be a WN star, whose double-peaked 56Ni distribution could possibly be due to jets that did not reach the He layer.
Folatelli et al. (2006) presented observations of SN 2005bf covering the first 100 days after discovery. Their spectroscopic observations revealed that SN 2005bf exhibited increasingly stronger He lines. Furthermore, high velocity absorption lines were observed during the initial peak along with lower velocity line components (see also Parrent et al. 2007). The scenario favored by Folatelli et al. (2006) was an energetic and asymmetric explosion of a massive (8.3 ) WN star almost completely stripped of its H envelope. Folatelli et al. (2006) attributes the high velocity features, the early spectrum, and the existence of the first peak, to a polar explosion containing only part of the total mass; that early explosion was then followed by the explosion of the rest of the star, which produced the main peak and the helium-rich spectra.
Maeda et al. (2007) presents nebular spectra (300 d) and late-time photometry of SN 2005bf. The emission line analysis reveals a blueshift compatible with a blob or a unipolar jet (or self- absorption within the ejecta) containing only tenths of a solar mass of ejecta and a small amount (0.020.06 ) of 56Ni. The late-time photometry sets an upper limit of 0.08 for the 56Ni mass, in apparent contradiction to the high value derived from the main peak. To explain this discrepancy, and the fast decline of the light curve after peak, Maeda et al. (2007) suggest an alternative scenario where the powering source of SN 2005bf is a magnetar. The strong asymmetry of the explosion of SN 2005bf was also confirmed by the spectropolarimetric observations by Maund et al. (2007) and Tanaka et al. (2009).
In summary, SN 2005bf showed the following peculiarities: a) a unique double peak in the light curve, with the first maximum occurring at the same phase (20 d) and with the same absolute magnitude of a regular SN Ibc, while the main peak occurred relatively late (40 d); b) a fast decline post peak and a very low optical luminosity at late epochs; c) increasingly stronger and faster He lines; d) multiple velocity components for some of the lines.
In this paper, we present PTF11mnb, the first SN 2005bf-like event. With “SN 2005bf-like” we mean a SE SN with a first peak similar to that of a normal SN Ib/c, followed by a brighter peak occurring on a longer time scale. PTF11mnb was a He-poor (Type Ic) SN whose pre-main peak optical light curves closely resemble those of SN 2005bf. Both SNe show a double peak at similar phases and absolute magnitudes, but PTF11mnb declines slower after the main maximum. Furthermore, PTF11mnb never shows He in the spectrum and thus never becomes a Type Ib. For SN PTF11mnb, we suggest a scenario where the progenitor was a massive single star with a double-peaked 56Ni distribution powering the SN rather than a magnetar, even though we cannot exclude the presence of a central engine.
The structure of the paper is as follows: In Sect. 2 we describe the discovery, observations and data reduction; in Sect. 3 we present the host galaxy. Section 4 includes the analysis of the SN light curves, whereas Sect. 5 includes that of the SN spectra. In Sect. 6 we build and model the bolometric light curve of PTF11mnb. The main results are discussed in Sect. 7, whereas our conclusions are given in Sect. 8.
2 Observations and data reduction
The Palomar Transient Factory (Rau et al. 2009; Law et al. 2009) first detected PTF11mnb at RA 00:34:13.25 and DEC +02:48:31.4 (J2000.0) on JD 2455804.857 (Aug. 31 2011) (0.31 mag ) using the 48-inch Samuel Oschin telescope (P48) at Palomar Observatory, equipped with the 96 Mpixel mosaic camera CFH12K (Rahmer et al. 2008). The SN was not detected on JD 2455803.824 (i.e., 1.033 days before first detection) at limiting magnitude mag. In the following, we adopt the average between the epochs of last non-detection and discovery as the explosion date (JD 2455804.3410.516). Throughout the paper we express the phase in SN rest-frame days since explosion.
PTF11mnb was observed with P48 in the band until 60 d and until 50 days in the band. The P48 photometry was reduced with the FPipe pipeline presented by Fremling et al. (2016), which gives very similar results to those obtained by using the standard Palomar Transient Factory Image Differencing and Extraction (PTFIDE) pipeline (Masci et al. 2017). FPipe subtracts the host-galaxy template and performs point-spread-function (PSF) photometry on each SN image.
We also made use of the Palomar 60-inch telescope (P60; Cenko et al. 2006), with which we observed the SN in bands, starting at 20 d with the band (band coverage started from 40 d). The SN was detected for the last time at 140 days with P60. A P60 composite band image of PTF11mnb and its host galaxy from 28 Oct. 2011 is shown in the top panel of Fig. 1. The P60 images were also reduced with FPipe, making use of Sloan Digital Sky Survey (SDSS; Ahn et al. 2014) images as templates. We used the SDSS stars in the SN field to calibrate the P60 photometry. The final light curves are presented after combining magnitudes obtained on the same night. We summarize all the photometric observations in Table 1.
We present five optical spectra covering the epochs between one and five months after explosion. These spectra were obtained with four different telescopes: Keck I the Low Resolution Imaging Spectrometer (LRIS, Oke et al. 1995), the Palomar 200-inch Hale Telescope (P200) the Double Spectrograph (DBSP, Oke & Gunn 1982), the Kitt Peak National Observatory 4-meter telescope (KPNO4m) the Ritchey-Chretien Spectrograph (RC spec), and the University of Hawai’i 88-inch (2.2-meter) telescope (UH88) the Supernova Integrated Field Spectrograph (SNIFS). Spectral reductions were carried out with all the standard procedures, including wavelength calibration via an arc lamp, and flux calibration with a spectrophotometric standard star. In 2016 we also obtained a host-galaxy spectrum with the Telescopio Nazionale Galileo (TNG) the Device Optimized for the LOw RESolution (DOLORES). This host-galaxy spectrum is shown in the bottom panel of Fig. 1. Table 2 shows our spectral log.

3 Host galaxy
The host galaxy of PTF11mnb is named SDSS J003413.34024832.9. We determined its redshift to be 0.06030.0001 from the Gaussian fits of the H and [O iii] 5007 host-galaxy emission lines superimposed on the SN spectra (see Sect. 5), as well as from the host-galaxy spectrum obtained in 2016 (see Fig. 1). This redshift corresponds to a luminosity distance 268.5 Mpc and distance modulus 37.14 mag when WMAP 5-years cosmological parameters (Komatsu et al. 2009) are assumed.
Given the absence of any narrow Na i D absorption line at the host-galaxy redshift, we assume that no host extinction affected PTF11mnb. The Galactic extinction in the bands is 0.067 mag, 0.061 mag, 0.042 mag, and 0.031 mag (Schlafly & Finkbeiner 2011).
SDSS J003413.34024832.9 has integrated magnitudes of mag, mag, mag. Based on these absolute magnitudes, a global metallicity of 12log(O/H) 8.29 (, where , Asplund et al. 2009) is inferred from the luminosity-color-metallicity relation by Sanders et al. (2013), or if we make use of the luminosity-metallicity relation by Arcavi et al. (2010).
Since PTF11mnb sits on a bright H ii region, we could measure the host emission-line fluxes at the exact SN position from its spectra. Using the high signal-to-noise Keck spectrum, we derived the line ratios needed for the O3N2 method by Pettini & Pagel (2004), which resulted in a metallicity of 12log(O/H) 8.290.20 (). This value is lower than that for most of the normal SNe Ic (e.g., Sanders et al. 2012), and more similar to that of the explosion site of the peculiar SN Ic iPTF15dtg (Taddia et al. 2016a).
We also notice that the host galaxy of SN 2005bf shows larger metal abundances. From a Sloan Digital Sky Survey (SDSS) spectrum of an H ii region in a spiral arm of SN 2005bf’s host, only marginally closer to the host center than SN 2005bf itself, we measured an O3N2 oxygen abundance of 8.760.14, which is about solar (Asplund et al. 2009).
We summarize the main host-galaxy properties in Table 3.
4 Light curves

In Fig. 2 we present the light curves of PTF11mnb. The first detection in band occured at 15.63 mag. For 4 days (first three epochs) the light curve in the band shows an almost constant value (within the errors). Thereafter, the SN was observed rising faster in band and imaged in the band with P48. The -band light curve shows a steep rise of 1.3 mag from 5.2 d to 17.4 d. This is followed by a flatter phase until 21.3 days. This phase is also seen in the band as an early peak/plateau between 20 d and 27 d. Following this early peak, both and band rise to the main peak that occurs at 46.3 d and 52.2 d, respectively. PTF11mnb was also observed in and band starting from 36 d. The and band peaks occurred at 41.9 d and 48.1 d, respectively. We determined the maxima by fitting the light curves with low-order polynomials, marked in Fig. 2 by dashed lines.
The main peaks of PTF11mnb are quite broad (especially in the redder bands), and are characterized by 0.48, 0.53, 0.16, 0.24 mag in , , , , respectively.
After an almost linear decline that lasts until 106 d in and band and 93 d in the band, the late light curves show a shallow rebrightening (0.1 mag in and ) that peaks at 115 d in band and at 120 d in and band. The last detection occurs after this shallow bump, at 140 d ( and ) and 132 d ().
The comparison to the light curves of SN 2005bf reveals how these two events are similar, at least during the epochs up to and including the main peak. In Fig. 2 we show the absolute-magnitude light-curves of SN 2005bf from Folatelli et al. (2006) and Bianco et al. (2014) as solid colored lines. For SN 2005bf we assumed a distance modulus 34.561 mag, redshift 0.018913 (from NED), explosion epoch JD2453458, galactic extinction 0.163 mag, 0.148 mag, 0.102 mag, and 0.076 mag (redshift from NED111NASA/IPAC Extragalactic Database: https://ned.ipac.caltech.edu, distance modulus computed assuming the same cosmology as used for PTF11mnb, extinction from Schlafly & Finkbeiner 2011). Both the early band rise and the early and band peaks are similar in phase and absolute magnitude. However, the early peak in band is more pronounced in PTF11mnb than in SN 2005bf, where the -band light curve shows a change in curvature rather than a clear maximum. In band, both SNe show clear early maxima. SN 2005bf shows its main peak in , and band slightly earlier (3–10 d) than PTF11mnb, whereas the peak epoch is very similar in band. The peaks of SN 2005bf are only 0.2–0.3 mag fainter than those of PTF11mnb.
After the main peak, the light curves of SN 2005bf decline much faster than those of PTF11mnb. At 100 days, SN 2005bf has declined by 2.5 mag from peak in band, whereas PTF11mnb has declined by merely 1.0 mag in the same band.
We summarize the main light curve properties of PTF11mnb in Table 3.
The color evolution of PTF11mnb is similar to that of SN 2005bf, as shown in Fig. 3. The early light-curve peak (see bottom panel) corresponds to an early maximum in the colors, whereas the main light curve peak correspond to a minimum in the colors. These minima are followed by a rise in the values, in both SNe. PTF11mnb is slightly redder than SN 2005bf around the early peak, although it is bluer later on. For PTF11mnb we have late detections in and , and at epochs later than 90 days slowly becomes bluer. The colors of normal SE SNe, such as those of iPTF13bvn (Fremling et al. 2016) and SN 2011dh (Ergon et al. 2014; Ergon et al. 2015) shown in the figure, evolve differently. After the minimum in correspondence with the light-curve peak, the of these normal SE SNe becomes redder until 30 d and then slowly turns bluer.
5 Spectra
PTF11mnb was observed five times in spectroscopy, from 35 d until 141 d. The spectral sequence is shown in Fig. 4. The spectra will be available via WISeREP (Yaron & Gal-Yam 2012).
We did not removed the narrow emission lines due to the host galaxy from the SN spectra. These are well visible in Fig. 4. We can observe narrow H, H, [O iii] 4959,5007, [O ii] 3727, and S ii 6717,6731 emission lines. Beside the narrow emission lines, the host-galaxy continuum emission (which peaks in the blue, see Fig. 1) could not be completely removed and it is likely contaminating the continuum of the spectra, affecting their shape in particular at late epochs.
The spectra of PTF11mnb are similar to other SN Ic spectra, as illustrated in Fig. 5 (top panel). Some of the best SN Ic spectral fits obtained with SNID222Supernova Identification:
https://people.lam.fr/blondin.stephane/software/snid/ (Blondin & Tonry 2007) are shown for comparison, and they clearly match the features of PTF11mnb.
On the other hand, the spectra of PTF11mnb are remarkably different from those of SN 2005bf (see Fig. 5, top panel), which show increasingly stronger He lines. PTF11mnb never became a SN Ib.
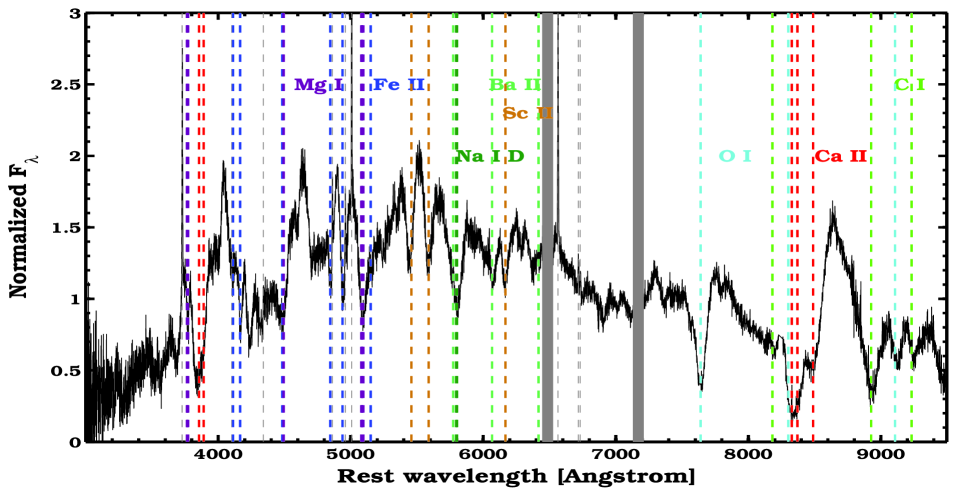
The spectra of PTF11mnb show the characteristic lines of a SN Ic dominating over the continuum from the second spectral epoch. We provide line identifications using the spectrum with best signal (+83 d) shown in Fig. 5 (bottom panel) and comparing with line identifications of SE SN spectra from the literature (Taubenberger et al. 2006; Parrent et al. 2007; Hunter et al. 2009). Neither H nor He lines are detected. The spectrum is dominated by Ca ii, O i and Fe ii lines. Ca ii and O i characterize the red part of the spectrum, with P-Cygni profiles. Lines from Na i D, Mg ii, and C i are also visible, as observed in other SE SNe (see e.g., Elmhamdi et al. 2006). We can also see lines due to Sc ii and Ba ii, which are not very common in SE SNe, but appear in SNe II (e.g., Taddia et al. 2016b).
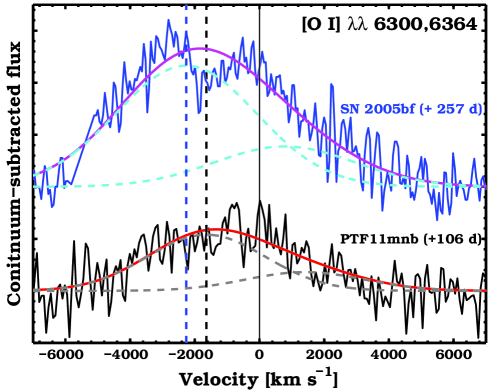
In the last two spectra, [O i] 6300,6364 is observed in emission. In Fig. 6 we observe that the emission lines [O i] 6300,6364 detected in the spectra of PTF11mnb at d are blueshifted. After continuum subtraction, the shape of these two lines can be reproduced by the sum of two Gaussians with the same FWHM, with peaks at 64 Å from each other, and having relative flux ratio of 1:3 (see Milisavljevic et al. 2010, for a similar analysis). This is also the case for the [O i] 6300,6364 lines in the nebular spectrum of SN 2005bf from Modjaz et al. (2008), which we show in Fig. 6. The individual Gaussian components are shown by dashed curves, the total best fit with solid curves for both SNe. The vertical dashed lines (black for PTF11mnb, blue for SN 2005bf) indicate that the blueshift is larger for SN 2005bf (2260 km s-1) than in PTF11mnb (1640 km s-1). We notice that, apart from the [O i] emission lines, the spectra of PTF11mnb are not fully nebular even at these late epochs.
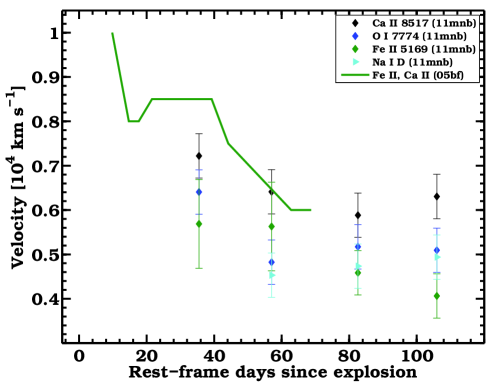
From the first four spectra we measured the P-Cygni absorption velocities of some of the most prominent lines. We report them in Fig. 7. Ca ii shows a constant velocity of about 6000 km s-1, O i 7774 is detected at about the same velocity in the first spectrum and later on at 5000 km s-1. A similar velocity is shown by Na i D and Fe ii 5169. The expansion velocities of PTF11mnb as measured from the Fe ii 5169 line are slower than those of normal SNe Ic (Modjaz et al. 2016) at similar epochs (4500 km s-1 instead of 7000 km s-1). SN 2005bf display higher velocities than PTF11mnb when we compare the Fe ii lines, and PTF11mnb does not have spectra taken early enough to check if there were fast velocity components in Fe ii and Ca ii as observed in SN 2005bf (see Folatelli et al. 2006).
6 Modeling
6.1 Bolometric properties
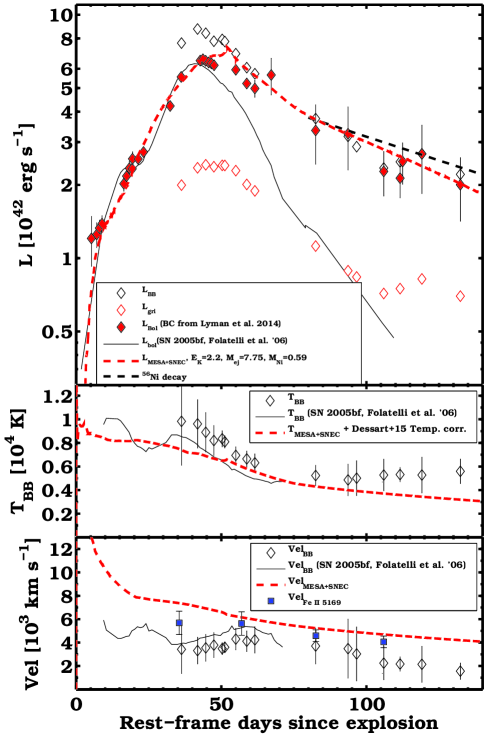
In order to build a quasi-bolometric light curve of PTF11mnb, we make use of its broadband photometry. We interpolate the light curves to the epochs of the P60 band. Then we convert the interpolated magnitudes (corrected for the extinction) into fluxes, at the effective wavelength of the corresponding filters (Fukugita et al. 1996). The resulting spectral energy distributions (SEDs) are integrated and multiplied by 4D2, where is the luminosity distance to the supernova. By doing this, we obtain , which is marked by empty red diamonds in Fig. 8 (top panel). To account for the emission at bluer and redder wavelengths, we fit the SEDs with a black-body (BB) function, which we then integrated to derive (empty black diamonds in Fig. 8, top panel). As the BB fit tends to overestimate the flux in the blue, where metal lines typically absorb a significant fraction of flux, we resort to use the bolometric corrections by Lyman et al. (2014) along with and band in order to derive the final bolometric light curve (, red diamonds in the top panel of Fig. 8). By using only and along with the bolometric corrections, we also produce the rising part of the bolometric light curve, since only those two filters were used at that phase. We notice that, among other events, also SN 2005bf was used by Lyman et al. (2014) to contruct the bolometric corrections for SE SNe that we use here for PTF11mnb. Our bolometric light curve is compared to that of SN 2005bf from Folatelli et al. (2006) in the top panel of Fig. 8. The two light curves are almost identical until and including peak, thereafter SN 2005bf drops much faster, whereas PTF11mnb seems to follow the decay rate of 56Co (marked by a black dashed line), with the slope of at epochs later than 70 d being 0.0110.03 mag d-1.
As a byproduct of the BB fit to the SEDs, we also obtain the temperature and the velocity evolution (derived from the BB radius divided by the time since explosion) of PTF11mnb, reported in the central and bottom panels of Fig. 8 (black diamonds). This evolution is rather similar to that of SN 2005bf (Folatelli et al. 2006), which is marked by a solid black line. A maximum in the temperature is reached around the epoch of the second light curve peak in both SNe, as already suggested by the color evolution (Fig. 3). The velocity has a peak around 60 d in both SNe.
6.2 Double-peaked 56Ni distribution scenario
The bolometric light curve of PTF11mnb, as well as its velocity and temperature evolution, can be reproduced by a model similar to that suggested for SN 2005bf by Tominaga et al. (2005) and Folatelli et al. (2006). This considers the explosion of a massive star characterized by a double-peaked distribution of 56Ni. A relatively small fraction of 56Ni in the outer layers makes it possible to power the early peak. A larger fraction of 56Ni situated deeper in the ejecta allows us to reproduce the main peak. In the case of SN 2005bf, the post main-peak decline was fast and required an artificially reduced gamma-ray trapping in this scenario. The late-time photometry of SN 2005bf could not be reproduced with a radioactive model, so a magnetar was invoked by Maeda et al. (2007). Contrarily to SN 2005bf, we do not need to artificially reduce the gamma-ray opacity by a factor of 10 to match the post main peak bolometric light curve. The slow decline of PTF11mnb is instead fully consistent with the decay rate of 56Co (see black dashed line in Fig. 8).
As the first step to model PTF11mnb, we produced a massive (final mass 9.5 ) pre-SN star with the Modules for Experiments in Stellar Astrophysics (MESA; Paxton et al. 2011), similar to what was used by Folatelli et al. (2006) to model SN 2005bf. We started from a star with initial mass 85 and a slightly sub-solar metallicity (Z0.01), consistent with what we inferred for the location of PTF11mnb (see Sect. 3). We set the star rotation velocity to 350 km s-1. The rotation and the initial mass were adjusted to reproduce the desired final mass, and at the same time to strip the entire hydrogen envelope and the helium envelope. The final progenitor star model contains merely 0.6 of He in the outer part of the ejecta, which may be consistent with a SN Ic progenitor (see for example the progenitor star model 5p11 in Dessart et al. 2015).
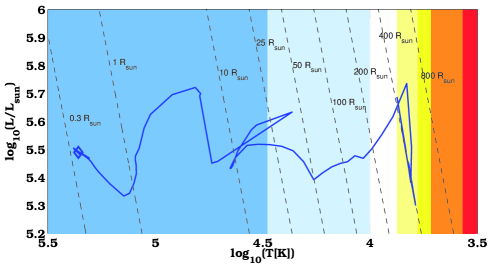
In Fig. 9 we report the evolution of this star in the Hertzprung-Russell (HR) diagram, until collapse. In the final stage of its life this star sits in the Wolf-Rayet (WR) part of the HR diagram (see blue diamond), with high luminosity (105.5 solar luminosity), high temperature (almost 105.36 K) and a compact radius (0.35 ).
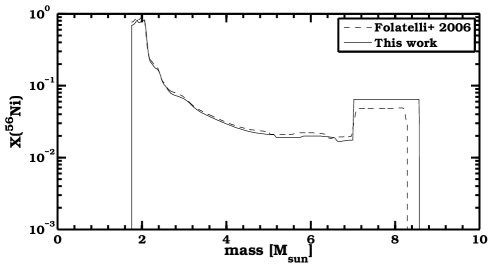
We exploded this star with the SuperNova Explosion Code (SNEC; Morozova et al. 2015). For an explosion energy of E 2.21051 erg (and a remnant mass of 1.7 , i.e. an ejecta mass of 7.8 ), and using the double-peaked 56Ni distribution plotted in Fig. 10 (which was slightly modified from the one of Folatelli et al. 2006), we reproduce the bolometric light curve of PTF11mnb rather accurately (see the thick red dashed lines in Fig. 8). The total 56Ni mass of this model is 0.59 . It is necessary to use a double-peaked 56Ni distribution to reproduce both the early and the main peak. We modified the SNEC code in order to include the non-uniform 56Ni distribution shown in Fig. 10.
The model is also able to somewhat reproduce the photospheric-velocity profile as measured from the Fe II line in the spectrum, as well as the temperature evolution. We notice that in order to directly compare the photospheric temperature from the SNEC model and the BB temperature from the fit of the SEDs, we corrected the SNEC temperature profile by the ratio between the photospheric temperature and the color temperature for SNe Ibc presented by Dessart et al. (2015) in their table A3.
An important assumption in the hydrodynamical model is that related to the opacity floor. Following Morozova et al. (2015), we have adopted a linear scaling of the opacity floor with metallicity. In particular, we started our model investigation with 0.01 cm2 g-1 at (in the envelope) and 0.025 cm2 g-1 in the core, where . The opacity floor value in the envelope is the same as adopted for SNe II and SNe IIb in Bersten et al. (2011) and Ergon et al. (2015), respectively. The opacity floor in the core is the same as adopted for hydrogen-poor, and helium-rich SNe (see Ergon et al. 2015). This value was calibrated using a sophisticated radiative transfer code, STELLA (Blinnikov & Bartunov 1993). However, we notice that the optimal value of the opacity floor for SNe Ic, i.e., for helium-poor SNe, has not been presented in the literature yet. Therefore, we started our model investigation by assuming that the opacity floor in the core is similar for SNe IIb and SNe Ic, which are both hydrogen poor. Our model with core opacity floor set to 0.025 cm2 g-1 succeeds in reproducing the velocity profile and the light curve. However, around peak it shows a narrow feature in the light curve that is not observed in our SN. By slightly modifying the opacity floor in the core, i.e., adopting 0.04 cm2 g-1, we could smooth the narrow feature around the peak of the light curve model while preserving the good match to the velocity profile from the Fe ii line. For larger values of core opacity floor, the light curve match is still good until 0.07 cm2 g-1 and acceptable adopting 0.1 cm2 g-1. However, the velocities for the models with higher core opacity-floor values are above those observed in our SN. For even higher opacity-floor values, in particular if we use the core opacity floor for hydrogen-rich SNe II presented by Bersten et al. (2011) (0.24 cm2 g-1) and used by Morozova et al. (2015), the light-curve model instead shows an extremely long rise time, which is not compatible with the observed light curve (the other parameters being the same).
6.3 Magnetar scenario
For SN 2005bf, Maeda et al. (2007) proposed a spinning magnetar as the main powering source of the light curve, based on the fast decline after the main peak, and on the late-time photometry. These properties were difficult to reconcile with a scenario where the radioactive decay was the powering mechanism.
If we fit the bolometric light curve after 30 d with a magnetar model (Kasen & Bildsten 2010), we obtain ejecta mass , kinetic energy erg, magnetic flux density , rotation period ms. Here we have assumed an expansion velocity at peak of 5600 km s-1 from the Fe ii velocity, and opacity . This simple model cannot reproduce the early peak, and therefore we fit only the later epochs (however, including all the epochs provides almost identical parameters). To reproduce also the early peak in the magnetar scenario, we consider the early light curve as possibly produced by a magnetar-induced shock breakout (SBO), as described by Kasen et al. (2016). Using the above derived parameters from the fit of the main peak with the magnetar model, we can derive the time of the SBO peak and its luminosity (Kasen et al. 2016, their eqs. 26 and 27). Both these values are off from what we actually observe in PTF11mnb (we obtained a peak epoch for the SBO of 83 days, with luminosity 3.51043 erg), and therefore we do not favor a magnetar as the energy source for the early peak.
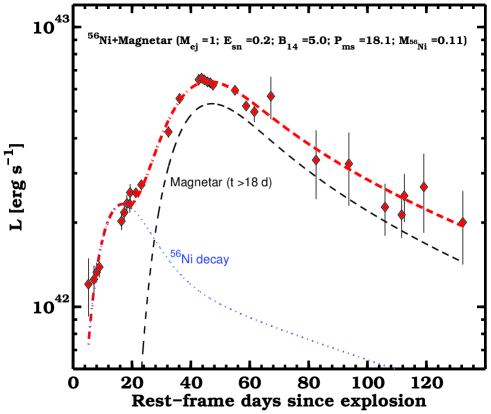
Since a magnetar-induced SBO model does not fit the early light curve of PTF11mnb, whereas the early peak was nicely fit by a 56Ni decay model (see Sect. 6.2), here we also consider a hybrid model where the first peak is due to a regular SN explosion powered by radioactivity, while the main peak is powered by a magnetar. It is indeed possible to fit the bolometric light curve with a simple Arnett model (Arnett 1982) representing the radioactive component, plus a magnetar model (Kasen & Bildsten 2010) that injects energy in the ejecta starting a few days after explosion. This is illustrated in Fig. 11, where the Arnett model is plotted as a dotted blue line and the magnetar model by a dashed black line. The sum of the two models, shown as a dashed red line, fit well to the bolometric light curve. The magnetar injection of energy would have to start after 18 days since the SN explosion, otherwise it is not possible to reproduce both peaks simultaneously.
In such a scenario, the SN explosion is characterized by , erg, , and the magnetar by and ms. We notice that the magnetar parameters in the hybrid model are different from those of the magnetar-only model previously described. Despite the nice fit of this hybrid model to the bolometric light curve, we still favor a progenitor scenario with the explosion of a massive star and a double-peaked 56Ni distribution, as it requires a single source of energy and less parameters, and particularly because it naturally fits the post main peak light curve.
6.4 Early light-curve modelling
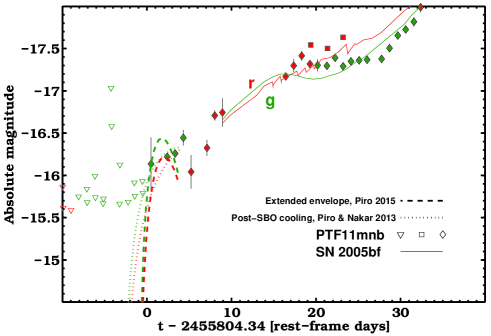
The early band light curve of PTF11mnb appears rather flat in the first three epochs, which occur merely 4 d after the last non-detection. To reproduce this early emission, we adopt the model by Piro & Nakar (2013) for the shock-break out cooling tail, assuming , as well as kinetic energy and ejecta mass from the hydrodynamical fit to the bolometric light curve. We solve for the explosion epoch and for the progenitor radius, obtaining a radius of 90–105 and an explosion epoch at 3 d since the average between discovery and last non-detection. This explosion epochs is consistent with the depth of the pre-discovery limits, as shown in Fig. 12. Explosions epochs earlier than that would not be compatible with the pre-detection limits.
The best fit for the first three epochs of band is shown in the top panel of Fig. 12 (green-dotted line). The corresponding band light curve model (red-dotted line) is also shown, however the first epoch of band occurs too late to better constrain the radius and the explosion epoch. In the left-bottom panel of Fig. 12 we show the reduced chi-square as a function of the progenitor radius and of the explosion epoch, from which we estimated the range of the best fit parameters. The best fit is shown by a white cross, and corresponds to a progenitor radius of 95 . This is rather large compared to that of a regular WR star, which is about two orders of magnitude more compact. The progenitor star might have exploded while its radius was more extended than that of a WR star. This is also why the hydrodynamical model could not reproduce this early emission, as we exploded a compact (0.35 ) star.
However, another possibility is that an extended envelope of low mass surrounded the WR progenitor star at the moment of the explosion. This is how we interpreted the early emission from the explosion of the massive SN Ic progenitor of iPTF15dtg (Taddia et al. 2016a). If we fit the model by Piro (2015) that describes the early emission from a star with an extended envelope (again assuming the same opacity, ejecta mass, and explosion energy as in the previous model), we can solve for the radius and the mass of the outer envelope (and for the explosion epoch). We obtained an extended envelope of mass 0.11 and of radius 35 . These parameters are rather well constrained by the fit (see Fig 12, right-hand bottom panel). Here the best explosion epoch was fixed to occur merely one day before the average between discovery and last non detection, to optimize the fit to the first -band point. The best fit of the extended-envelope model to the band light curve is shown in Fig. 12 as a dashed green line. The corresponding -band model is shown with a red dashed line and it is not in contradiction with the first -band observation, which however occurs to late to be used for further constraints.
Discriminating between the two models is not easy as we lack multi-band coverage at that phase. With additional -band observations, we could have constrained the temperature and observed if was more similar to what is predicted by the extended-envelope model (Piro 2015), or by the shock-breakout cooling model (Piro & Nakar 2013). We could do that for iPTF15dtg (Taddia et al. 2016a), where we had multi-band coverage. We favor the extended-envelope model as the fit is slightly better and because PTF11mnb is somewhat similar to iPTF15dtg and SN 2011bm, where we inferred the presence of an extended envelope.
There could also be the possibility that the early emission is due to the afterglow of a long-duration GRB. We performed a search for a possible GRB association via the interplanetary network (IPN), as in Taddia et al. (2016a). In a longer interval that goes from seven days before discovery to discovery, seven sources are found in the catalog. However, when we cross-checked with the INTEGRAL archive for the source position, none of these sources turned out to be compatible with PTF11mnb.
7 Discussion
The post main-peak photometry of SN 2005bf seems to favor a magnetar as the powering source for that event (Maeda et al. 2007). In the case of PTF11mnb, its slow decline rate instead trace the 56Co decay, with no need for adjusting the gamma-ray escape fraction (as in SN 2005bf, see e.g., Tominaga et al. 2005).
A magnetar cannot be excluded as the main source of the second peak, but 56Ni decay appears to be a simpler explanation. In favor of the magnetar scenario we might consider the shallow bump observed in the redder bands at 120 d, since a rapidly rotating central engine might produce some variability in the light curve (see e.g., Nicholl et al. 2016). However, a shallow bump in the redder light curves after peak could be produced by the transition of Fe iii ions to Fe ii ions as in SNe Ia (see also Roy et al. 2016). We do not have any signs of circumstellar interaction at late epochs that might explain this bump.
As outlined in the study presented in Taddia et al. (2016a), with our hydrodynamical model we did not intend to explore the entire parameter space, but rather fixed a few parameters based on the previous models of SN 2005bf and on the information about PTF11mnb (in particular the ejecta mass, the helium-poor composition, the metallicity of the SN location, and the double-peaked 56Ni distribution).
No asymmetry was taken into account when modeling the bolometric light curve. The nebular oxygen line at 6300 Å does suggest a slightly lower degree of asymmetry as compared to the case of SN 2005bf, however the double-peaked 56Ni distribution is likely produced by jets (e.g., see Tominaga et al. 2005 about SN 2005bf).
With PTF11mnb we found indications that some SNe Ic might come from massive () progenitors characterized by an early emission compatible with the presence of extended material surrounding the progenitor star. The presence of material surrounding the SN at the moment of explosion might be explained in different ways. There are models pointing to massive WR stars that can inflate a tiny quantity of mass thereby producing a halo structure around the progenitor core (e.g., Ishii et al. 1999). However, in these cases the inflated mass is order of magnitudes lower than what we inferred for PTF11mnb.
Another explanation could be that this material is the result of a strong progenitor eruption. Enhanced mass loss due to eruptions just prior to explosion has been inferred for several SN progenitors (e.g., Ofek et al. 2014) and there are also models predicting these events (Shiode & Quataert 2014). In the cases of the SE SNe 2006jc (Pastorello et al. 2007) and PTF11qcj (Corsi et al. 2014) eruptions were observed before the final explosion. If we assume that a wind with a velocity of 103 km s-1 from the progenitor produced the shell (a value that is typical for WR stars winds), then an extremely high and nonphysical (above 102 yr-1) mass-loss rate lasting about 7 hrs would be needed to allocate 0.11 at a distance of 35 . However, in the case of an eruption, the envelope might not be in hydrostatic equilibrium with the star (see Nakar & Piro 2014, and Piro 2015), therefore in this case we cannot asses its mass with precision, and therefore the estimate of the mass-loss rate would be unreliable. Also, if we assume lower eruption velocities the mass-loss rate would be more physical (e.g., 1 yr-1 for about 1 month if we assume a velocity of 10 km s-1 ). We note that, according to the models of Shiode & Quataert (2014), 10-3–1 can be inflated up to 10–100 in a time scale of month to decades, which would be in agreement with the last estimate.
The envelope might also be produced during a common envelope phase in a binary scenario (Chevalier 2012), as it cannot be excluded that our massive progenitor was part of a binary system.
PTF11mnb is the only 2005bf-like SN in the PTF/iPTF sample of CC SNe. One single case corresponds to an observed fraction of 0.12% of the CC SNe and 0.51% of the SE SNe (including SNe IIb) within (i)PTF. Given their peak luminosity and relatively long rise time, 2005bf-like events should be easier to discover than normal SE SNe. This means they are likely even rarer.
If we assume that only stars with 85 can give rise to these events, and adopt a normal Salpeter initial mass function (IMF), then we obtain in the single star progenitor scenario that 4% of CC SNe are formed from stars above that initial mass. Therefore, to match the rate of these events, some additional special conditions must occur in 3% of these massive stars for a SN 2005bf like event to occur. It could also be that most of these very massive stars produce failed SNe, as concluded by Smartt (2015).
Ultimately, the similarities between PTF11mnb and SN 2005bf might indicate that the two events share a common powering mechanism, which the analysis of PTF11mnb suggests to be a double-peaked 56Ni distribution. SN 2005bf would be different compared to PTF11mnb after peak due to a larger gamma-ray escape, possibly related to the geometry of the explosion. However, it is not excluded that both SN 2005bf and PTF11mnb are powered by a magnetar as proposed by Maeda et al. (2007) for SN 2005bf, with the magnetar fortuitously mimicking the 56Ni decay in the case of PTF11mnb.
8 Conclusions
We have presented observations for PTF11mnb, a SN Ic whose early and main-peak light curves resemble those of SN 2005bf. PTF11mnb never shows He in its spectra, contrarily to SN 2005bf.
Its slowly declining light curve suggests that a doubled-peaked 56Ni distribution powers both light curve peaks, with most of the 56Ni located in the center. Based on the large ejecta mass implied by the late-time main peak, the progenitor star of PTF11mnb could have been a massive, possibly single WR star, which was entirely stripped of its hydrogen and helium envelope.
However, a hybrid model with a magnetar powering the main peak, and a normal SN explosion powering the first peak (as suggested for SN 2005bf) cannot be excluded. In this case the ejecta mass would be significantly lower.
The early band light curve emission suggests the presence of an extended envelope surrounding the progenitor of PTF11mnb, as in the case of other massive SN Ic progenitors.
Acknowledgements.
We gratefully acknowledge the support from the Knut and Alice Wallenberg Foundation. Based on observations obtained with the Samuel Oschin 48-inch Telescope and the 60-inch Telescope at the Palomar Observatory as part of the intermediate Palomar Transient Factory (iPTF) project, a scientific collaboration among the California Institute of Technology, Los Alamos National Laboratory, the University of Wisconsin, Milwaukee, the Oskar Klein Center, the Weizmann Institute of Science, the TANGO Program of the University System of Taiwan, and the Kavli Institute for the Physics and Mathematics of the Universe. The Oskar Klein Centre is funded by the Swedish Research Council. We thank I. Arcavi, A. Horesh, T. Kupfer, D. Levitan, T. Matheson, G. Smadja, S. Tendulkar, and D. Xu for their help with the spectral observations and their early reductions. We thank Y. Cao, J. Surace, R. Laher, F. Masci, U. Rebbapragada, and P. Woźniak for their contribution to the iPTF project. This work is partly based on observations made with DOLoRes@TNG. A.G.-Y. is supported by the EU/FP7 via ERC grant No. 725161, the Quantum Universe I-Core program by the Israeli Committee for planning and funding, and the ISF, Minerva and ISF grants, WIS-UK “making connections”, and Kimmel and YeS awards. G.S. acknowledges support from the Lyon Institute of Origins under grant ANR-10-LABX-66.References
- (1)
- Ahn et al. (2014) Ahn, C. P., Alexandroff, R., Allende Prieto, C., et al. 2014, ApJS, 211, 17
- Anupama et al. (2005) Anupama, G. C., Sahu, D. K., Deng, J., et al. 2005, ApJ, 631, L125
- Arcavi et al. (2010) Arcavi, I., Gal-Yam, A., Kasliwal, M. M., et al. 2010, ApJ, 721, 777
- Arnett (1982) Arnett, W. D. 1982, ApJ, 253, 785
- Asplund et al. (2009) Asplund, M., Grevesse, N., Sauval, A. J., & Scott, P. 2009, ARA&A, 47, 481
- Bersten et al. (2011) Bersten, M. C., Benvenuto, O., & Hamuy, M. 2011, ApJ, 729, 61
- Bianco et al. (2014) Bianco, F. B., Modjaz, M., Hicken, M., et al. 2014, ApJS, 213, 19
- Blinnikov & Bartunov (1993) Blinnikov, S. I., & Bartunov, O. S. 1993, A&A, 273, 106
- Blondin & Tonry (2007) Blondin, S., & Tonry, J. L. 2007, ApJ, 666, 1024
- Cano (2013) Cano, Z. 2013, MNRAS, 434, 1098
- Cenko et al. (2006) Cenko, S. B., Fox, D. B., Moon, D.-S., et al. 2006, PASP, 118, 1396
- Chevalier (2012) Chevalier, R. A. 2012, ApJ, 752, L2
- Corsi et al. (2014) Corsi, A., Ofek, E. O., Gal-Yam, A., et al. 2014, ApJ, 782, 42
- Dessart et al. (2016) Dessart, L., Hillier, D. J., Woosley, S., et al. 2016, MNRAS, 458, 1618
- Dessart et al. (2015) Dessart, L., Hillier, D. J., Woosley, S., et al. 2015, MNRAS, 453, 2189
- Drout et al. (2011) Drout, M. R., Soderberg, A. M., Gal-Yam, A., et al. 2011, ApJ, 741, 97
- Eldridge et al. (2013) Eldridge, J. J., Fraser, M., Smartt, S. J., Maund, J. R., & Crockett, R. M. 2013, MNRAS, 436, 774
- Elmhamdi et al. (2006) Elmhamdi, A., Danziger, I. J., Branch, D., et al. 2006, A&A, 450, 305
- Ergon et al. (2015) Ergon, M., Jerkstrand, A., Sollerman, J., et al. 2015, A&A, 580, A142
- Ergon et al. (2014) Ergon, M., Sollerman, J., Fraser, M., et al. 2014, A&A, 562, A17
- Folatelli et al. (2006) Folatelli, G., Contreras, C., Phillips, M. M., et al. 2006, ApJ, 641, 1039
- Fremling et al. (2016) Fremling et al. in 2016, submitted
- Fukugita et al. (1996) Fukugita, M., Ichikawa, T., Gunn, J. E., et al. 1996, AJ, 111, 1748
- Hunter et al. (2009) Hunter, D. J., Valenti, S., Kotak, R., et al. 2009, A&A, 508, 371
- Ishii et al. (1999) Ishii, M., Ueno, M., & Kato, M. 1999, PASJ, 51, 417
- Kasen et al. (2016) Kasen, D., Metzger, B. D., & Bildsten, L. 2016, ApJ, 821, 36
- Kasen & Bildsten (2010) Kasen, D., & Bildsten, L. 2010, ApJ, 717, 245
- Komatsu et al. (2009) Komatsu, E., Dunkley, J., Nolta, M. R., et al. 2009, ApJS, 180, 330
- Law et al. (2009) Law, N. M., Kulkarni, S. R., Dekany, R. G., et al. 2009, PASP, 121, 1395
- Liu & Modjaz (2014) Liu, Y., & Modjaz, M. 2014, arXiv:1405.1437
- Lyman et al. (2016) Lyman, J. D., Bersier, D., James, P. A., et al. 2016, MNRAS, 457, 328
- Lyman et al. (2014) Lyman, J. D., Bersier, D., & James, P. A. 2014, MNRAS, 437, 3848
- Maeda et al. (2007) Maeda, K., Tanaka, M., Nomoto, K., et al. 2007, ApJ, 666, 1069
- Masci et al. (2017) Masci, F. J., Laher, R. R., Rebbapragada, U. D., et al. 2017, PASP, 129, 014002
- Maund et al. (2007) Maund, J. R., Wheeler, J. C., Patat, F., et al. 2007, MNRAS, 381, 201
- Milisavljevic et al. (2010) Milisavljevic, D., Fesen, R. A., Gerardy, C. L., Kirshner, R. P., & Challis, P. 2010, ApJ, 709, 1343
- Modjaz et al. (2016) Modjaz, M., Liu, Y. Q., Bianco, F. B., & Graur, O. 2016, ApJ, 832, 108
- Modjaz et al. (2008) Modjaz, M., Kirshner, R. P., Blondin, S., Challis, P., & Matheson, T. 2008, ApJ, 687, L9
- Monard et al. (2005) Monard, L. A. G., Moore, M., & Li, W. 2005, IAU Circ., 8507, 1
- Morozova et al. (2015) Morozova, V., Piro, A. L., Renzo, M., et al. 2015, ApJ, 814, 63
- Nakar & Piro (2014) Nakar, E., & Piro, A. L. 2014, ApJ, 788, 193
- Nicholl et al. (2016) Nicholl, M., Berger, E., Smartt, S. J., et al. 2016, ApJ, 826, 39
- Ofek et al. (2014) Ofek, E. O., Sullivan, M., Shaviv, N. J., et al. 2014, ApJ, 789, 104
- Oke et al. (1995) Oke, J. B., Cohen, J. G., Carr, M., et al. 1995, PASP, 107, 375
- Oke & Gunn (1982) Oke, J. B., & Gunn, J. E. 1982, PASP, 94, 586
- Parrent et al. (2007) Parrent, J., Branch, D., Troxel, M. A., et al. 2007, PASP, 119, 135
- Pastorello et al. (2007) Pastorello, A., Smartt, S. J., Mattila, S., et al. 2007, Nature, 447, 829
- Paxton et al. (2011) Paxton, B., Bildsten, L., Dotter, A., et al. 2011, ApJS, 192, 3
- Pettini & Pagel (2004) Pettini, M., & Pagel, B. E. J. 2004, MNRAS, 348, L59
- Piro & Nakar (2013) Piro, A. L., & Nakar, E. 2013, ApJ, 769, 67
- Piro (2015) Piro, A. L. 2015, ApJ, 808, L51
- Prentice et al. (2016) Prentice, S. J., Mazzali, P. A., Pian, E., et al. 2016, MNRAS,
- Shiode & Quataert (2014) Shiode, J. H., & Quataert, E. 2014, ApJ, 780, 96
- Rahmer et al. (2008) Rahmer, G., Smith, R., Velur, V., et al. 2008, Proc. SPIE, 7014, 70144Y
- Rau et al. (2009) Rau, A., Kulkarni, S. R., Law, N. M., et al. 2009, PASP, 121, 1334
- Roy et al. (2016) Roy, R., Sollerman, J., Silverman, J. M., et al. 2016, A&A, 596, A67
- Sanders et al. (2012) Sanders, N. E., Soderberg, A. M., Levesque, E. M., et al. 2012, ApJ, 758, 132
- Sanders et al. (2013) Sanders, N. E., Levesque, E. M., & Soderberg, A. M. 2013, ApJ, 775, 125
- Schlafly & Finkbeiner (2011) Schlafly, E. F., & Finkbeiner, D. P. 2011, ApJ, 737, 103
- Smartt (2015) Smartt, S. J. 2015, PASA, 32, e016
- Taddia et al. (2017) Taddia, F., Stritzinger, M. D., Bersten, M., et al. 2017, arXiv:1707.07614
- Taddia et al. (2016a) Taddia, F., Fremling, C., Sollerman, J., et al. 2016, A&A, 592, A89
- Taddia et al. (2016b) Taddia, F., Sollerman, J., Fremling, C., et al. 2016, A&A, 588, A5
- Taddia et al. (2015) Taddia, F., Sollerman, J., Leloudas, G., et al. 2015, A&A, 574, A60
- Tanaka et al. (2009) Tanaka, M., Kawabata, K. S., Maeda, K., et al. 2009, ApJ, 699, 1119
- Taubenberger et al. (2006) Taubenberger, S., Pastorello, A., Mazzali, P. A., et al. 2006, MNRAS, 371, 1459
- Tominaga et al. (2005) Tominaga, N., Tanaka, M., Nomoto, K., et al. 2005, ApJ, 633, L97
- Valenti et al. (2012) Valenti, S., Taubenberger, S., Pastorello, A., et al. 2012, ApJ, 749, L28
- Yaron & Gal-Yam (2012) Yaron, O., & Gal-Yam, A. 2012, PASP, 124, 668
- Yoon et al. (2010) Yoon, S.-C., Woosley, S. E., & Langer, N. 2010, ApJ, 725, 940
| JD-2,455,000 | JD-2,455,000 | JD-2,455,000 | JD-2,455,000 | ||||
|---|---|---|---|---|---|---|---|
| (days) | (mag) | (days) | (mag) | (days) | (mag) | (days) | (mag) |
| 842.803 | 19.096(0.060) | 804.857 | 21.071(0.309) | 809.882 | 21.146(0.195) | 842.801 | 18.852(0.049) |
| 848.672 | 18.862(0.064) | 806.881 | 20.987(0.045) | 811.870 | 20.862(0.093) | 848.671 | 18.745(0.046) |
| 851.679 | 19.037(0.044) | 807.880 | 20.948(0.041) | 812.845 | 20.479(0.056) | 851.677 | 18.669(0.004) |
| 854.666 | 19.064(0.011) | 808.906 | 20.761(0.090) | 813.808 | 20.444(0.165) | 854.663 | 18.644(0.022) |
| 857.694 | 19.081(0.014) | 825.748 | 19.904(0.069) | 821.749 | 20.017(0.026) | 857.692 | 18.690(0.041) |
| 858.656 | 19.210(0.019) | 826.915 | 19.910(0.014) | 822.753 | 19.889(0.073) | 858.654 | 18.677(0.015) |
| 862.656 | 19.405(0.030) | 827.939 | 19.816(0.042) | 823.750 | 19.772(0.056) | 862.653 | 18.721(0.024) |
| 866.667 | 19.514(0.029) | 828.946 | 19.916(0.031) | 824.787 | 19.870(0.041) | 866.664 | 18.821(0.029) |
| 869.633 | 19.667(0.124) | 829.925 | 19.857(0.022) | 824.896 | 19.645(0.017) | 869.630 | 18.855(0.009) |
| 916.694 | 20.886(0.142) | 830.956 | 19.846(0.047) | 826.985 | 19.686(0.026) | 891.828 | 19.263(0.074) |
| 922.673 | 20.847(0.078) | 831.958 | 19.839(0.006) | 828.946 | 19.554(0.016) | 903.665 | 19.507(0.083) |
| 833.768 | 19.828(0.017) | 838.672 | 19.199(0.060) | 906.794 | 19.624(0.087) | ||
| 834.768 | 19.701(0.020) | 842.711 | 19.082(0.009) | 916.691 | 19.825(0.078) | ||
| 835.800 | 19.551(0.015) | 849.636 | 18.812(0.104) | 922.670 | 19.680(0.053) | ||
| 836.796 | 19.481(0.026) | 850.632 | 18.742(0.028) | 930.653 | 19.700(0.086) | ||
| 837.819 | 19.390(0.051) | 851.631 | 18.797(0.007) | 944.688 | 19.866(0.095) | ||
| 842.805 | 18.972(0.041) | 852.749 | 18.789(0.023) | 945.623 | 19.925(0.058) | ||
| 848.674 | 18.821(0.054) | 853.737 | 18.764(0.001) | 952.637 | 20.148(0.103) | ||
| 851.680 | 18.830(0.018) | 854.716 | 18.791(0.033) | ||||
| 854.668 | 18.901(0.000) | 862.655 | 18.694(0.016) | ||||
| 855.639 | 18.775(0.002) | 866.665 | 18.824(0.027) | ||||
| 856.728 | 18.775(0.011) | 869.632 | 18.867(0.019) | ||||
| 857.696 | 18.887(0.008) | 875.588 | 18.785(0.086) | ||||
| 857.729 | 18.819(0.020) | 891.830 | 19.364(0.146) | ||||
| 858.658 | 18.910(0.008) | 903.667 | 19.552(0.055) | ||||
| 858.732 | 18.850(0.027) | 916.692 | 19.815(0.072) | ||||
| 859.737 | 18.923(0.038) | 922.672 | 19.827(0.048) | ||||
| 861.654 | 18.921(0.005) | 923.610 | 19.700(0.055) | ||||
| 862.658 | 19.113(0.017) | 930.654 | 19.652(0.059) | ||||
| 862.715 | 19.058(0.029) | 944.690 | 19.887(0.103) | ||||
| 863.714 | 19.113(0.033) | 952.638 | 20.031(0.099) | ||||
| 864.729 | 19.164(0.023) | ||||||
| 865.792 | 19.177(0.027) | ||||||
| 866.668 | 19.296(0.023) | ||||||
| 869.638 | 19.420(0.064) | ||||||
| 903.670 | 20.684(0.130) | ||||||
| 916.695 | 20.759(0.099) | ||||||
| 923.612 | 20.618(0.101) | ||||||
| 930.658 | 20.625(0.163) | ||||||
| 944.693 | 20.672(0.171) |
| Date (UT) | JD-2,455,000 | PhaseaaRest frame days from explosion. | Telescope | Instrument | Range |
|---|---|---|---|---|---|
| (days) | (days) | (Å) | |||
| SN spectra | |||||
| 07 Oct. 2011 | 841.98 | +35.5 | UH88 | SNIFS | 33019701 |
| 30 Oct .2011 | 864.78 | +57.0 | P200 | DBSP | 300210293 |
| 26 Nov. 2011 | 891.92 | +82.6 | Keck I | LRIS | 300110297 |
| 21 Dec. 2011 | 916.68 | +105.9 | P200 | DBSP | 300110296 |
| 27 Jan. 2012 | 953.50 | +140.7 | KPNO4m | RC Spec | 35758138 |
| Host-galaxy spectrum | |||||
| 02 Sep. 2016 | … | … | TNG | DOLORES | 318910352 |
| Parameters | Value | Ref |
|---|---|---|
| SDSS J003413.34024832.9: | ||
| Position | Sect. 3 | |
| Abs. magnitude | mag | Sect. 3 |
| mag | ||
| mag | ||
| Redshift | Sect. 3 | |
| Distance | Mpc | Sect. 3 |
| Distance modulus | mag | Sect. 3 |
| Metallicity of the host | log(O/H)12 =8.290.20 | Sect. 3 |
| at the SN location (O3N2) | ||
| PTF11mnb: | ||
| Position | Sect. 2 | |
| Explosion epoch | JD 2455804.3410.516 | Sect. 2 |
| Total reddening toward SN: | mag | Sect. 3 |
| Phase of the main peak, in | 41.9 d | Sect. 4 |
| rest-frame days since explosion | 46.3 d | |
| 52.2 d | ||
| 48.1 d | ||
| Peak abs. magnitude | 18.25 mag | Sect. 4 |
| 18.37 mag | ||
| 18.45 mag | ||
| 18.52 mag | ||
| 0.48 mag | Sect. 4 | |
| 0.53 mag | ||
| 0.16 mag | ||
| 0.24 mag |