The SCUBA-2 850 follow-up of WISE-selected, luminous dust-obscured quasars
Abstract
Hot dust-obscured galaxies (Hot DOGs) are a new population recently discovered in the WISE All-Sky survey. Multiwavelength follow-up observations suggest that they are luminous, dust-obscured quasars at high redshift. Here we present the JCMT SCUBA-2 850 follow-up observations of 10 Hot DOGs. Four out of ten Hot DOGs have been detected at level. Based on the IR SED decomposition approach, we derive the IR luminosities of AGN torus and cold dust components. Hot DOGs in our sample are extremely luminous with most of them having . The torus emissions dominate the total IR energy output. However, the cold dust contribution is still non-negligible, with the fraction of the cold dust contribution to the total IR luminosity being dependent on the choice of torus model. The derived cold dust temperatures in Hot DOGs are comparable to those in UV bright quasars with similar IR luminosity, but much higher than those in SMGs. Higher dust temperatures in Hot DOGs may be due to the more intense radiation field caused by intense starburst and obscured AGN activities. Fourteen and five submillimeter serendipitous sources in the 10 SCUBA-2 fields around Hot DOGs have been detected at and levels, respectively. By estimating their cumulative number counts, we confirm the previous argument that Hot DOGs lie in dense environments. Our results support the scenario in which Hot DOGs are luminous, dust-obscured quasars lying in dense environments, and being in the transition phase between extreme starburst and UV-bright quasars.
1 Introduction
Massive galaxies have been thought to co-evolve with their central supermassive black holes (Alexander & Hickox, 2012; Kormendy & Ho, 2013). In the co-evolution scenario, starburst galaxies, such as ultraluminous infrared galaxies (ULIRGs; Sanders & Mirabel 1996) and sub-millimeter galaxies (SMGs; Blain et al. 2002; Casey et al. 2014), ultraviolet (UV) bright quasars (QSOs) and massive early-type galaxies (ETGs) have been proposed to form an evolutionary sequence (Sanders et al., 1988; Hopkins et al., 2008). Luminous dust-obscured QSOs represent a brief transition phase from starburst galaxies to unobscured QSOs. It is important to understand this obscured phase, especially at when both cosmic star formation and black-hole growth reach their peaks (Reddy et al., 2008; Brandt & Alexander, 2015). However, it is not easy to select large samples of obscured QSOs in the normal UV/optical and X-ray surveys due to dust obscuration. Dust absorbs the UV and optical radiations from star formation and the black-hole accretion disk, and re-emits at far-IR/(sub-)mm wavelengths, making them be very luminous in the IR but faint at UV and optical wavelengths.
NASA’s Wide-field Infrared Survey Explorer (WISE ; Wright et al. 2010) performed an all-sky survey with images in four mid-IR bands (W1,W2,W3 and W4) at wavelengths of 3.4 , 4.6 , 12 and 22 , providing the sensitivity to detect luminous dust-obscured QSOs. One of the primary science objectives for WISE is to identify the most luminous ULIRGs in the Universe. In order to achieve this goal, a new color-selected method (so-called W1W2-dropouts) with all WISE four bands has been recently introduced and proven to be very successful (Eisenhardt et al., 2012; Wu et al., 2012). This method searched the luminous dust-obscured galaxies, which are prominent in the WISE 12 or 22 bands, and faint or undetected in the 3.4 and 4.6 bands. Spectroscopic follow-up of about 150 galaxies selected with this method have shown that most of them are at redshift from 1 to 4 (Tsai et al., 2015; Assef et al., 2015). Given bright W3/W4 bands and high redshift, these galaxies should have very high mid-IR luminosities.
Various follow-up studies have provided additional aspects on understanding the physical properties of this population. Together with WISE photometry, continuum measurements at longer wavelengths with the Herschel Space Observatory (Pilbratt et al., 2010) PACS (Photodetector Array Camera and Spectrometer; Poglitsch et al. 2010) observations at 70 and 160 and SPIRE (Spectral and Photometric Imaging REceiver; Griffin et al. 2010) observations at 250, 350, and 500 (PI: P.R.M. Eisenhardt), the CSO (Caltech Submillimeter Observatory ) SHARC-II and Bolocam observations at 350, 450, 850 and 1100 (Wu et al., 2012) and the SCUBA-2 (Submillimeter Common-User Bolometer Array) 850 observations (Jones et al., 2014) provide the full IR spectral energy distributions (SEDs) of tens of these galaxies, which suggest that (1) they are indeed hyper-luminous with and even extremely luminous with (Tsai et al., 2015); (2) their IR luminosities are dominated by hot dust radiation which is heated by active galactic nuclei (AGN) instead of star formation. The mid-IR bright criterion is very similar to that of dust-obscured galaxies (DOGs; Dey et al. 2008). Following the terminology of Wu et al. (2012), these galaxies have been referred as hot, dust-obscured galaxies (Hot DOGs). The detailed IR SED decomposition confirmed that Hot DOGs have both extreme AGN and starburst activities and hot dust emission from AGN torus dominates the IR energy output (Fan et al., 2016b). Recent X-ray observations of several Hot DOGs with XMM-Newton, Chandra and NuSTAR (Stern et al., 2014; Assef et al., 2016; Piconcelli et al., 2015; Ricci et al., 2017) revealed that they are likely heavily dust-obscured, possibly Compton-thick AGN.
Both extreme AGN and starburst activities in Hot DOGs are likely triggered by major mergers, which has been suggested by the recent studies of the high resolution HST WFC3 NIR imaging (Fan et al. 2016a; but also see Farrah et al. 2017 for an opposite conclusion) and ALMA CO line imaging (Fan et al. 2017 in prep). Wu et al. (2017) measured the supermassive black hole (SMBH) masses via broad Hα emission lines, using Keck/MOSFIRE and Gemini/FLAMINGOS-2. They found substantial corresponding SMBH masses for these Hot DOGs (), and their derived Eddington ratios are close to unity (see also the similar results in Lonsdale et al. 2015 for a radio-selected Hot DOG sample). A recent ALMA [CII] observation of the most luminous Hot DOG W22460526 revealed an extended and highly turbulent ISM, arguing that it is blowing out its ISM isotropically (Díaz-Santos et al., 2016). Given the major-merger triggering scenario, high luminosities, high SMBH masses, high Eddington ratios and strong feedback, Hot DOGs, as luminous dust-obscured QSOs, are suggested to be in a key transition phase of massive galaxy evolution, linking starbursts and luminous unobscured quasars (Wu et al., 2012; Bridge et al., 2013; Díaz-Santos et al., 2016; Fan et al., 2016b; Wu et al., 2017).
Despite the dominance of AGN torus emission, cold dust emission related to star formation is non-negligible (Wu et al., 2012; Fan et al., 2016b). Constraining the contribution of cold dust emission will be very important to help understanding the co-growth of galaxy and SMBH during the dust-obscured phase. In this work, we present James Clerk Maxwell Telescope (JCMT) SCUBA-2 850 observations of ten Hot DOGs. With these long wavelength measurements, we try to constrain the contribution of cold dust emission compared to the AGN torus emission and study the SMG environment around Hot DOGs. In Section 2, we describe the sample selection, observations and data analysis. We introduce the IR SED decomposition method with two different model sets in Section 3. In Section 4, we present the results of IR SED fitting and the environmental studies around Hot DOGs. We discuss and summarize the results in Section 5 and Section 6, respectively. Throughout this work we assume a standard, flat CDM cosmology (Komatsu et al., 2011), with km s-1, , and .
2 Data and sample selection
2.1 Sample selection
The ten Hot DOGs reported here are selected from the WISE All-Sky Source catalog, which provides point-spread function-fitting magnitudes and uncertainties of four mid-IR bands (W1,W2,W3 and W4) at wavelengths of 3.4 , 4.6 , 12 and 22 (Wright et al., 2010; Cutri et al., 2013). The basic idea of Hot DOGs selection is to target those mid-IR luminous galaxies with faint or undetected W1/W2 bands, and prominent W3/W4 bands. The selected galaxies have W1 (Jy) and either W3 ( mJy) and W2 W4 , or W3 ( mJy) and W2 W3 (Eisenhardt et al., 2012; Wu et al., 2012).
For our purposes of SCUBA-2 follow-up, we required that the selected Hot DOGs: (1) had known spectroscopic redshift in the literature (Wu et al., 2012; Tsai et al., 2015). (2) had Herschel PACS and SPIRE observations. By using these criteria, we selected nineteen Hot DOGs. Among them, ten Hot DOGs were randomly chosen to observe by SCUBA-2 according to the JCMT queue-based flexible observing system.
| Source | R.A. | Decl. | Redshift | Exposure time | UT Date | 850 | |
|---|---|---|---|---|---|---|---|
| Name | (J2000) | (J2000) | (hr) | (mJy) | |||
| W01260529 | 01:26:11.96 | 05:29:09.6 | 2.937 | 2.0 | 2015 Nov 18, Dec 25-26 | 0.09,0.10 | 15.9 2.6 |
| W01342922 | 01:34:35.71 | 29:22:45.4 | 3.047 | 2.5 | 2015 Dec 25,27 | 0.09,0.10,0.12 | |
| 2016 Jan 7,Jun 4 | |||||||
| W0248+2705 | 02:48:58.81 | +27:05:29.8 | 2.210 | 1.0 | 2015 Dec 25 | 0.09 | |
| W04221028 | 04:22:48.82 | 10:28:32.0 | 2.227 | 2.0 | 2015 Nov 10,18 | 0.10,0.09 | |
| W0757+5113 | 07:57:25.07 | +51:13:19.7 | 2.277 | 2.0 | 2015 Oct 26-27 | 0.10,0.09 | |
| W0859+4823 | 08:59:29.94 | +48:23:02.3 | 3.245 | 1.5 | 2015 Oct 27-28 | 0.09,0.08 | 7.0 2.0 |
| W12482154 | 12:48:15.21 | 21:54:20.4 | 3.318 | 2.0 | 2015 May 12, Dec 25 | 0.09 | |
| W1838+3429 | 18:38:09.16 | +34:29:25.9 | 3.205 | 2.0 | 2015 Jun 1-2, Jul 16 | 0.11,0.12,0.09 | |
| W2201+0226 | 22:01:23.39 | +02:26:21.8 | 2.877 | 2.0 | 2015 May 26 | 0.10 | 17.2 2.5 |
| W22103507 | 22:10:11.87 | 35:07:20.0 | 2.814 | 2.0 | 2015 Apr 25, May 31 | 0.10, 0.09 | 12.3 3.1 |
| 2015 Jun 17, Jul 16 |
Notes.
a 2 upper limits at 850 m.
2.2 JCMT SCUBA-2 observations and photometry
Observations of the ten Hot DOGs were obtained using the JCMT SCUBA-2 camera, scheduled flexibly in 2015A and 2015B semesters (Program ID: M15AI06 and M15BI016), from 2015 April to 2016 June. During the observations, the precipitable water vapor (PWV) was in the range 2.0-3.0 mm, corresponding to the zenith atmospheric optical depth at 225 GHz: and the extinction coefficients at 450 and 850 : and (Dempsey et al., 2013). Even if both 450 and 850 measurements were taken simultaneously, 450 data couldn’t be used due to the high atmospheric opacity and noise levels.
All observations were carried out in SCAN mode using the so-called ‘DAISY’ pattern which provides a 12-arcminute-diameter map with uniform exposure-time coverage in the central 3-arcminute-diameter region. The full width at half maximum (FWHM) of the main beam at 850 is about 14.5 arcsecond (Holland et al., 2013). For seven out of ten targets, two hours of the total exposure time were spent, consisting of four separate 30-minutes-long scans. The remaining targets, W01342922, W0248+2705 and W0859+4823, had 150, 60 and 90 minutes exposure time, respectively. The calibration sources observed were Uranus and Mars, and also secondary calibrators from the James Clerk Maxwell Telescope (JCMT) calibrator list (Dempsey et al., 2013). Calibrations were taken before and after the target observations.
The SCUBA-2 maps were reduced using the Dynamic Iterative Map Maker (DIMM) within the STARLINK SubMillimeter User Reduction Facility (SMURF) data reduction package (Chapin et al., 2013). DIMM was used to produce a map for each 30-minutes-long scan by using mapmaker command with the ‘Blank Field configuration’ which is suitable for the faint point sources. Using the STARLINK PIpeline for Combining and Analyzing Reduced Deduced Data (PICARD) package, all maps for each target were mosaicked, cropped to a 90-arcsecond-radius circle, beam-match filtered with a 15-arcsecond FWHM Gaussian and calibrated with the flux conversion factors (FCFs). We adopted the FCFs value of 537 Jy pW-1 beam-1 for 850 data (Dempsey et al., 2013).
In Table 1, we present the result of SCUBA-2 850 photometry of the ten Hot DOGs . Four out of ten Hot DOGs (W01260529, W0859+4823, W2201+0226 and W22103507) have been detected at significance and their flux densities and uncertainties are included in Table 1. The remaining six Hot DOGs (W01342922, W0248+2705, W04221028, W0757+5113, W12482154 and W1838+3429) are undetected. Their upper limits have been presented in Table 1. The photometric method presented here is identical to that in Jones et al. (2014) towards a sub-sample of the same parent population of our targets. However, mainly due to the different observation conditions, our photometric results are slightly different from those in Jones et al. (2014). Our observations were in the range of JCMT Band 3 conditions while those of Jones et al. (2014) were in the better conditions (Band 2). The average depths reach 2.6 mJy and 1.8 mJy for our observations and Jones et al. (2014), respectively. Instead of 40% detection rate in our observations, a higher detection rate (60%) has been found in Jones et al. (2014).
2.3 Ancillary data
In order to construct the full infrared SED of the ten SCUBA-2 observed Hot DOGs, we combined the public WISE and Herschel photometry. We retrieved the WISE W3 and W4 photometry from the ALLWISE Data Release (Cutri et al., 2013). We used zero points of 29.04 and 8.284 Jy to convert W3 and W4 Vega magnitude to flux densities, respectively (Wright et al., 2010). All of the ten Hot DOGs in our sample had been observed by Herschel PACS (Poglitsch et al., 2010) at 70 and 160 , and SPIRE (Griffin et al., 2010) at 250, 350 and 500 . Both PACS and SPIRE data were retrieved from the Herschel Science Archive (HSA) and reduced using the Herschel Interactive Processing Environment (HIPE v14.2.1). The flux densities and uncertainties of PACS and SPIRE were measured using the identical method in Fan et al. (2016b).
3 IR SED fitting
In this section, we describe how to fit the observed IR SEDs of the ten Hot DOGs. We assume that their IR SEDs are mainly distributed by two components. One is the hotter AGN heated dust emission and the other is colder young stellar population heated dust emission. It is obvious that the fitting results are dependent on which model is used for each component. For the AGN heated dust emission, we have employed two kinds of torus models: the CLUMPY torus model by Nenkova et al. (2002); Nenkova et al. (2008a, b)111www.clumpy.org and the two-phase torus model by Siebenmorgen et al. (2015). For the young stellar population heated dust emission, we have employed a simple modified blackbody model (or a gray body, GB).
For the CLUMPY torus model, we use the newly calculated model database222http://www.pa.uky.edu/clumpy/models/clumpy_models_201410_tvavg.hdf5/. There are 6 free parameters in the CLUMPY torus model. We assume that the 6 free parameters have the uniform distributions within the following intervals: the number of clouds along a radial equatorial path , the ratio of the outer to the inner radii of the toroidal distribution , the viewing angle measured from the torus polar axis , the index of the radial density profile , the width parameter characterizing the angular distribution , and the effective optical depth of clumps . Given a set of parameter values, a model SED can be calculated. There are in total 1,247,400 model SEDs in the database.
For the two-phase torus model (Siebenmorgen et al., 2015), we use the provided SED library333http://www.eso.org/~rsiebenm/AGN/. Unlike the CLUPMY torus model, the two-phase torus model assumes that torus dust is not only distributed in a clumpy medium, but also a homogeneous disk. The SED of two-phase torus model has been computed with a self-consistent three dimensional radiative transfer code, with a set of model parameters including the viewing angle, the inner radius, the volume filling factor, optical depth of the clouds and the optical depth of the disk mid-plane.
To represent the cold dust emission, we employ a gray body model, which is defined as:
| (1) |
where is the Planck blackbody spectrum, is dust temperature. We adopt = 125m and =1.6, which are the typical values used for high redshift QSOs (Beelen et al., 2006; Wang et al., 2008, 2011). The dust temperature is set as a free parameter with a uniform prior truncated to the interval of /K)=[1,2].
Adopting a combination of the CLUMPY or two-phase torus model and a gray body, we implement the IR SED decomposition of the ten Hot DOGs in our sample by using an updated version of the Bayesian SED fitting code, BayeSED (Han & Han, 2012, 2014)444https://bitbucket.org/hanyk/bayesed/. BayeSED is designed to be a general purpose Bayesian SED fitting code. It can be used to fit the multiwavelength SEDs of galaxies with a combination of whatever SED models. A detailed description of BayeSED can be found in Fan et al. (2016b). Here we summarize several basic features of BayeSED. (1) By using principal component analysis (PCA), the SED library dimensionality can be reduced without sacrificing much accuracy. (2) The model SED at any position of the parameter space spanning the model SED library can be generated by employing a supervised machine learning method (K-Nearest Neighbors searching). (3) Instead of the traditional Markov Chain Monte Carlo (MCMC) algorithm, the multimodal nested sampling algorithm (MultiNest, Feroz & Hobson, 2008; Feroz et al., 2009) has been employed to obtain the posterior probability distribution function (PDF) of parameters.
4 Results
4.1 IR luminosities and dust temperatures
| CLUMPY torus + Gray body | Two-phase torus + Gray body | |||||
|---|---|---|---|---|---|---|
| Source | log | log | log | log | log | log |
| () | () | () | () | () | () | |
| W01260529 | 13.990.01 | 13.920.01 | 14.260.03 | 14.200.01 | - | 14.200.01 |
| W01342922 | 14.020.02 | 13.200.05 | 14.080.08 | 14.070.17 | 12.680.48 | 14.100.65 |
| W0248+2705 | 13.430.05 | 13.110.07 | 13.600.12 | 13.530.05 | - | 13.530.05 |
| W04221028 | 13.450.03 | 13.010.05 | 13.580.08 | 13.520.09 | 12.640.34 | 13.580.43 |
| W0757+5113 | 13.420.03 | 12.800.05 | 13.510.08 | 13.510.08 | 12.800.17 | 13.590.25 |
| W0859+4823 | 13.990.02 | 13.360.03 | 14.080.05 | 14.040.06 | - | 14.040.06 |
| W12482154 | 14.130.02 | 13.360.07 | 14.200.09 | 14.250.11 | 13.210.35 | 14.320.46 |
| W1838+3429 | 14.160.02 | - | 14.160.02 | 14.240.19 | - | 14.240.19 |
| W2201+0226 | 13.920.03 | 13.720.02 | 14.140.05 | 13.970.11 | 13.440.17 | 14.090.28 |
| W22103507 | 13.970.02 | 13.500.02 | 14.100.04 | 14.040.04 | 13.520.03 | 14.160.07 |
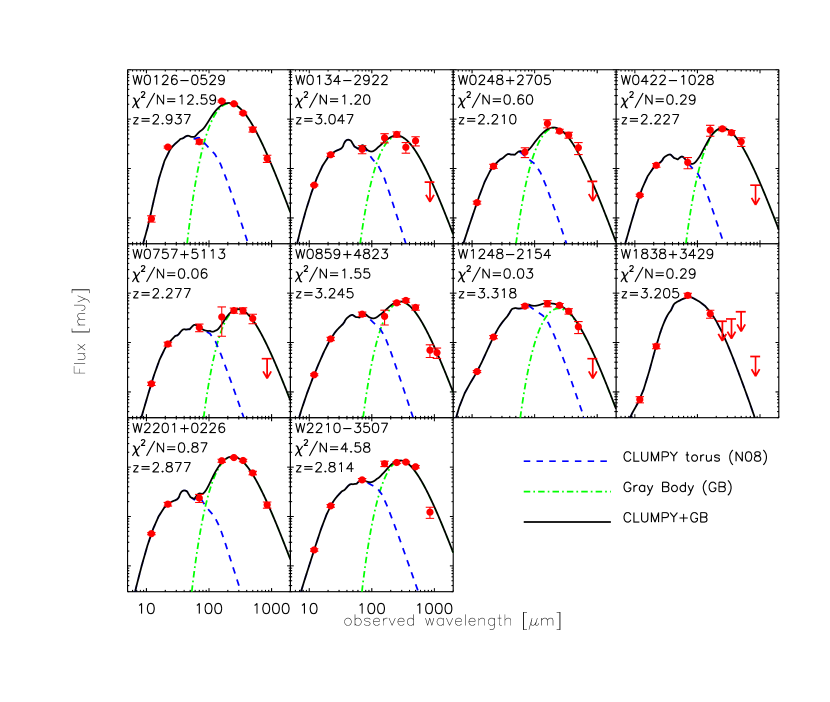
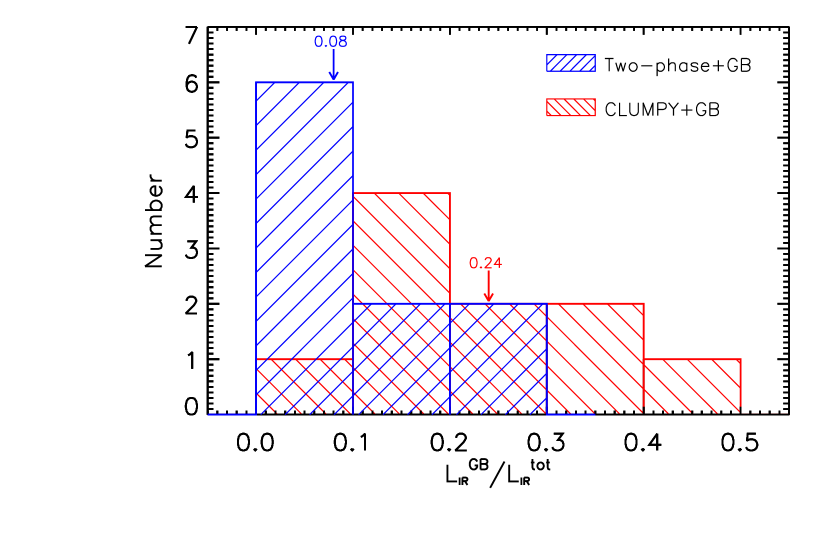
In Figure 1, we present the best-fitting results with the CLUMPY+GB model for the ten SCUBA-2 observed Hot DOGs in our sample. Based on the best-fitting results of our IR SED decomposition approach, we can derive not only the total IR luminosities, but also the individual contributions of both torus (blue dashed line in Figure 1) and cold dust components (green dot-dashed line in Figure 1). In Table 2, we list the total IR luminosities (), the IR luminosities emitted by the torus () and cold dust (), respectively. All of them are HyLIRGs (Hyper-luminous Infrared Galaxies) with . Seven out of ten Hot DOGs are ELIRGs (Extremely Luminous Infrared Galaxies, Tsai et al. 2015) with . The torus emissions contribute over half of the total IR energy output. However, all but one (W1838+3429) show the non-negligible IR luminosities () emitted by cold dust, which contribute up to 50% of the total IR luminosities. The average fraction of the cold dust to the total IR luminosities is 24% (see Figure 3). The results suggest that Hot DOGs contain both very powerful AGN and extreme starbursts with SFRs of several thousands solar masses per year.
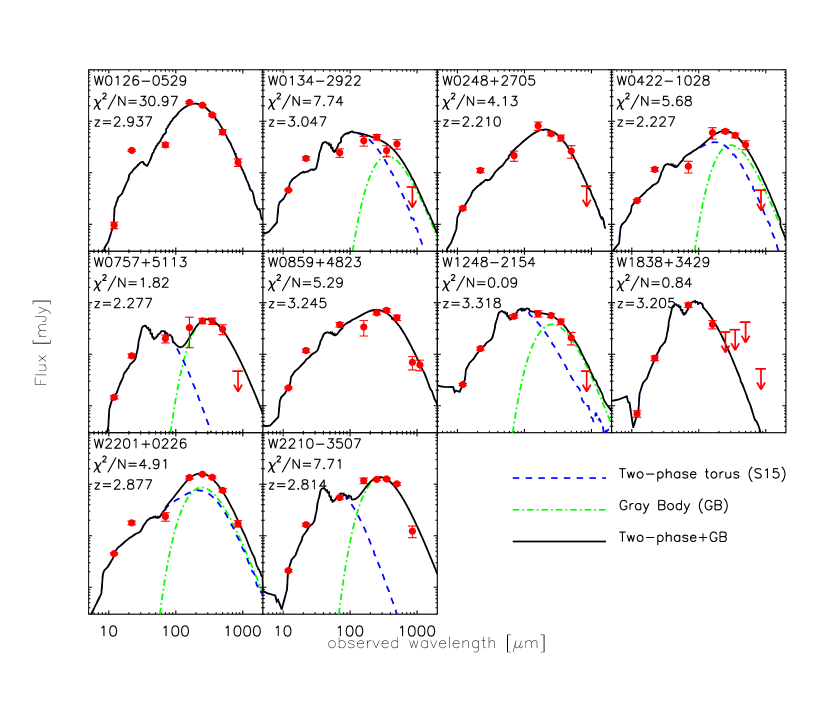
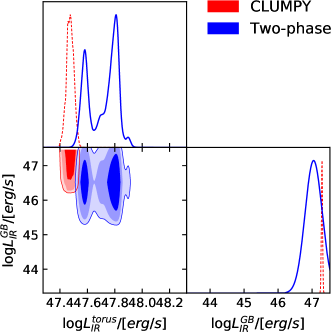
The derived IR luminosities may depend on the adopted torus models. In Figure 2, we also present the best-fitting results with the Two-phase+GB model for the ten SCUBA-2 observed Hot DOGs in our sample. The total IR luminosities (), the IR luminosities emitted by the torus () and cold dust () are also listed in Table 2. We can find that the derived are independent on the adopted models. The average difference of the total IR luminosities between the CLUMPY+GB model and the Two-phase+GB model is only 0.06 dex. However, the relative contributions of and to change a bit. Four out of ten Hot DOGs can be fitted with a sole two-phase torus model, while the rest of them require a cold dust component, contributing up to 30% of the total IR luminosities. The average fraction of the cold dust to the total IR luminosities is 8%, which is only one third of the fraction with the CLUMPY+GB model (see Figure 3). In Figure 4, we plot the one-dimensional and two-dimensional marginalized posterior probability distributions of IR luminosities of the torus () and cold dust () components, for W2201+0226 as an example. We can find that both and have been constrained to a narrower range using the CLUMPY+GB model than using the Two-phase+GB model.
We employ a gray body model to represent the cold dust emission, which is defined in Equation 1 by assuming general opacity. The cold dust temperature of each Hot DOG has been derived if a gray body component is required. In the CLUMPY+GB model, the derived dust temperatures range from 42 K to 91 K, with a mean value of 68 K. As a comparison, the derived dust temperatures in the Two-phase+GB model range from 36 K to 74 K, with a mean value of 56 K.
One of the advantages of BayeSED code is that we can compare different models quantitatively by deriving their Bayesian evidences (Jeffreys, 1998; Gregory, 2005), which represent a practical implementation of the Occam’s razor principle. In Table 3, we present the natural logarithm and of the Bayesian evidences for CLUMPY+GB and Two-phase+GB models. We also present the natural logarithm of Bayes factor ) in Table 3. We find that the CLUMPY+GB model has the higher Bayesian evidence than the Two-phase+GB model for all Hot DOGs. We also find that eight out of ten Hot DOGs have (corresponding to odds of ), which represent strong evidence in favor of CLUMPY+GB model according to the empirically calibrated Jeffreys’s scale (Jeffreys, 1961; Trotta, 2008). This result indicates that the cold dust component in Hot DOGs may be non-negligible.
| Source | ln(evCLUMPY+GB) | ln(evTwo-phase+GB) | ln () |
|---|---|---|---|
| W01260529 | |||
| W01342922 | |||
| W0248+2705 | |||
| W04221028 | |||
| W0757+5113 | |||
| W0859+4823 | |||
| W12482154 | |||
| W1838+3429 | |||
| W2201+0226 | |||
| W22103507 |
4.2 Environments around Hot DOGs
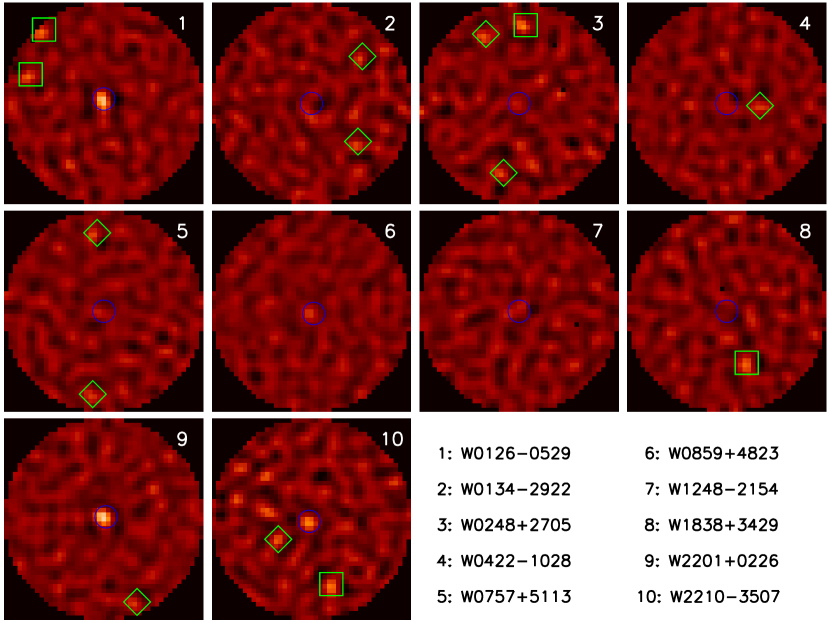
Hot DOGs have been found to live in dense environments by previous works (Jones et al., 2014; Assef et al., 2015; Jones et al., 2015; Silva et al., 2015). Fourteen and five submillimeter serendipitous sources in the 10 SCUBA-2 fields around Hot DOGs have been detected at greater than 3 and 3.5, respectively (see Figure 5 and Table 4). As indicated by the Equation 7 in Geach et al. (2017), the false detection rate of SCUBA-2 850 observations is a function of signal-to-noise ratio. The false detection rate is about 60% at the level and falls to about 20% at limit. We calculate the cumulative source counts N() for the submillimeter serendipitous sources with a S/N by following the method described in Ono et al. (2014) and Silva et al. (2015). We estimate the deboosted flux densities by correcting the flux boosting using the Equation 5 in Geach et al. (2017).
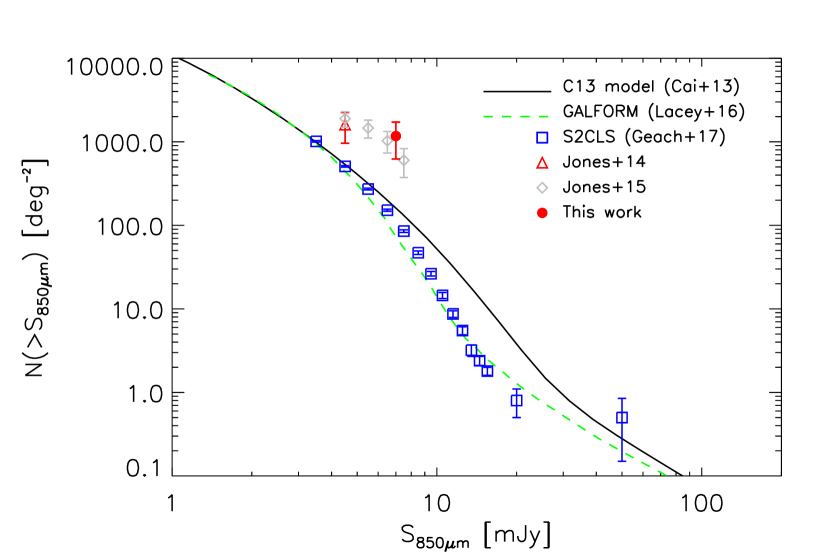
In Figure 6, we plot our result (red circle) and compare it with those in the previous results around Hot DOGs, the blank field survey and expected from models. We include the counts around 30 radio-selected Hot DOGs (gray diamonds) from Jones et al. (2015) and 10 WISE-selected Hot DOGs (red triangle) from Jones et al. (2014). Both samples used to estimate number counts have been selected from Jones et al. (2017) with S/N . We overplot the number counts of SCUBA-2 850 sources determined by Geach et al. (2017) in SCUBA-2 Cosmology Legacy Survey (S2CLS, blue squares) and the models of Cai et al. (2013) and Lacey et al. (2016). Considering the uncertainties, our count is consistent with the counts obtained by Jones et al. (2015). Relative to blank fields and model expectations, the number counts of SMGs around Hot DOGs imply an excess of times.
5 Discussion
| Source | Number of | Number of | ||
|---|---|---|---|---|
| serendipitous sources | negative peaks | |||
| W01260529 | 2 | 2 | 1 | 1 |
| W01342922 | 2 | 0 | 0 | 0 |
| W0248+2705 | 3 | 1 | 3 | 0 |
| W04221028 | 1 | 0 | 1 | 0 |
| W0757+5113 | 2 | 0 | 3 | 0 |
| W0859+4823 | 0 | 0 | 1 | 1 |
| W12482154 | 0 | 0 | 0 | 0 |
| W1838+3429 | 1 | 1 | 0 | 0 |
| W2201+0226 | 1 | 0 | 0 | 0 |
| W22103507 | 2 | 1 | 0 | 0 |
Combined with other IR data, our SCUBA-2 follow-up observations of ten Hot DOGs show that they have very high IR luminosities and cold dust temperatures. Hot DOGs are brighter by an order of magnitude than other IR luminous galaxies, such as SMGs and DOGs, but they have the comparable bolometric luminosities to the most luminous QSOs in the Universe (Assef et al., 2015). Our IR SED decomposition of Hot DOGs suggests that most of their IR radiations are from AGN tori, which are heated by the black-hole accretion. This result confirms again that Hot DOGs are in fact the luminous, dust-obscured QSOs. Despite the dominance of AGN torus component, most of Hot DOGs still require a non-negligible cold dust component, suggesting a co-existing starburst activity. Our recent ALMA CO observations of three Hot DOGs reveal that they have a significant molecular gas reservoir () which can provide the required fuel for both extreme star formation and black-hole accretion (Fan et al. 2017, in prep).
The cold dust temperature depends on the adopted torus and gray body models in the IR SED decomposition. The choice of torus model will affect both the derived temperature and IR luminosity of cold dust. Adopting CLUMPY torus model, we derive the higher values of and (see Table 2 and Figure 7). For six Hot DOGs having the SED decomposition results with both torus models, the derived and using the CLUMPY+GB model are on average 0.2 dex and 12 K higher than those derived using the Two-phase+GB model, respectively. The difference may raise from the truth that two torus models adopt the different dust particles and torus geometry. The starburst contribution to the far IR emission can well be marginal in the Two-phase+GB model, which is consistent with the result in Siebenmorgen et al. (2015). In Equation 1, we assume general opacity. As discussed in our previous work (Fan et al., 2016b), the derived cold dust temperature of Hot DOGs adopting general opacity is averagely K higher than that under the optically thin assumption. This trend also exists in other high-redshift IR luminous galaxies (Conley et al., 2011; Magdis et al., 2012). However, the derived cold dust temperature of our Hot DOGs is about 56 K adopting the optically thin assumption, which is still higher than those found in other high-redshift IR luminous galaxies (Magdis et al., 2010; Magnelli et al., 2012; Melbourne et al., 2012).
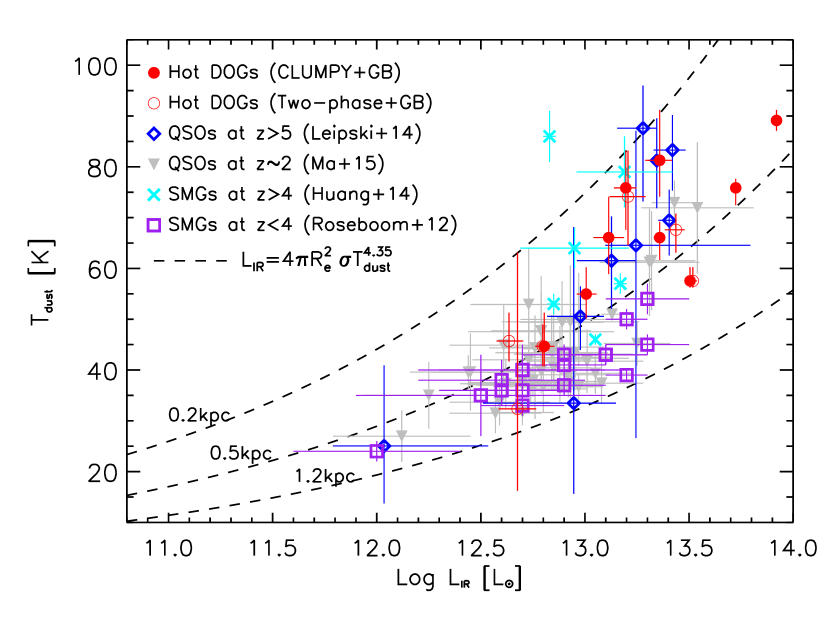
In Figure 7, we plot the derived dust temperature as a function of IR luminosity for our Hot DOGs. We also plot the relation of other high-redshift populations as a comparison, including QSOs at (diamonds; Leipski et al. 2014) and at (upside down triangles; Ma & Yan 2015), SMGs at (crosses; Huang et al. 2014) and at (squares; Roseboom et al. 2012). We use a modified Stefan-Boltzmann law () to describe relation of a gray body (Symeonidis et al., 2013; Ma & Yan, 2015; Fan et al., 2016b). As seen in Figure 7, Hot DOGs have hotter dust temperature than SMGs. The higher dust temperature in our Hot DOGs may be due to two aspects: their high IR luminosity and/or their small effective radius of the equivalent FIR-emitting region (), as suggested by the expected relation of a gray body (dashed lines in Figure 7). The future ALMA high-resolution dust continuum observations will provide further insights by comparing the FIR-emitting sizes of Hot DOGs and SMGs. Compared to UV-selected QSOs with similar IR luminosity, Hot DOGs have the same dust temperature range, confirming the idea that Hot DOGs are the luminous dust-obscured QSOs.
By counting the submillimeter serendipitous sources around Hot DOGs and estimating their cumulative number counts, we find that Hot DOGs live in dense environments (see Figure 5,6). The result is consistent with the previous works. Jones et al. (2014) found evidence of an overdensity of sub-mm neighbors to a small sample of HotDOGs using 850 observations with SCUBA-2 at JCMT. Assef et al. (2015) studied the environments of HotDOGs using the deep Warm Spitzer IRAC imaging. They showed that the number of red galaxies within 1 arcminute radius is significantly above the number observed in random pointing. And their environments are as dense as those of the clusters identified by the Clusters Around Radio-loud AGN survey (CARLA). Using the Atacama Large Millimeter/Sub-millimeter Array (ALMA) 345 GHz images, Silva et al. (2015) also found an overdensity of SMGs around radio-selected, Hot DOGs at . The results are not surprising, given the extremely high luminosity and stellar mass () of HotDOGs (Assef et al., 2015; Lonsdale et al., 2015). Frey et al. (2016) performed exploratory high-resolution 1.7-GHz observations of a small sample of four Hot DOGs with the European VLBI Network (EVN). The high-resolution radio structures, the component separations and radio powers support that QSOs residing in Hot DOGs may be genuine young radio sources where starburst and QSO activities coexist. This result leads to the speculation that Hot DOGs could be the earlier evolutionary phase of radio-loud QSOs, which are preferentially located in high-redshift protoclusters (Wylezalek et al., 2013; Hatch et al., 2014). In order to study the environments of HotDOGs thoroughly, we are proposing to search Lyman alpha emitters (LAEs) around them. As the narrow-band imaging can constrain the redshift of the objects to the small range, LAEs are very useful in studying the spatial distribution of the star-forming galaxies at high redshift. In the recent decade, targeted searches using narrow-band imaging for high-redshift rich environments around powerful high-redshift radio galaxies (HzRGs) have proven very successful (Venemans et al., 2007; Matsuda et al., 2011). Our ongoing studies will not only provide a direct evidence for (or against) whether Hot DOGs could be a good tracer of high-redshift galaxy structure, but also provide an insight to whether their extreme starburst and AGN activities are related to their environments.
6 Summary
Our main results from JCMT SCUBA-2 850 follow-up of 10 Hot DOGs are summarized as follows.
-
1.
The IR SED of Hot DOGs in our sample can be fitted by a combination of AGN torus and cold dust components. The derived total IR luminosities of Hot DOGs are extremely high and independent of the choice of torus model. Most of them are ELIRGs with .
-
2.
The torus emissions dominate the total IR energy output, regardless of the choice of torus model. The derived cold dust contribution depends on the adopted torus model. If adopting the Two-phase+GB model, the average fraction of the cold dust to the total IR luminosity is about 8%, which is only one third of the fraction with the CLUMPY+GB model. We compare two models quantitatively by deriving their Bayesian evidences. We find that the CLUMPY+GB model has the significantly higher Bayesian evidence than the Two-phase+GB model for all Hot DOGs, which represent strong evidence in favor of CLUMPY+GB model. This result indicates that the cold dust component in Hot DOGs may be non-negligible.
-
3.
The derived cold dust temperatures in Hot DOGs are on average 68 K (56 K) using the CLUMPY+GB model (Two-phase+GB model), which are comparable to those in QSOs with similar IR luminosity, but much higher than those in SMGs. Higher dust temperatures in Hot DOGs may be due to the more intense radiation field caused by intense starburst and obscured AGN activities.
-
4.
We count the submillimeter serendipitous sources around Hot DOGs and estimate their cumulative number counts at level. The number counts of SMGs around Hot DOGs imply an excess of times relative to blank fields and model expectations. The result confirms the previous argument that Hot DOGs may lie in dense environments. Future studies with narrow-band imaging may increase our insight on their environments.
-
5.
All of our results support the scenario in which Hot DOGs are luminous, dust-obscured QSOs, linking extreme starburst and UV-bright QSOs.
References
- Alexander & Hickox (2012) Alexander, D. M., & Hickox, R. C. 2012, New Astronomy Reviews , 56, 93
- Assef et al. (2015) Assef, R. J., Eisenhardt, P. R. M., Stern, D., et al. 2015, ApJ, 804, 27
- Assef et al. (2016) Assef, R. J., Walton, D. J., Brightman, M., et al. 2016, ApJ, 819, 111
- Beelen et al. (2006) Beelen, A., Cox, P., Benford, D. J., et al. 2006, ApJ, 642, 694
- Blain et al. (2002) Blain, A. W., Smail, I., Ivison, R. J., Kneib, J.-P., & Frayer, D. T. 2002, Phys. Rep., 369, 111
- Brandt & Alexander (2015) Brandt, W. N., & Alexander, D. M. 2015, A&A Rev., 23, 1
- Bridge et al. (2013) Bridge, C. R., Blain, A., Borys, C. J. K., et al. 2013, ApJ, 769, 91
- Cai et al. (2013) Cai, Z.-Y., Lapi, A., Xia, J.-Q., et al. 2013, ApJ, 768, 21
- Casey et al. (2014) Casey, C. M., Narayanan, D., & Cooray, A. 2014, Phys. Rep., 541, 45
- Chapin et al. (2013) Chapin, E. L., Berry, D. S., Gibb, A. G., et al. 2013, MNRAS, 430, 2545
- Conley et al. (2011) Conley, A., Cooray, A., Vieira, J. D., et al. 2011, ApJ, 732, L35
- Cutri et al. (2013) Cutri, R. M., & et al. 2013, VizieR Online Data Catalog, 2328, 0
- Dempsey et al. (2013) Dempsey, J. T., Friberg, P., Jenness, T., et al. 2013, MNRAS, 430, 2534
- Dey et al. (2008) Dey, A., Soifer, B. T., Desai, V., et al. 2008, ApJ, 677, 943
- Díaz-Santos et al. (2016) Díaz-Santos, T., Assef, R. J., Blain, A. W., et al. 2016, ApJ, 816, L6
- Eisenhardt et al. (2012) Eisenhardt, P. R. M., Wu, J., Tsai, C.-W., et al. 2012, ApJ, 755, 173
- Fan et al. (2016a) Fan, L., Han, Y., Fang, G., et al. 2016, ApJ, 822, L32
- Fan et al. (2016b) Fan, L., Han, Y., Nikutta, R., Drouart, G., & Knudsen, K. K. 2016, ApJ, 823, 107
- Farrah et al. (2017) Farrah, D., Petty, S., Connolly, B., et al. 2017, arXiv:1705.02649
- MultiNest, Feroz & Hobson (2008) Feroz, F., & Hobson, M. P. 2008, MNRAS, 384, 449
- Feroz et al. (2009) Feroz, F., Hobson, M. P., & Bridges, M. 2009, MNRAS, 398, 1601
- Frey et al. (2016) Frey, S., Paragi, Z., Gabányi, K. É., & An, T. 2016, MNRAS, 455, 2058
- Geach et al. (2017) Geach, J. E., Dunlop, J. S., Halpern, M., et al. 2017, MNRAS, 465, 1789
- Gregory (2005) Gregory, P. 2005, Bayesian Logical Data Analysis for the Physical Sciences (New York, NY, USA: Cambridge University Press)
- Griffin et al. (2010) Griffin, M. J., Abergel, A., Abreu, A., et al. 2010, A&A, 518, L3
- Han & Han (2012) Han, Y., & Han, Z. 2012, ApJ, 749, 123
- Han & Han (2014) Han, Y., & Han, Z. 2014, ApJS, 215, 2
- Holland et al. (2013) Holland, W. S., Bintley, D., Chapin, E. L., et al. 2013, MNRAS, 430, 2513
- Hopkins et al. (2008) Hopkins, P. F., Hernquist, L., Cox, T. J., & Kereš, D. 2008, ApJS, 175, 356
- Hatch et al. (2014) Hatch, N. A., Wylezalek, D., Kurk, J. D., et al. 2014, MNRAS, 445, 280
- Huang et al. (2014) Huang, J.-S., Rigopoulou, D., Magdis, G., et al. 2014, ApJ, 784, 52
- Jeffreys (1961) Jeffreys, H. 1961, The Theory of Probability Oxford Classics Series (3rd ed.; Oxford: Oxford Univ. Press)
- Jeffreys (1998) Jeffreys, H. 1998, The Theory of Probability (OUP Oxford)
- Jones et al. (2014) Jones, S. F., Blain, A. W., Stern, D., et al. 2014, MNRAS, 443, 146
- Jones et al. (2015) Jones, S. F., Blain, A. W., Lonsdale, C., et al. 2015, MNRAS, 448, 3325
- Jones et al. (2017) Jones, S. F., Blain, A. W., Assef, R. J., et al. 2017, MNRAS, 469, 4565
- Komatsu et al. (2011) Komatsu, E., Smith, K. M., Dunkley, J., et al. 2011, ApJS, 192, 18
- Kormendy & Ho (2013) Kormendy, J., & Ho, L. C. 2013, ARA&A, 51, 511
- Lacey et al. (2016) Lacey, C. G., Baugh, C. M., Frenk, C. S., et al. 2016, MNRAS, 462, 3854
- Leipski et al. (2014) Leipski, C., Meisenheimer, K., Walter, F., et al. 2014, ApJ, 785, 154
- Lonsdale et al. (2015) Lonsdale, C. J., Lacy, M., Kimball, A. E., et al. 2015, ApJ, 813, 45
- Ma & Yan (2015) Ma, Z., & Yan, H. 2015, ApJ, 811, 58
- Magdis et al. (2012) Magdis, G. E., Daddi, E., Béthermin, M., et al. 2012, ApJ, 760, 6
- Magdis et al. (2010) Magdis, G. E., Elbaz, D., Hwang, H. S., et al. 2010, MNRAS, 409, 22
- Magnelli et al. (2012) Magnelli, B., Lutz, D., Santini, P., et al. 2012, A&A, 539, A155
- Matsuda et al. (2011) Matsuda, Y., Smail, I., Geach, J. E., et al. 2011, MNRAS, 416, 2041
- Melbourne et al. (2012) Melbourne, J., Soifer, B. T., Desai, V., et al. 2012, AJ, 143, 125
- Nenkova et al. (2002) Nenkova, M., Ivezić, Ž., & Elitzur, M. 2002, ApJ, 570, L9
- Nenkova et al. (2008a) Nenkova, M., Sirocky, M. M., Ivezić, Ž., & Elitzur, M. 2008a, ApJ, 685, 147
- Nenkova et al. (2008b) Nenkova, M., Sirocky, M. M., Nikutta, R., Ivezić, Ž., & Elitzur, M. 2008b, ApJ, 685, 160
- Ono et al. (2014) Ono, Y., Ouchi, M., Kurono, Y., & Momose, R. 2014, ApJ, 795, 5
- Piconcelli et al. (2015) Piconcelli, E., Vignali, C., Bianchi, S., et al. 2015, A&A, 574, L9
- Pilbratt et al. (2010) Pilbratt, G. L., Riedinger, J. R., Passvogel, T., et al. 2010, A&A, 518, L1
- Poglitsch et al. (2010) Poglitsch, A., Waelkens, C., Geis, N., et al. 2010, A&A, 518, L2
- Reddy et al. (2008) Reddy, N. A., Steidel, C. C., Pettini, M., et al. 2008, ApJS, 175, 48
- Ricci et al. (2017) Ricci, C., Assef, R. J., Stern, D., et al. 2017, ApJ, 835, 105
- Roseboom et al. (2012) Roseboom, I. G., Ivison, R. J., Greve, T. R., et al. 2012, MNRAS, 419, 2758
- Sanders et al. (1988) Sanders, D. B., Soifer, B. T., Elias, J. H., et al. 1988, ApJ, 325, 74
- Sanders & Mirabel (1996) Sanders, D. B., & Mirabel, I. F. 1996, ARA&A, 34, 749
- Siebenmorgen et al. (2015) Siebenmorgen, R., Heymann, F., & Efstathiou, A. 2015, A&A, 583, A120
- Silva et al. (2015) Silva, A., Sajina, A., Lonsdale, C., & Lacy, M. 2015, ApJ, 806, L25
- Stern et al. (2014) Stern, D., Lansbury, G. B., Assef, R. J., et al. 2014, ApJ, 794, 102
- Symeonidis et al. (2013) Symeonidis, M., Vaccari, M., Berta, S., et al. 2013, MNRAS, 431, 2317
- Trotta (2008) Trotta, R. 2008, ConPh, 49, 71
- Tsai et al. (2015) Tsai, C.-W., Eisenhardt, P. R. M., Wu, J., et al. 2015, ApJ, 805, 90
- Venemans et al. (2007) Venemans, B. P., Röttgering, H. J. A., Miley, G. K., et al. 2007, A&A, 461, 823
- Wang et al. (2008) Wang, R., Wagg, J., Carilli, C. L., et al. 2008, AJ, 135, 1201
- Wang et al. (2011) Wang, R., Wagg, J., Carilli, C. L., et al. 2011, AJ, 142, 101
- Wright et al. (2010) Wright, E. L., Eisenhardt, P. R. M., Mainzer, A. K., et al. 2010, AJ, 140, 1868
- Wu et al. (2012) Wu, J., Tsai, C.-W., Sayers, J., et al. 2012, ApJ, 756, 96
- Wu et al. (2014) Wu, J., Bussmann, R. S., Tsai, C.-W., et al. 2014, ApJ, 793, 8
- Wu et al. (2017) Wu, J., Jun, H. D., Assef, R. J., et al. 2017, arXiv:1703.06888
- Wylezalek et al. (2013) Wylezalek, D., Galametz, A., Stern, D., et al. 2013, ApJ, 769, 79