Happy Travelers Take Big Pictures:
A Psychological Study with Machine Learning and Big Data
Abstract
In psychology, theory-driven researches are usually conducted with extensive laboratory experiments, yet rarely tested or disproved with big data. In this paper, we make use of 418K travel photos with traveler ratings to test the influential “broaden-and-build” theory, that suggests positive emotions broaden one’s visual attention. The core hypothesis examined in this study is that positive emotion is associated with a wider attention, hence highly-rated sites would trigger wide-angle photographs. By analyzing travel photos, we find a strong correlation between a preference for wide-angle photos and the high rating of tourist sites on TripAdvisor. We are able to carry out this analysis through the use of deep learning algorithms to classify the photos into wide and narrow angles, and present this study as an exemplar of how big data and deep learning can be used to test laboratory findings in the wild.
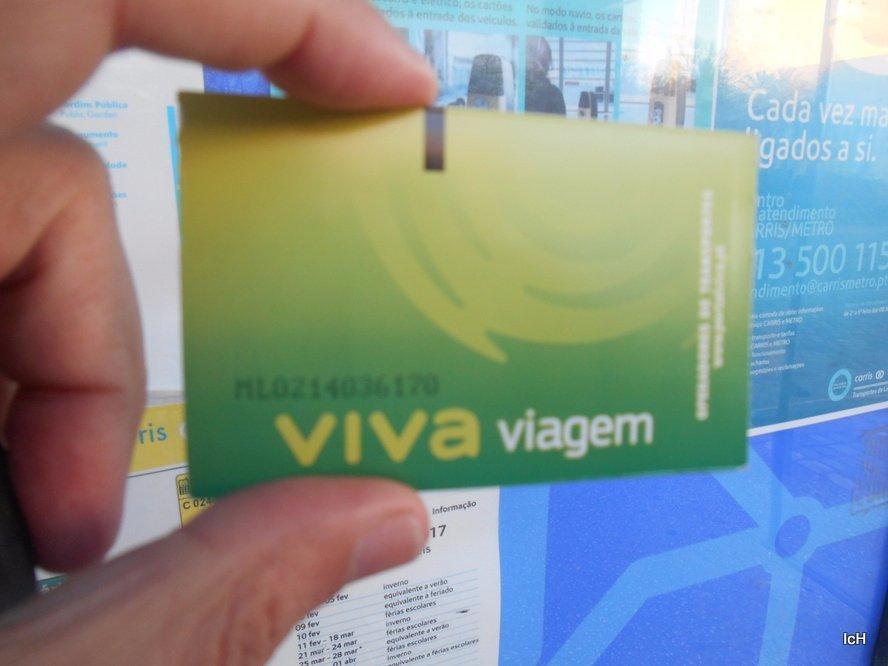
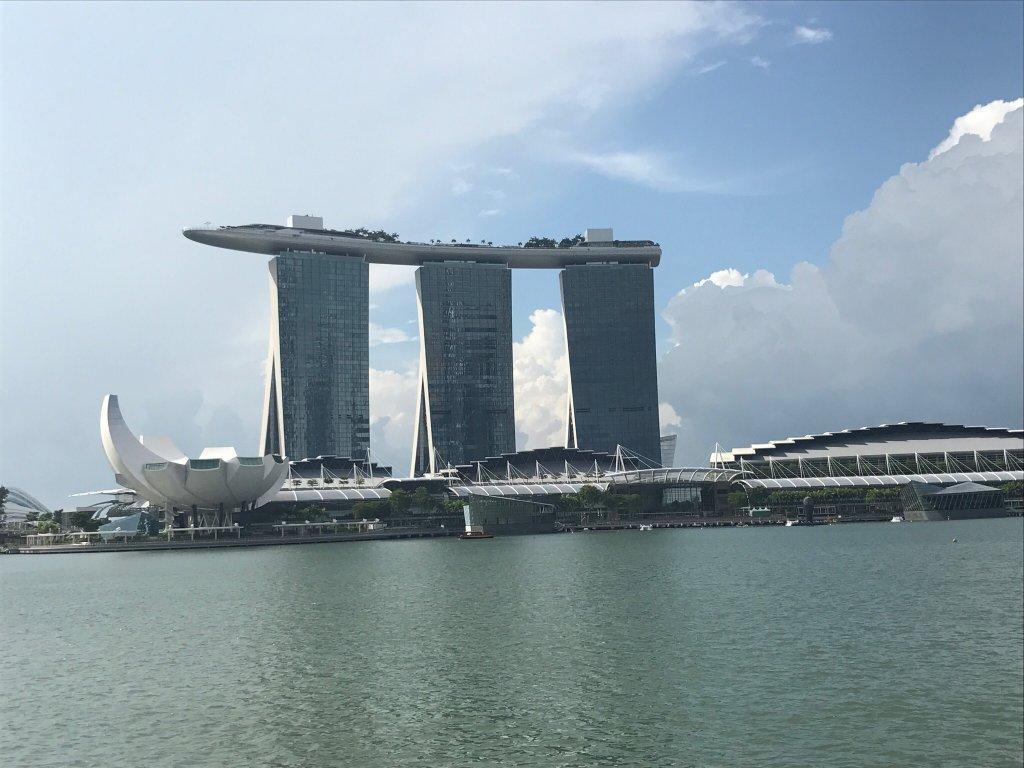
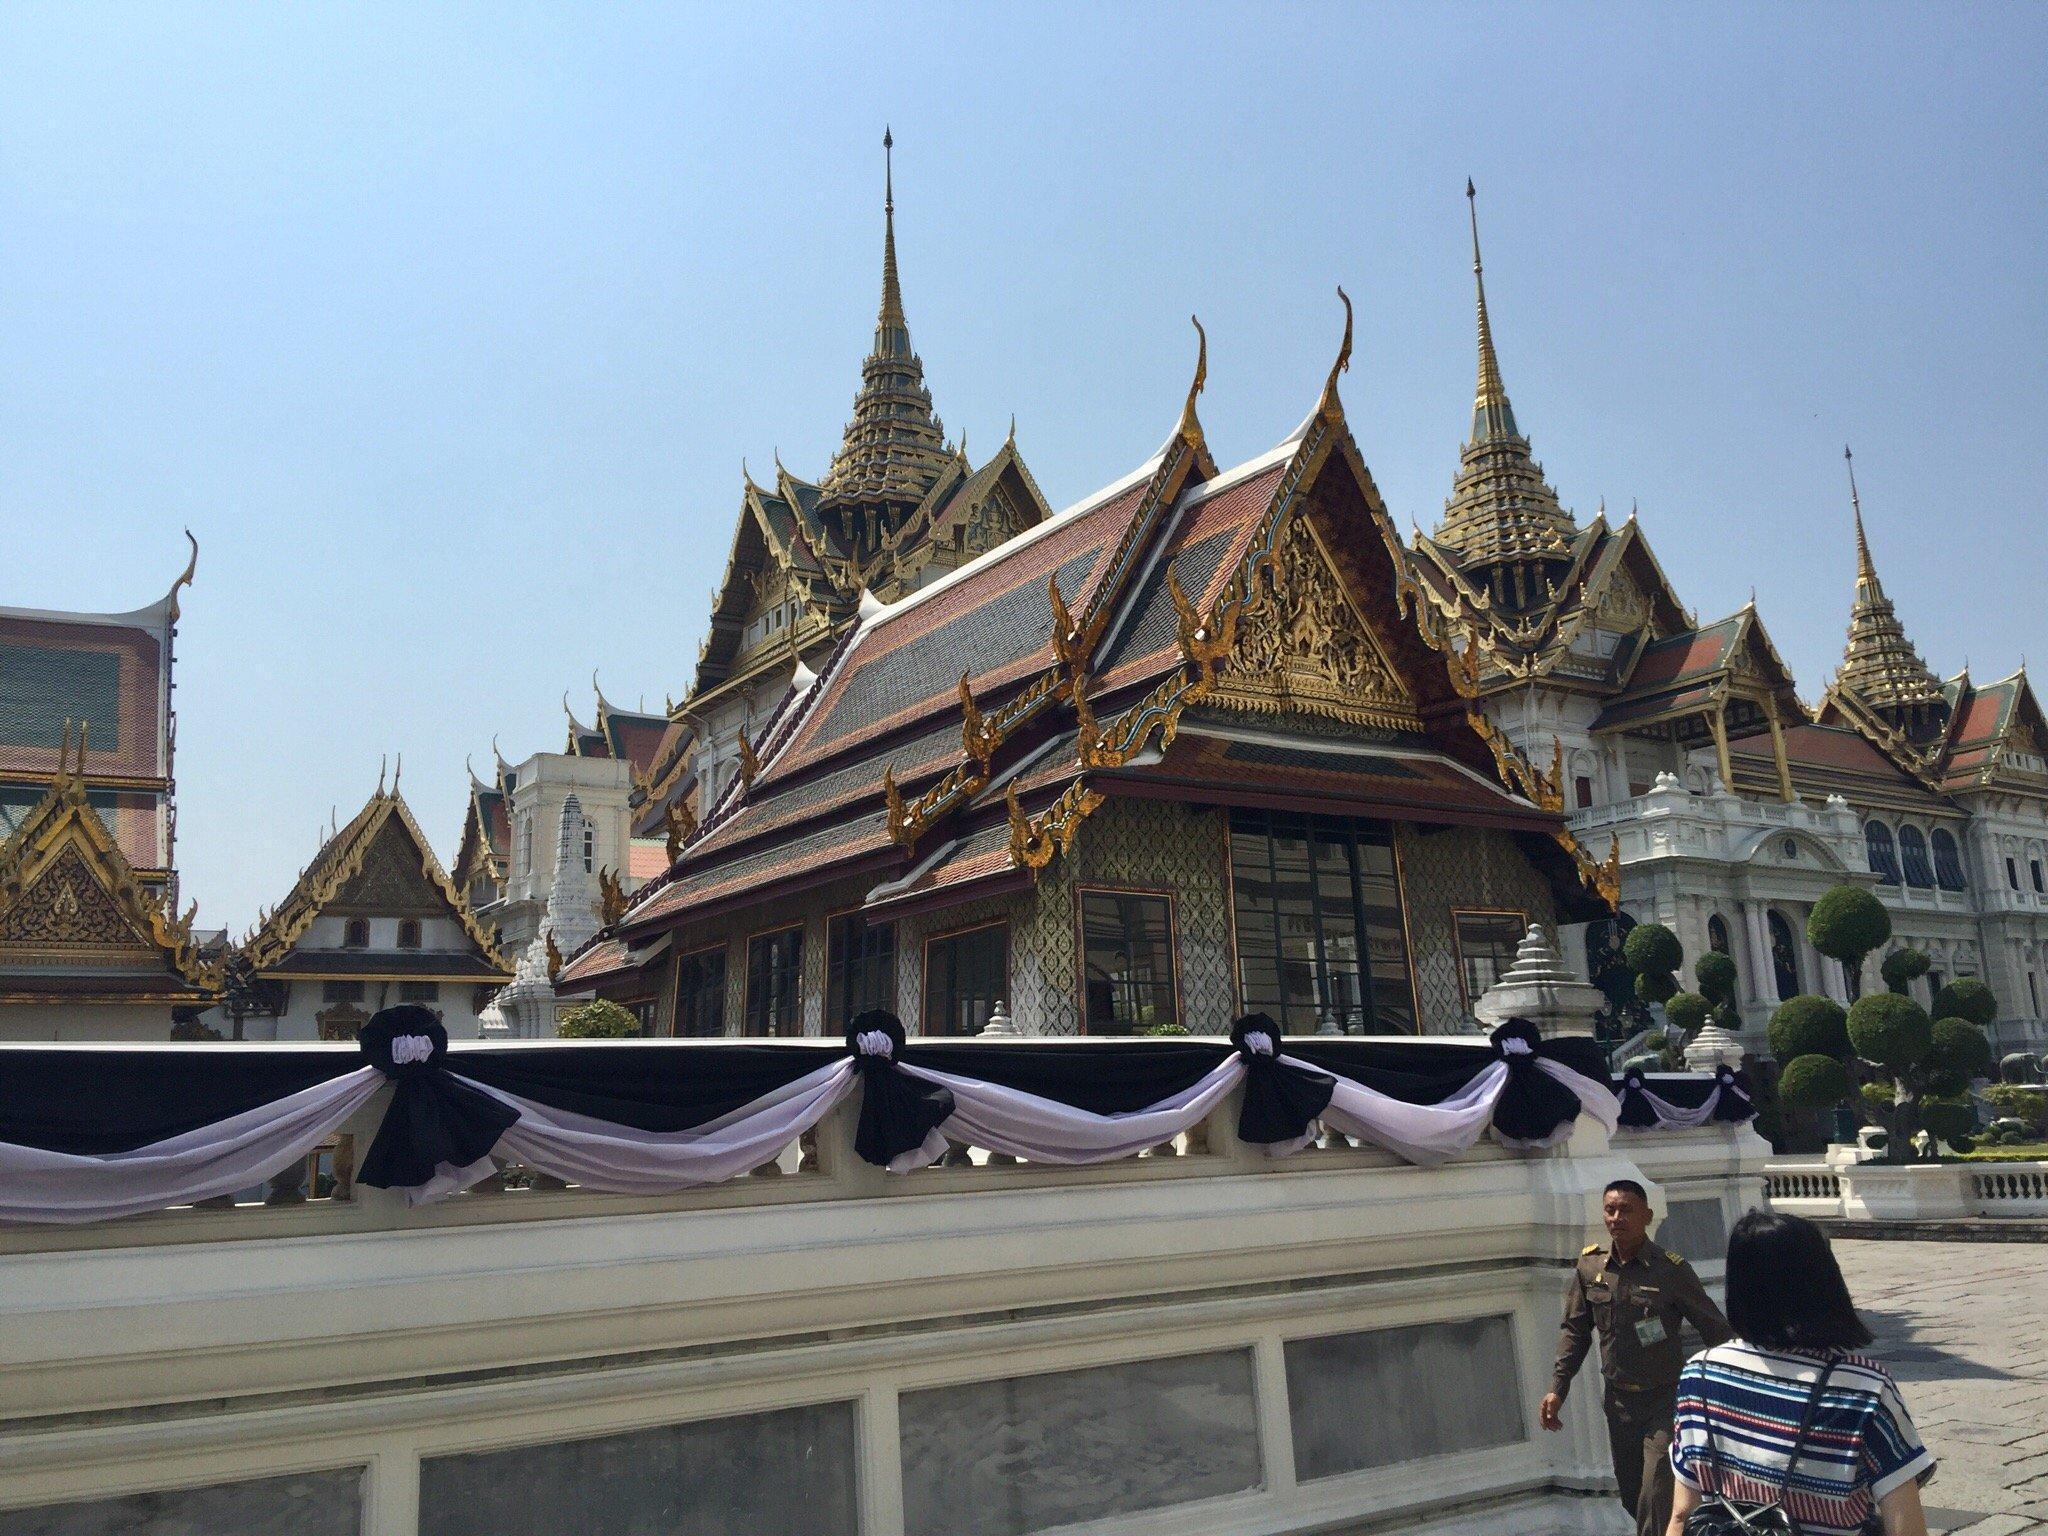
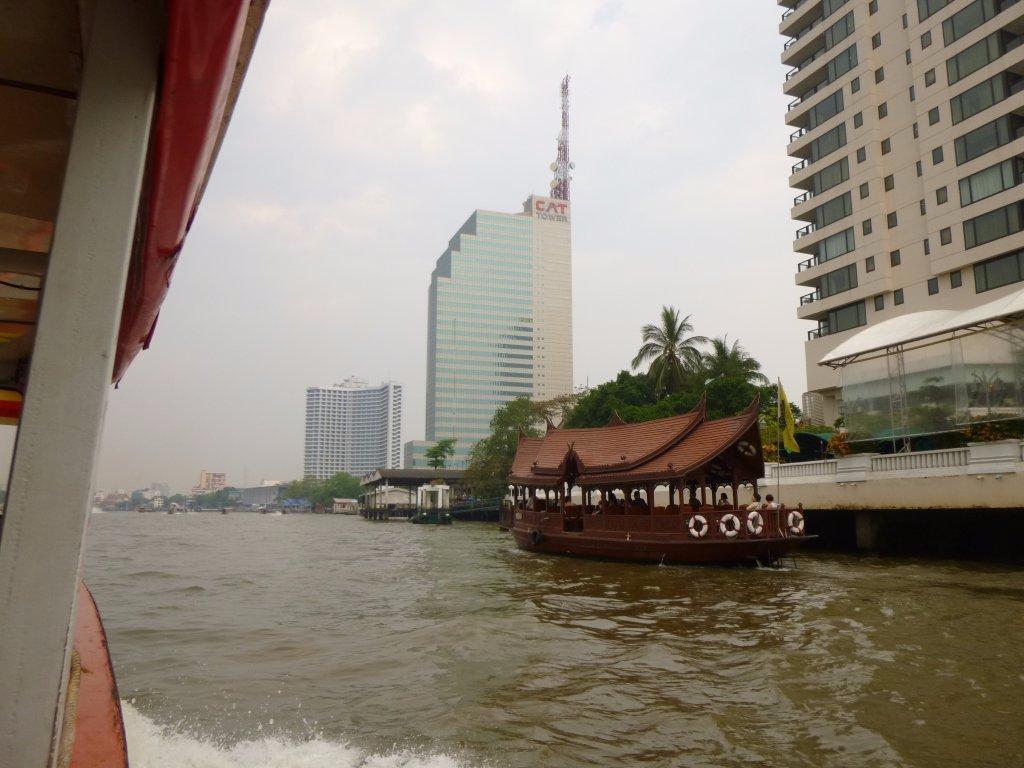
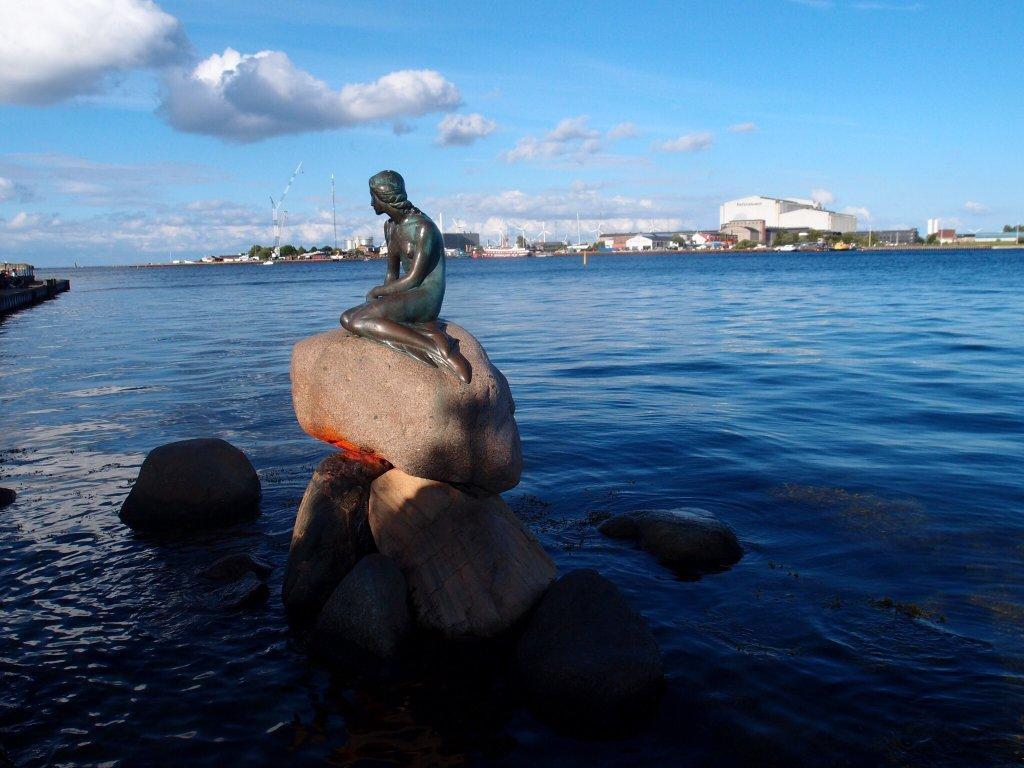
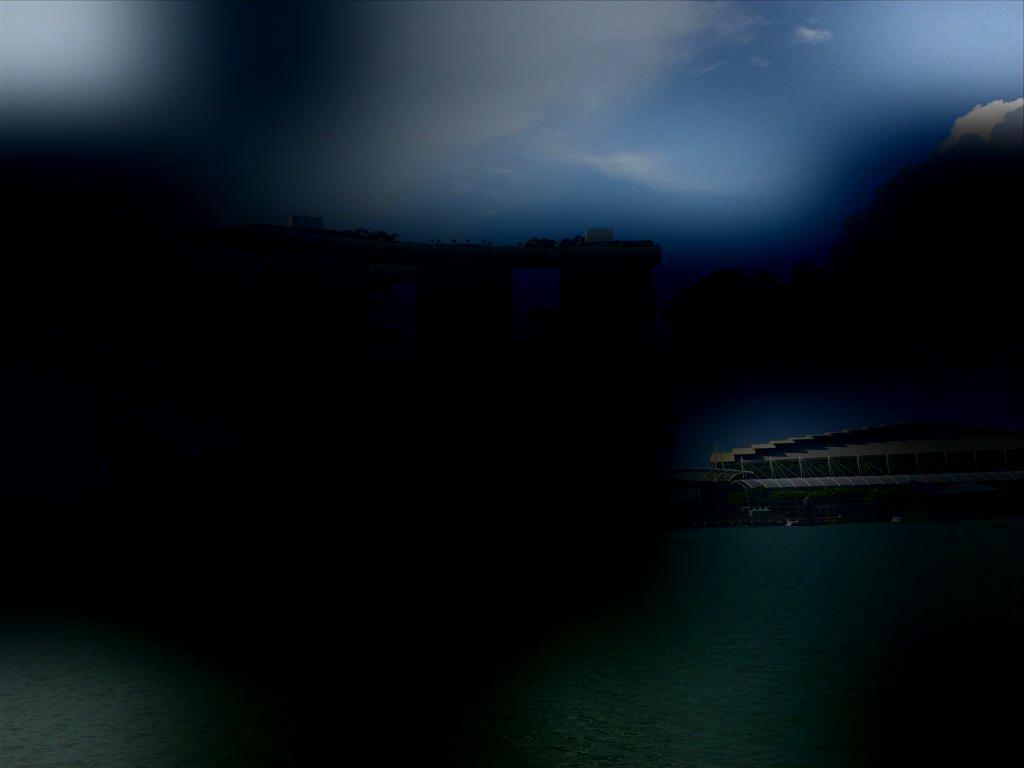
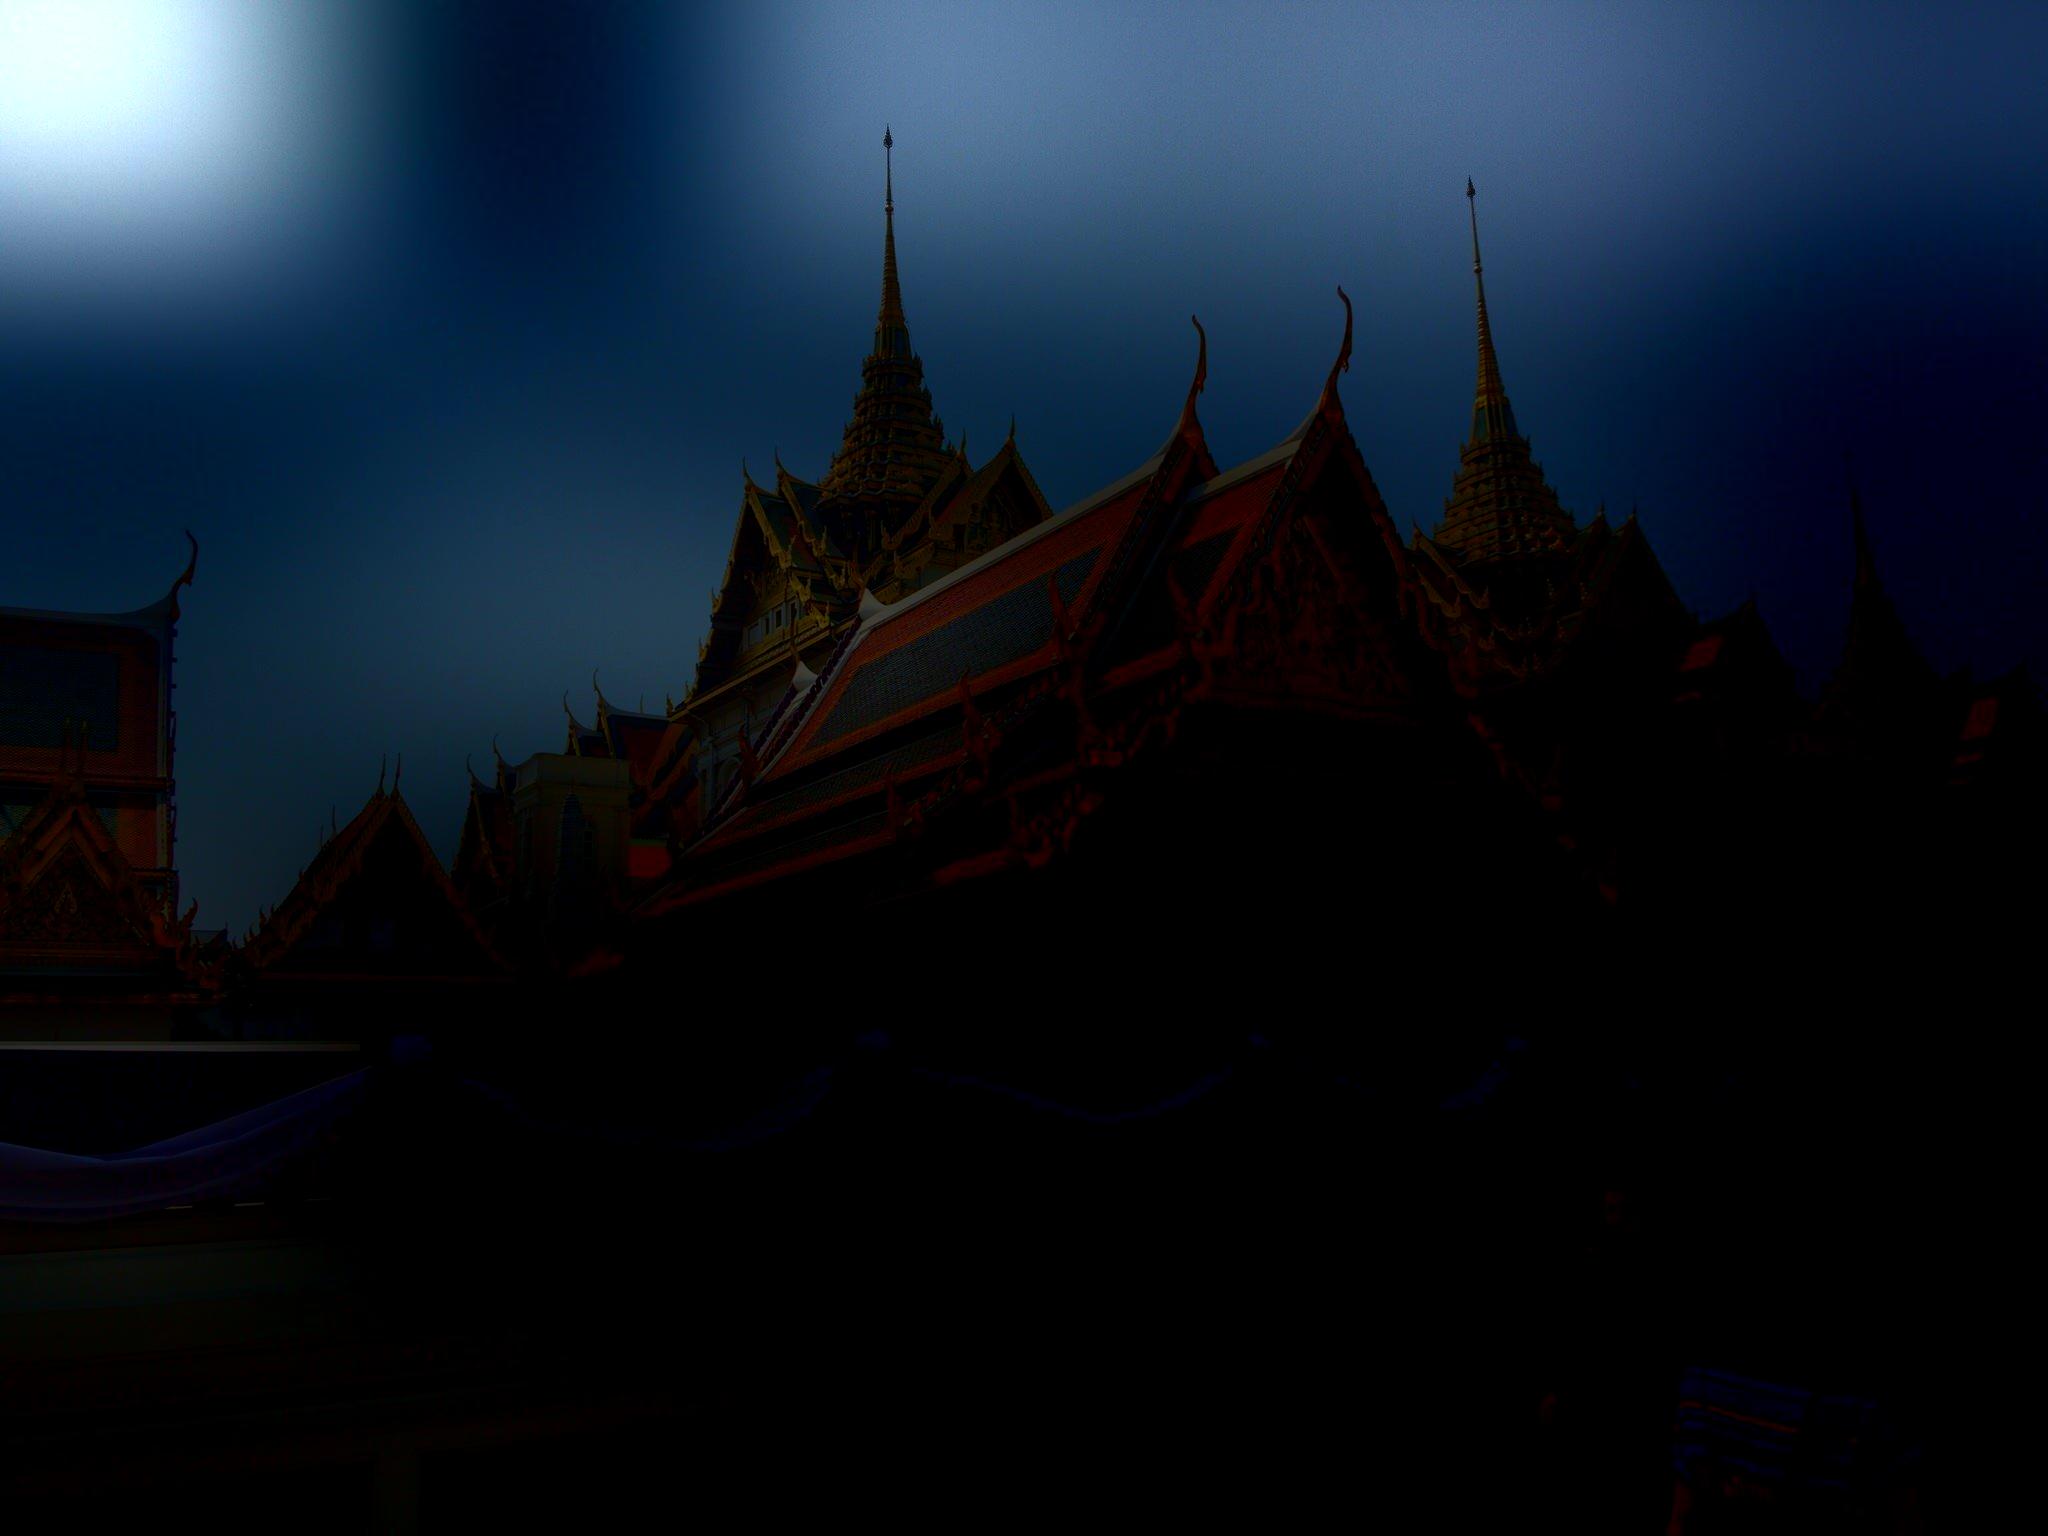
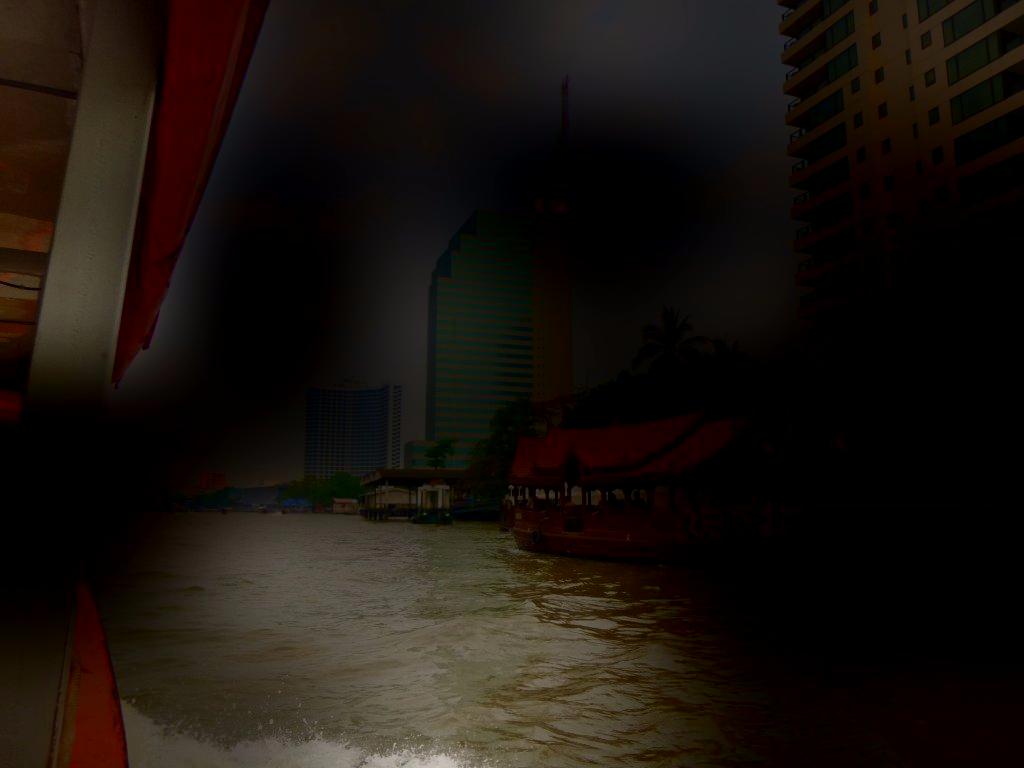
figure[]![[Uncaptioned image]](/html/1709.07584/assets/wide_temple.jpg) []
[]![[Uncaptioned image]](/html/1709.07584/assets/wide_bridge.jpg) []
[]![[Uncaptioned image]](/html/1709.07584/assets/wide_tower.jpg) []
[]![[Uncaptioned image]](/html/1709.07584/assets/narrow_hollywood.jpg) []
[]![[Uncaptioned image]](/html/1709.07584/assets/narrow_pis.jpg) []
[]![[Uncaptioned image]](/html/1709.07584/assets/narrow_roof.jpg)
Introduction
Recent advances in AI technologies (especially Deep Learning) in conjunction with big data offer psychologists an unprecedented opportunity to test theories outside the laboratory. Cognitive scientists and psychologists have been increasingly embracing big data and machine learning to significantly further theory-driven understanding of human behavior and cognition. For example, the sequential dependence functions in higher-order cognition were investigated on millions online reviews posted on Yelp (?), a machine learning model trained on a standard corpus of online text resulted in human-like semantic biases (?), emerging studies demonstrated that big data or naturally occurring data sets (BONDS) can be used as a complement to traditional laboratory paradigms and refine theories (?; ?; ?; ?). Following in the footsteps of earlier calls to action, we present here an example of leveraging state-of-the-art machine learning techniques and BONDS as a complement to test psychological theories. Concretely we investigate a real world scenario in which the travelers’ photo taking behavior is influenced by a hypothesized psychological mechanism, namely the broaden-and-build theory of positive emotions (?; ?).
According to Fredrickson’s influential theory, positive emotions broaden (globalize) the attentional scope of the observer and result in processing of a global picture, while negative emotions correlate with a narrowed (localized) attentional focus and induce the processing of local elements. This psychological hypothesis was supported by extensive laboratory experiments (?; ?; ?; ?). They widely employed a flanker task that required participants to respond to a global-local visual processing task, in which the visual stimuli were either compatible geometric figures / letters or incompatible ones (see supplementary 1 for details). However, to the best of our knowledge, this theory has not been tested with real-world big data. Moreover, it is imprudent to embrace any of these theories blindly since traditional psychological experiments are often conducted in a restricted laboratory environment with limited number of subjects that may result in a considerable bias.
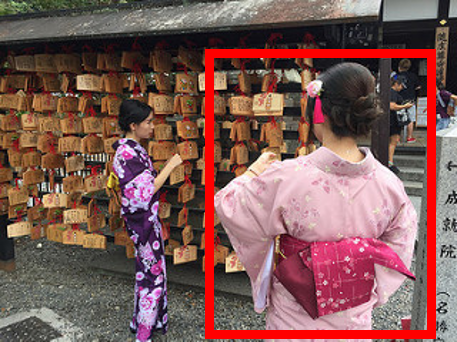
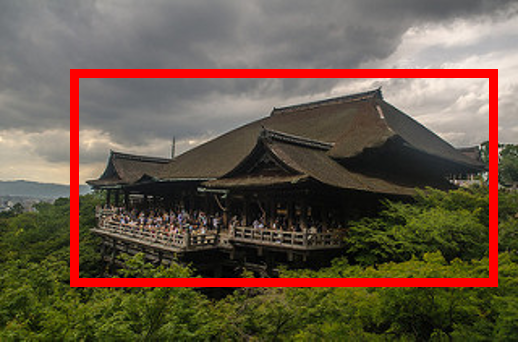
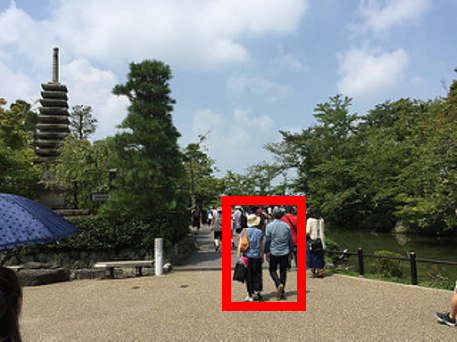
In order to scrutinize the broaden-and-build theory in the travel photo taking scenario, we first develop a deep learning algorithm with a performance in sync with a human, subsequently, cross-check photographers’ behaviors by analyzing big data, and address the confounding factors with a set of carefully designed experiments. The results demonstrate that travel photographers’ inclination to specific camera viewpoint, e.g. wide-angle (figures Happy Travelers Take Big Pictures: A Psychological Study with Machine Learning and Big Data-Happy Travelers Take Big Pictures: A Psychological Study with Machine Learning and Big Data) vs. narrow-angle (figures Happy Travelers Take Big Pictures: A Psychological Study with Machine Learning and Big Data-Happy Travelers Take Big Pictures: A Psychological Study with Machine Learning and Big Data) is largely influenced by photographers’ emotion at the time of photo taking. Such kinds of influence, which might be subconscious to photographers themselves, nevertheless, is statistically consistent and significant. Roughly speaking, photographers seem to prefer wider-angle photos to narrow-angle ones at high rating tourist sites, while for lower rating sites, the preference appears to be moderate or even going in the reverse direction (see Fig. 7 and Experiments for details). This finding is in accord with the notion of “positive emotions broaden attention and trigger wide-angle photographs”. Moreover, our study demonstrates a substantial boost of the numbers and diversity of experimental subjects by taking advantages of machine learning techniques and the vast amount of behavior data already available on the internet, which is challenging for traditional laboratory paradigms.
It is our hope that the set up of experiments as well as the proposed deep learning algorithm can be a new method added into the psychologist s toolbox. In addition, the methods adopted in this work have potential significance to real-world applications, such as discovering obscure but high-value tourist sites (?), preventing mental illness of special populations through mining their social media data (?) and so on.
Materials and Methods
Here we discuss the data and methods employed to investigate our hypothesis. Specifically, we detail our criteria and procedures in tourist sites selection and photo collection, followed by our proposed machine learning algorithms.
Tourist Sites Selection
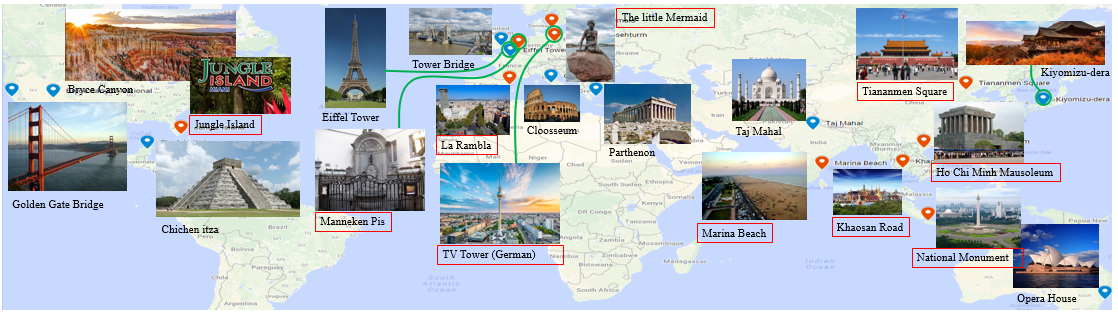
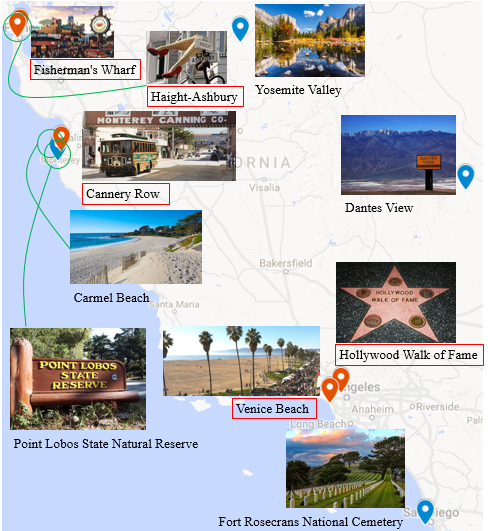
To test the “broaden-and-build” theory using BONDS, we studied the travel photos from selected tourist sites that are hosted on TripAdvisor (https://www.tripadvisor.com). The selection is based on five criteria: (1) Popularity: Recommended by top search engines - TripAdvisor, National Geographic and Travel + Leisure; (2) Objectivity: Having at least 1.5K votes for each site regardless of language, age, gender, nationality, etc; (3) Generality: Located across in Asia, Europe, and Americas; (4) Diversity: Keeping site types as diverse as possible, but avoid religious places; (5) Independence: Having an appropriate distance from other sites to avoid cross-rating. Based on their available locations, 70 sites were selected and travel photos associated with these sites were used as our study targets (see supplementary 2 for more details). Figure 3 illustrates the positions of these 70 sites on the distribution of 12K suitable candidates (the green curve), while Fig. 2 shows geo-locations of 30 samples of these sites.
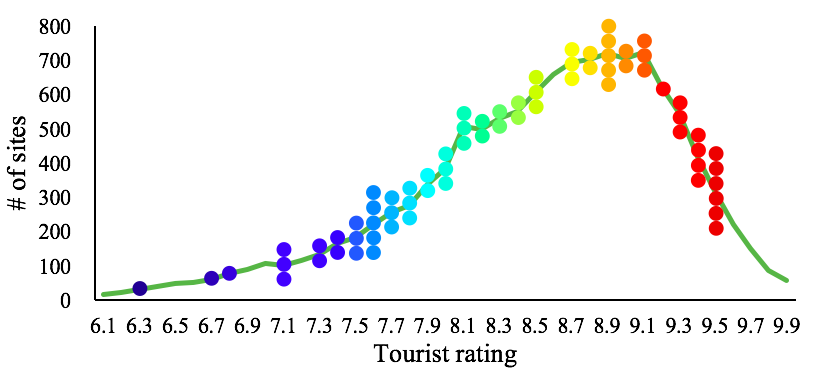
Photo Datasets
| Name | # of photos | # of wide-angle | # of narrow-angle | Source |
|---|---|---|---|---|
| 43,906 | 25,776 | 18,130 | Flickr | |
| 8,722 | 4,141 | 4,581 | TripAdvisor | |
| 418K | – | – | TripAdvisor | |
| 10,000 | – | – | YFCC100m |
We used three newly collected datasets in this study, as shown in Table 1. is for the estimation of our proposed machine learning methods, where the training data in were collected from Flickr according to the geo-locations of aforementioned sites. Whereas, the testing data, were made up of evenly distributed amount of photos from 10 tourist sites, that were randomly collected from TripAdvisor. The reason of choosing data from different sources is twofold: (1) to avoid the overlap between the training and testing datasets; (2) photos hosted on TripAdvisor were uploaded by travelers who rated the tourist sites, thus the site-ratings and photo contents would be closely related. Due to the second consideration, we created the dataset , which consists of 418K travel photos taken at the 70 tourist sites and collected from TripAdvisor without overlapping , to test the hypothesized correlation between tourists’ positive emotion and the choice of wide-angle photos. The third set, called , consists of 10K random photos collected from YFCC100m dataset (?) without using geo-tag or any other keywords. These photos were used to test the preferences of photo-taking behaviors in a completely random (or neutral emotion) mode.
Nevertheless, raw data collected in a completely uncontrolled manner as such are error-prone. The following rectification procedures have been applied to these photos. Firstly, we scrutinized all photos where the erroneously tagged, meaningless, and duplicated photos, i.e. noises, were filtered from the dataset. Secondly, selfies were eliminated from our datasets due to their intrinsic ambiguities, i.e. the attention of such photos are on both the narrow-angle of one or more persons as well as the wide-angle of the background111The trend of selfies is a relatively recent cultural phenomenon and fast becoming an integral trend in everyday people and also travelers. Though different from the intuition of the current study, it is in our interest to look into it in the future..
After rectifying the data, the dataset was then labeled for the estimation of our machine learning algorithms. To build up the training dataset and testing dataset , about 55K photos were manually labeled as either wide-angle or narrow-angle. We recruited five subjects (5 male, mean age = 28) and designed a binary classification task for them. Before the task, 10 wide-angle and 10 narrow-angle photos were demonstrated to let all subjects have a correct understanding. In the task, 20 photos (4 rows and 5 columns) were simultaneously shown on the screen to give a better visual comparison, and each subject classified photos into two categories. This procedure was iteratively carried out until all photos were checked. After collecting the batch results, we removed those ambiguous photos that had less than 4 consistent votes. By this way, consists of 52,628 photos in total with an almost perfect agreement (Fleiss’ kappa ) among five subjects, and was used as the ground truth for the estimation of our proposed methods.
Methods
In order to effectively test our hypothesis on such large dataset , we developed two task-optimized machine learning models for wide-angle and narrow-angle classification. This section gives a detailed account of our designs, evaluations, and analysis of said models.
HVS Model
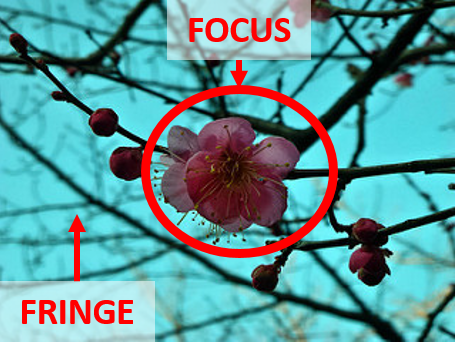
The first model mimics the basics of human visual system (HVS) in determining viewpoints, and is formulated by two cues: a focus cue and a scale cue. The focus cue is based on the finding that a large number of professionally shot close-up view photos adhere to the focus lens model of HVS (?) where it focuses on the center object (focus) while the surrounding background is blurred (fringe), as shown in Fig. 4a. To model it, we transform images into the frequency domain by using the Non-subsampled Contourlet Transform (NSCT) (?), in which SURF features (?) are extracted and quantized using Fisher Vector (?). Afterwards, the classification is implemented by a trained support vector machine (SVM). However, many narrow-angle photos shot by low-cost cameras (e.g. smart phones) do not follow the focus model where entire scene appears sharp, such as Fig. 4b. Therefore, the scale cue is derived from observers’ ability to differentiate the views by measuring the size of objects, namely the spatial size (the object size measured in the photo indicated by the boxes in Fig. 4b and 4c are bigger than the one in Fig. 4d) and the conceptual size (the realistic proportion of the object; a person in Fig. 4b is a small object but a building in Fig. 4c is a big object). Referring to Fig. 4b - 4d, a narrow-angle can be determined if the object is spatially large but conceptually small, otherwise, the photo is a wide-angle. We measure the spatial size by an object bounding box proposal method, namely Adobe refined BING boxes (?). Whereas, the conceptual size is measured by a fine-tuned convolutional neural network (CNN) (?). Hence, this HVS model built following two specific visual cues of human vision can address distinct photo characteristics.
CF-CNN Model
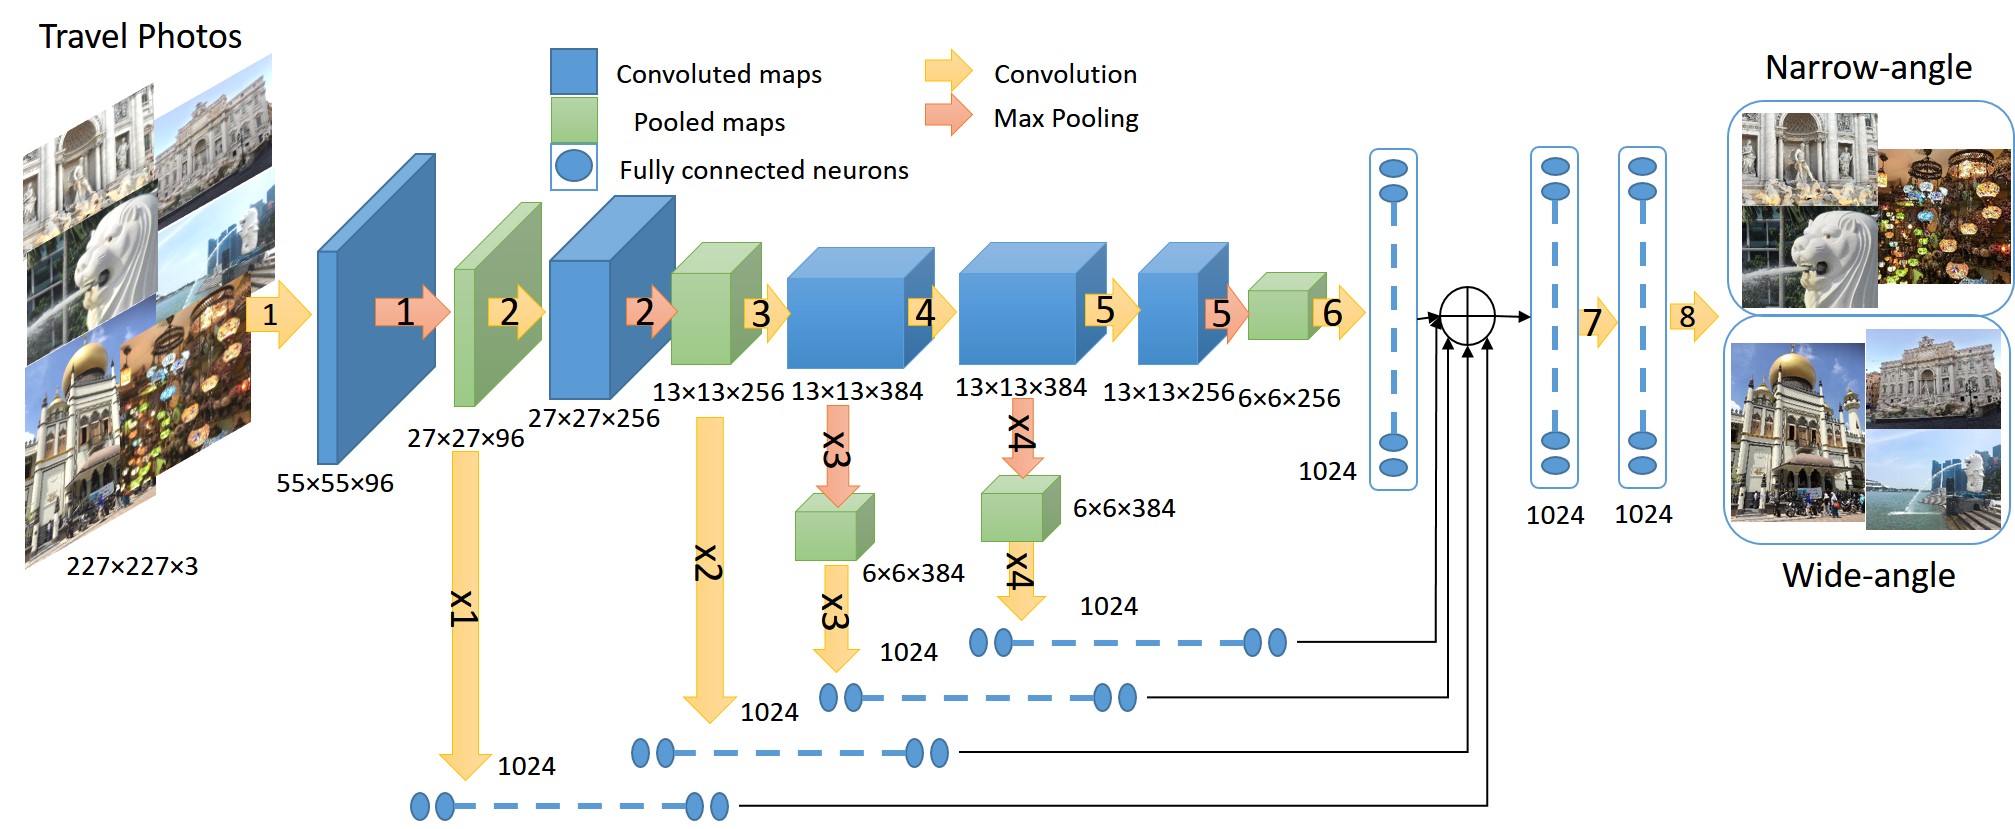
We secondly looked into a deep learning technique, by using a single CNN to perform this view angle classification as opposed to the hand-designed HVS model. This is on account of the success shown by CNN at discovering high level features for a variety of tasks (?; ?; ?; ?). However, conventional CNNs only utilize single high level feature after multiple layers of convolution. According to our pilot investigation, features that are crucial for view angle classification may vanish after multiple convolution and pooling operations in the conventional CNNs. Therefore, we designed a cumulative feature CNN (CF-CNN) that extracts features from each stage and accumulates them into one representation, hence incorporating both low and high level features for the classification task. Figure 5 illustrates the architecture of our model, where travel photos are the inputs and the outputs are their respective narrow and wide angle categorization. Specifically, we introduced additional convolution paths (convx) on each existing convolution (conv) layer, to produce 1024-dimension features. The new convx layers are placed after pooling layers (pool), and if the conv is not followed by a pool (conv3-conv4), pooling layers are added for them (poolx) before the convx, as shown by the path illustration in Fig. 5. We use the pooling size for all pool and poolx. The kernel sizes of conv are transfered from the AlexNet architecture (?), while the convx kernel follows the size of the feature map that is to be convolved, e.g. the feature map after pool1 is , hence the kernel size of convx1 is and mapped to 1024 neurons. These convx layers are to be trained end-to-end with all the other conv layers, thus the kernels are expected to focus on significant features from different levels. Hence, they are directly summed up to obtain the cumulative feature and proceed to the subsequent fully connected layers for classification.
We used 3/4 of wide and narrow angle photos in for training while the remaining for validation. During the training process, each training image was augmented by resizing the shorter side to 256 dimensions while maintaining aspect ratio, and then a random cropping and flipping is performed, followed by normalization by subtracting with the average image of the dataset. Finally, a dimension image was fed to the network.
This model is trained end-to-end using the stochastic gradient descend approach with training batch size of 230, weight decay of 0.0005, and the learning rate that logarithmically reduces from after every training epoch. Additionally, we transferred ImageNet pre-trained weights from the AlexNet for conv1 - conv5 to improve the generalization of the main feature extraction layers of our model (?). In order to prevent over-fitting, the training was stopped at 200 epochs where there was no significant reduction in the trend of the validation error. The difference between the validation and training errors was 0.047, an acceptable range of over-fitting as the validation performance achieved over 80%. Thus, we proceed to perform later classification experiments using this CF-CNN model.
Performance Evaluation and Analysis
The performances of HVS and CF-CNN models were evaluated on dataset , the travel photos of 10 sites collected from TripAdvisor. The CF-CNN achieved 88.12% overall classification accuracy, a major improvement in comparison to the HVS model that only reached 64.06%. Table 2 shows that CF-CNN outperforms HVS model at all sites. Additionally, we show in Table 3, the ratio of the wide-angle against narrow-angle photos based on CF-CNN’s classification (disregarding accuracy) closely matches the ratio of ground truth. This is an indication that the trained CF-CNN is better than the hand-designed HVS approach with a considerable likeness to a human, therefore, the CF-CNN was used for testing the “broaden-and-build” theory with real world data.
| Site | HVS model | CF-CNN model | ||||
|---|---|---|---|---|---|---|
| Correct/Total | Correct/Total | |||||
| Narrow | Wide | Accuracy | Narrow | Wide | Accuracy | |
| 1 | 74/87 | 237/832 | 37.76% | 46/87 | 819/832 | 94.12% |
| 2 | 172/240 | 342/617 | 59.98% | 129/240 | 590/617 | 83.90% |
| 3 | 246/305 | 196/518 | 53.71% | 265/305 | 465/518 | 88.70% |
| 4 | 255/339 | 233/437 | 62.89% | 303/339 | 333/437 | 81.96% |
| 5 | 345/439 | 231/429 | 66.36% | 353/439 | 396/429 | 86.29% |
| 6 | 343/405 | 201/425 | 65.54% | 385/405 | 313/425 | 84.10% |
| 7 | 420/504 | 145/366 | 64.94% | 480/504 | 207/366 | 78.97% |
| 8 | 555/689 | 109/201 | 74.61% | 654/689 | 176/201 | 93.26% |
| 9 | 502/648 | 210/269 | 77.64% | 592/648 | 244/269 | 91.17% |
| 10 | 717/925 | 18/47 | 75.62% | 903/925 | 33/47 | 96.30% |
| Total | 3629/4581 | 1958/4141 | 64.06% | 4110/4581 | 3576/4141 | 88.12% |
| Site | 1 | 2 | 3 | 4 | 5 | 6 | 7 | 8 | 9 | 10 |
|---|---|---|---|---|---|---|---|---|---|---|
| GT | 9:1 | 7:3 | 6:4 | 6:4 | 5:5 | 5:5 | 4:6 | 2:8 | 3:7 | 1:9 |
| HVS | 3:7 | 5:5 | 3:7 | 4:6 | 4:6 | 3:7 | 3:7 | 3:7 | 4:6 | 2:8 |
| CF-CNN | 9:1 | 8:2 | 6:4 | 5:5 | 6:4 | 4:6 | 3:7 | 2:8 | 3:7 | 1:9 |


We also take a further look into the CF-CNN to explore the contributing factors to its performance, by visualizing the last activation maps (highest level features) of the network to find out the spatial location in the photos that is responsible for the classification. The features from lower level layers through convx are not visualized as it has been known that they are less abstract features like edges and high frequency details. Specifically, we extract the activation maps produced by the last pooling operation (pool5) for each test image, where the dimension of the maps are as shown in Fig. 5. Max pooling is again performed on the extracted maps in the third dimension to obtain an aggregated map with dimension, where it is then resized to the size of the original image. This final map is used to mask the luminance channel of the original image to obtain a visualization of the area in which the features are used for classification.
This operation has given us an interesting insight of the wide and narrow view angle classification task. Mainly, the border of an image is a major contributor to the classification as opposed to objects only, as we had initially thought. Figure 6 shows several examples where the activations are on the fringe of the image, even though the objects within the image are clearly shown irrespective of the viewpoints. This interesting finding suggests that the strong classification can be achieved by “looking” at the image fringe instead of the objects, which goes beyond the focus cue and scale cue designed in the HVS model. We believe that this is one of the component missing from the HVS model that caused its under-performance.
Experiments
We hypothesize that prominent tourist sites induces positive emotions to travelers, and subsequently prompt them to capture more wide-angle photos than narrow-angle ones. To test the broaden-and-build theory in photo-taking behaviors, we structure the analysis to lay out a simple linear regression model as follows:
| (1) |
in which is the proportion of wide-angle photos, and are the rating score and the (approximated) size of the tourist site, and are respective parameters to be estimated, and is the offset.
The model (1) is derived from the “broaden-and-build” theory based on two assumptions: (1) emotions in the experiments reported here are considered to be represented by traveler ratings on TripAdvisor; (2) the scope of attention is naturally or unconsciously manifested by the choice of the view-angle of tourist-taken photos. Note that a competing factor, the site-size , is included in the model because it might also affect the choice of the view-angle. In this paper we adopt the Pearson correlation coefficients (PCC) to quantify and compare the influences of and with respect to (see Tables 4 and 5 below).
First of all, the model (1) is fitted to , and of 70 tourist sites, which are elaborated in the supplementary 2. The optimal fitting is reached with parameters (, , ). Note that the relative low R-squared () of the model indicates a certain amount of data cannot be explained by the model. In order to look for the most influential predictor, we conduct following two experiments.
Experiment 1: The test with respect to the site-rating
The aim of this experiment is to assess how emotions induced by different tourist sites would affect the choice of the view-angle of travel photos. All 418K travel photos in dataset from 70 tourist sites were classified by the CF-CNN. Figure 7 plots the site-rating against the proportion of wide-angle photos at each site.
| World-wide | Asia | Europe | Americas | |
|---|---|---|---|---|
| # of sites | 70 | 18 | 25 | 27 |
| PCC | 0.78 | 0.75 | 0.75 | 0.81 |
| P-value |
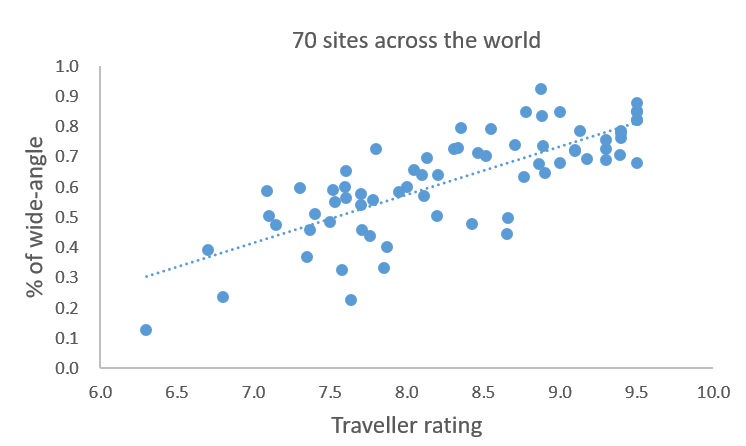
Results: Figure 7a shows a notable correlation between the site-ratings and the proportions of wide-angle photos across the world. The Pearson correlation coefficient (PCC with ) indicates a strong site-ratings dependent preference. Thus, we deem the site-rating the principal predictor of the model (1). Not surprisingly, this observation is consistent with the broaden-and-build theory.
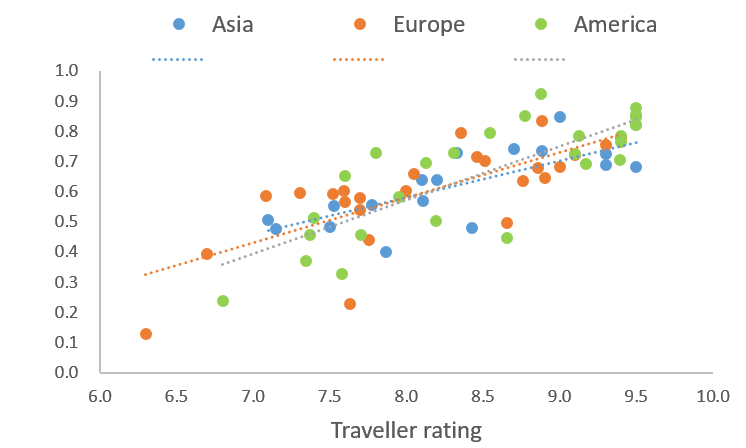
To further investigate the influence of local region and culture, these 70 sites are classified into three subgroups according to their geo-locations, Asia, Europe, and Americas. As shown in Table 4 and Fig. 7b, both the trends of the proportion of wide-angle photos and PCCs of three subgroups are very similar to those of the joint group. Conceivably, the influence of local regions and cultures is negligible.
Experiment 2: The test with respect to the site-size
The choice of view angle of travel photos may also be affected by the size of the tourist site, because people are naturally inclined to take wide-angle photos at a location which has an open space or large object of interest and vice versa. Hence, the size of the site could be a confounding factor as shown in the model (1). The aim of this experiment is to assess the relation between the preferences of photo-taking behaviors and site-sizes. To this end, we define the site-size according to the size of the object/region of interest at the location. For the sites that have the obvious object of interest, we refer to their physical sizes in meters (e.g. statues and buildings). If no such object available, we estimate the size of the region of interest in meters. For the sites with extremely open space (e.g. mountains, canyons, and seashores), their sizes are capped to 1km (see supplementary 2 for details).
| All sites | Small sites | Medium sites | Large sites | |
|---|---|---|---|---|
| # of sites | 70 | 25 | 14 | 31 |
| PCC | 0.62 | 0.44 | 0.33 | 0.61 |
| P-value | 0.026 | 0.024 | 0.002 |
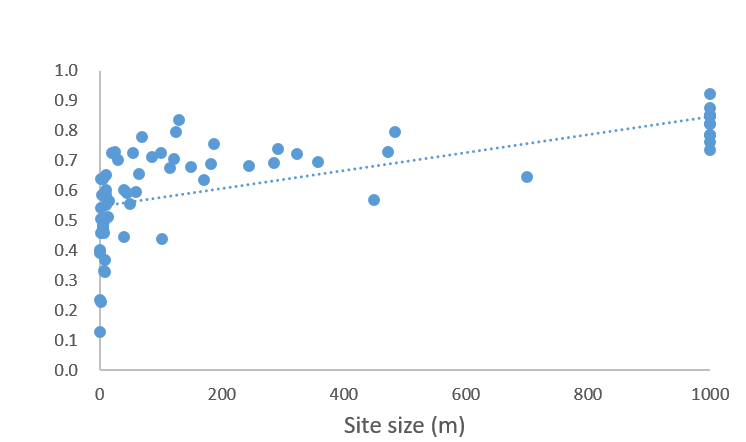
Results: Figure 7c and Table 5 illustrate a modest correlation (PCC ) between the size of the site and the proportion of wide-angle photos. This correlation is noticeably weaker, with a margin of 0.16, than the PCC (= 0.78) between the site-rating and the proportion of the wide-angle photos. Since Fig. 7c shows that these sites are unevenly distributed according to the site-size, we further look into this factor and separate them into three subgroups, namely small sites, medium sites, and large sites. Specifically, the sites with size meters are in the small group, the sites with size meters are in the large group, and others make up the medium group. We calculate the PCC of each group and list it in Table 5. These results show even weaker correlations in the three subgroups. In our view, the dwarf influence of the site-size with respect to that of the site-rating reinforces our hypothesis under examination.
Note that the interplay between the site-size, human emotion and photo-taking behavior is twofold: on the one hand, open spaces or large objects make it easy to take wide-angle photos and vice-versa, but are a secondary factor. On the other hand, positive emotions reinforce the tendency for a happy or excited photographer to take wide-angle photos regardless of site-sizes. This “modulation” effect is not only in line with the broaden-and-build theory tested in the laboratory, but also suggests that the visual attention is the result of multiple factors.
Experiment 3: The test on random photos
While the linear regression model (1) discloses the influences exerted by emotions and site-sizes on photo taking behaviors, the aim of this experiment is to assess the “default” behavior in case of a completely random mode (neutral emotion). Therefore, a site independent dataset was randomly collected from YFCC100m dataset (?) without using geo-tag or any other keywords, in which 10K photos were classified by the CF-CNN for the statistical analysis. YFCC100m is a subset of Flickr containing 100 million data, which has not only travel photos but a vast diversity (see supplementary 3 for example photos).
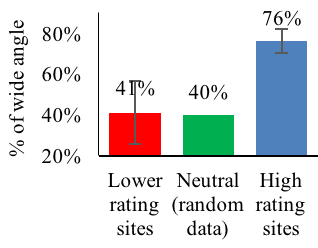
In order to have a comparison with other emotional states, we choose the sites, whose ratings are higher than 9.0, as high rating sites according to the site distribution in Fig. 3 in line with the three-sigma rule in statistics. Whereas, sites with rating lower than 7.4 are termed lower rating sites.
Results: It turns out that, the proportion of the wide-angle photos (the green bar in Fig. 8) in the 10K random data reaches approximately . A close investigation of those random photos revealed that a vast majority of narrow-angle photos are cliché photos of everyday life. The proportion of , although slightly in favour of narrow-angle photos, reveals a statistically “normal behavior” in composing wide vs. narrow angle photos. Since random photos are, supposedly, taken under neural emotion, this particular ratio serves as a reference and is compared against ratios estimated in other mood states.
For the high rating sites, the average proportion approximates to , which is not apparent in lower rating sites. Moreover, the average proportion of for the lower rating sites closely resembles the ratio of random photos. We conjecture that this similarity can be ascribed to the neutral emotion associated with lower rating sites, i.e. such sites are unable to induce positive emotions, subsequently, travelers’ photo-taking behaviors are not influenced in a positive manner. On the other hand, the significant high-ratio associated with high rating sites induces photo-taking behavior via broadened visual attention. Another finding is the greater deviation of view proportions in lower rating sites (15.5%) than high rating ones (6%). This signifies that the good sites share a consistent ability to induce positive emotions to tourists, which is lacking for lower rating sites.
Conclusion and Discussion
In this work, we tested the psychological broaden-and-build theory outside the laboratory by leveraging recent machine learning methods and big data from the internet. Our study revealed a strong correlation between the preference for wide-angle photos and the high rating of tourist sites. This preference is ascribed to the notion that positive emotions broaden visual attention and trigger wide-angle photo compositions. Alternatively, neutral emotion induces a slight favor of narrow-angle photos, which is likely associated with those lower rating sites. In addition, by controlling the condition of site-size, our result suggests that the visual attention is the result of multiple factors. We are able to carry out this analysis through the development of a deep learning algorithm for photo view angle classification, which achieves a performance in sync with a human. We hope that the set up of experiments as well as the proposed algorithm can be a new method added into the psychologist s toolbox.
Moreover, the methods adopted in this work have potential significance to real-world applications. For example, recent researches have been focusing on discovering new tourism resources through mining text or evaluating picture quality in SNS. However, few of them tried to link tourists’ experiences and mood states with these data, particularly the image data. The broaden-and-build theory with support of real world big data in this study can add a new measure for such task and boost tourism economics. In mental & welfare heathcare filed, researchers are also reviewing big data resources and their use to characterise applications to address mental illness, e.g. suicide prevention. The other side of the broaden-and-build theory (i.e. negative emotions induce a narrowed attention) with our machine learning method can help such special populations to have better lives through mining their SNS data.
References
- [Bay, Tuytelaars, and Van Gool 2006] Bay, H.; Tuytelaars, T.; and Van Gool, L. 2006. Surf: Speeded up robust features. In European Conference on Computer Vision, 404–417. Springer.
- [Caliskan, Bryson, and Narayanan 2017] Caliskan, A.; Bryson, J. J.; and Narayanan, A. 2017. Semantics derived automatically from language corpora contain human-like biases. Science 356(6334):183–186.
- [Da Cunha, Zhou, and Do 2006] Da Cunha, A. L.; Zhou, J.; and Do, M. N. 2006. The nonsubsampled contourlet transform: theory, design, and applications. IEEE Transactions on Image Processing 15(10):3089–3101.
- [Donahue et al. 2014] Donahue, J.; Jia, Y.; Vinyals, O.; Hoffman, J.; Zhang, N.; Tzeng, E.; and Darrell, T. 2014. Decaf: A deep convolutional activation feature for generic visual recognition. In International Conference on Machine Learning, 647–655.
- [Fang et al. 2016] Fang, Z.; Cao, Z.; Xiao, Y.; Zhu, L.; and Yuan, J. 2016. Adobe boxes: Locating object proposals using object adobes. IEEE Transactions on Image Processing 25(9):4116–4128.
- [Fredrickson and Branigan 2005] Fredrickson, B. L., and Branigan, C. 2005. Positive emotions broaden the scope of attention and thought-action repertoires. Cognition & emotion 19(3):313–332.
- [Fredrickson 2004] Fredrickson, B. L. 2004. The broaden-and-build theory of positive emotions. Philosophical Transactions of the Royal Society B: Biological Sciences 359(1449):1367.
- [Goldstone and Lupyan 2016] Goldstone, R. L., and Lupyan, G. 2016. Discovering psychological principles by mining naturally occurring data sets. Topics in Cognitive Science 8(3):548–568.
- [Griffiths 2015] Griffiths, T. L. 2015. Manifesto for a new (computational) cognitive revolution. Cognition 135:21–23.
- [Jones 2016] Jones, M. N. 2016. Developing cognitive theory by mining large-scale naturalistic data. Big Data in Cognitive Science 1–12.
- [Krizhevsky, Sutskever, and Hinton 2012] Krizhevsky, A.; Sutskever, I.; and Hinton, G. E. 2012. Imagenet classification with deep convolutional neural networks. In Advances in Neural Information Processing Systems, 1097–1105.
- [Lee et al. 2017] Lee, S. H.; Chan, C. S.; Mayo, S. J.; and Remagnino, P. 2017. How deep learning extracts and learns leaf features for plant classification. Pattern Recognition 71:1–13.
- [Paxton and Griffiths 2017] Paxton, A., and Griffiths, T. L. 2017. Finding the traces of behavioral and cognitive processes in big data and naturally occurring datasets. Behavior Research Methods 1–9.
- [Perronnin, Sánchez, and Mensink 2010] Perronnin, F.; Sánchez, J.; and Mensink, T. 2010. Improving the fisher kernel for large-scale image classification. In European Conference on Computer Vision, 143–156. Springer.
- [Pourtois, Schettino, and Vuilleumier 2013] Pourtois, G.; Schettino, A.; and Vuilleumier, P. 2013. Brain mechanisms for emotional influences on perception and attention: what is magic and what is not. Biological Psychology.
- [Rowe, Hirsh, and Anderson 2007] Rowe, G.; Hirsh, J. B.; and Anderson, A. K. 2007. Positive affect increases the breadth of attentional selection. Proceedings of the National Academy of Sciences 104(1):383–388.
- [Stewart and Davis 2016] Stewart, R., and Davis, K. 2016. big data in mental health research: current status and emerging possibilities. Social psychiatry and psychiatric epidemiology 51(8):1055–1072.
- [Tamir and Robinson 2007] Tamir, M., and Robinson, M. D. 2007. The happy spotlight: Positive mood and selective attention to rewarding information. Personality and Social Psychology Bulletin 33(8):1124–1136.
- [Thomee et al. 2016] Thomee, B.; Shamma, D. A.; Friedland, G.; Elizalde, B.; Ni, K.; Poland, D.; Borth, D.; and Li, L.-J. 2016. Yfcc100m: The new data in multimedia research. Communications of the ACM 59(2):64–73.
- [Tsotsos 2011] Tsotsos, J. K. 2011. A computational perspective on visual attention. MIT Press.
- [Vanlessen et al. 2013] Vanlessen, N.; Rossi, V.; De Raedt, R.; and Pourtois, G. 2013. Positive emotion broadens attention focus through decreased position-specific spatial encoding in early visual cortex: Evidence from erps. Cognitive, Affective, & Behavioral Neuroscience 13(1):60–79.
- [Vinson, Dale, and Jones 2016] Vinson, D. W.; Dale, R.; and Jones, M. N. 2016. Decision contamination in the wild: Sequential dependencies in yelp review ratings. In Proceedings of the 38th Annual Meeting of the Cognitive Science Society, 1433–1438.
- [Yosinski et al. 2014] Yosinski, J.; Clune, J.; Bengio, Y.; and Lipson, H. 2014. How transferable are features in deep neural networks? In Advances in Neural Information Processing Systems, 3320–3328.
- [Yosinski et al. 2015] Yosinski, J.; Clune, J.; Nguyen, A.; Fuchs, T.; and Lipson, H. 2015. Understanding neural networks through deep visualization. arXiv preprint arXiv:1506.06579.
- [Zeiler and Fergus 2014] Zeiler, M. D., and Fergus, R. 2014. Visualizing and understanding convolutional networks. In European Conference on Computer Vision, 818–833. Springer.
- [Zhuang et al. 2014] Zhuang, C.; Ma, Q.; Liang, X.; and Yoshikawa, M. 2014. Anaba: An obscure sightseeing spots discovering system. In International Conference on Multimedia and Expo.