3XMM J181923.7170616: an X-ray binary with a 408 s pulsar
Abstract
We carry out a dedicated study of 3XMM J181923.7170616 with an approximate pulsation period of 400 s using the XMM-Newton and Swift observations spanning across nine years. We have refined the period of the source to 407.904(7) s (at epoch MJD 57142) and determined a period derivative limit of (). The source radiates hard, persistent X-ray emission during the observation epochs, which is best described by an absorbed - model (–0.8) plus faint Fe lines at 6.4 keV and 6.7 keV. The X-ray flux revealed a variation within a factor of 2, along with a spectral hardening as the flux increased. The pulse shape is sinusoid-like and the spectral properties of different phases do not present significant variation. The absorption () is similar to the total Galactic hydrogen column density along the direction, indicating that it is a distant source. A search for the counterpart in optical and near-infrared surveys reveals a low mass K-type giant, while the existence of a Galactic OB supergiant is excluded. A symbiotic X-ray binary is the favored nature of 3XMM J181923.7170616 and can essentially explain the low luminosity of , slow pulsation, hard X-ray spectrum, and possible K3 III companion. An alternative explanation of the source is a persistent Be/X-ray binary with a companion star no earlier than B3-type.
1 Introduction
X-ray Binaries (XRBs) are binary systems in which a compact object (such as a neutron star or a black hole) is accreting from a companion star, contributing a significant amount of X-ray radiation in one galaxy. XRBs are divided into two categories according to the mass of the companion star. A binary with a massive companion () is called a high mass X-ray binary (HMXB),while those with smaller companions () are classified as low mass X-ray binaries (LMXBs).
LMXBs are usually transient sources, in their quiescent states the X-ray luminosities can be down to 10 in the soft X-ray band, and they can turn to be very luminous during the outbursts (up to 1038 erg s-1, see Reig 2011 for a recent review). HMXB systems are mainly subdivided into Be/X-ray Binaries (BeXBs) and supergiant X-ray binaries (SGXBs). BeXBs contain a neutron star (NS) orbiting a Be star (Negueruela 1998). Most of them display two types of outbursts (Type I and II) during which the luminosity is increased significantly (100-1000). With the improved sensibilities of X/-ray telescopes, the above picture of XRBs has been enriched with emerging subclasses. Symbiotic X-ray binaries (SyXBs) are a new subclass of LMXBs containing an X-ray luminous NS and a late type giant companion. Our current knowledge of SyXBs comes from about 10 SyXBs or potential candidates, which manifest long orbital and spin periods ( s) and a relatively low X-ray luminosity (–; Lü et al. 2012). The long spin period and weak X-ray emission are also typical for the persistent BeXBs, in which the NS is suggested to be far from the Be star and accreting material from the low-density regions of the Be star’s wind (Reig & Roche 1999).
During the past two decades, the X-ray space telescopes XMM-Newton and Chandra have detected numerous serendipitous X-ray sources thanks to their high sensibilities. Their catalogues record X-ray objects with a variety of populations and provide rich resources for the exploration of new XRBs.
3XMM J181923.7170616 is an X-ray source recorded in the third XMM serendipitous source catalogue Data Release 5 (3XMM-DR5; Rosen et al. 2016). It was identified as a slow X-ray pulsar candidate with a period of 400 s in a study of the 3XMM-DR4 using the machine learning method (Farrell et al. 2015). We performed periodicity search of a selected sample of sources in 3XMM-DR5 and also noticed the clear periodicity of the source at .
To uncover the nature of 3XMM J181923.7170616, we carried out a dedicated analysis of 3XMM J181923.7170616 using 12 new Swift observations in addition to the XMM-Newton observations. In Section 2 we describe the X-ray observations used in this study. Our timing and spectral analysis with the XMM-Newton and Swift-XRT observations are presented in Section 3. The search for the counterpart and our discussion related to the nature are included in Section 4. Section 5 summarizes the results.
2 Observations
2.1 XMM-Newton
3XMM J181923.7170616 was observed in three XMM-Newton observations with the European Photon Imaging Camera (EPIC), which contains two MOS cameras (Turner et al. 2001) and a pn camera (Strüder et al. 2001) to detect X-ray photons in the 0.2–10 keV energy range. All of these three observations were originally pointed to an HXMB SAX J1818.6-1703 (, , J2000) and detected the serendipitous bright source 3XMM J181923.7170616 away to the southeast. Two observations of the source conducted in 2006 (PI D.M. Smith) and 2010 (PI E. Bozzo) were recorded in 3XMM-DR5. A third observation (PI S. Drave) was carried out in 2013, it was not included in the 3XMM catalogue. We only use the MOS data of the third observation because 3XMM J181923.7170616 was beyond the field of view of the pn camera observation. The Reflection Grating Spectrometer (RGS) data of each observation has a cross dispersion of , in which the source was out of the field. Therefore we do not perform an analysis of the RGS data. The time resolutions of the MOS and pn data are 2.6 s and 73.4 ms, respectively. We removed the time intervals with strong heavy proton flaring by checking the CCD corner light curves. Since the third observation has an unsteady light curve in most of the observation time, we only used the time intervals with flat, low counts rate and did not refer to this observation for precise analysis. The total screened exposures for the MOS1/2 and pn data are 54 ks and 26.7 ks, respectively. XMM Science Analysis System software (SAS, ver 15.0) was used to reproduce the XMM-Newton data.
2.2 Swift
We found additional data of 3XMM J181923.7170616 observed with the Swift space telescope in the HEASARC111http://heasarc.gsfc.nasa.gov/ data archive. There are 12 observations toward the X-ray point source SWIFT J1819.2-1706 that spatially matches 3XMM J181923.7170616. We believe that they are the same source because of their spatial coincidence and identical timing and spectral properties (see Section 3).
The Swift observations were conducted between April 30 and May 31, 2015. We retrieved the Ultraviolet/Optical Telescope (UVOT) imaging data for the 170-650 nm and X-ray telescope (XRT) data in the 0.2-10 keV energy range. We chose the PC mode of XRT data and processed them using the HEASOFT Calibration Database. UVOT data are not used in this paper, because we did not find a counterpart of the source in the Swift UV/Optical image. The XRT CCD time resolution is 2.5 s. The minimum, maximum, and total exposures amongst XRT observations are approximately 1.5 ks, 10.3 ks, and 88.3 ks, respectively.
XSPEC(ver 12.9.0) and XRONOS packages in HEASOFT(ver 6.17), and TEMPO2222http://www.atnf.csiro.au/research/pulsar/tempo2/ (Hobbs et al. 2006; Edwards et al. 2006) were used for timing and spectral analysis of the XMM-Newton and Swift data. We also used Python software packages (Astropy, Scipy/Numpy and Matplotlib) for data analysis and visualization. Table 1 lists the detailed information (the observation ID, date, exposure, and average count rate) of the X-ray observations.
3 Results
3.1 Timing Analysis
The photons of 3XMM J181923.7170616 are extracted from a circular region with a radius of centered at (, , J2000). We corrected the photon’s arrival time to the barycenter of the solar system before the periodicity search. The power spectral density of the time series in 0.2–10 keV band was calculated with the powspec command in the XRONOS package. The upper limits of the calculated frequencies are for the MOS and XRT data, and 7 for the pn data. A power density peak is shown at 0.0025 Hz in the XMM-Newton and Swift power spectra, corresponding to a periodicity of . We subsequently apply the epoch-folding method (efsearch; Leahy 1987), which refines the periodicity to around 408 s. The uncertainty of the period is estimated with , where is the Fourier resolution for an observation duration of and is the peak theoretical reduced Chi-square in the vs. period plot (see Leahy 1987). Table 1 summarizes the 9 groups (3 for MOS1, 3 for MOS2, 2 for pn, and 1 for XRT of Swift) of periods. In this process we combine the 12 Swift observations taken within two months.
We construct a phase-connection analysis by fitting the time-of-arrivals (TOAs) of the observations to a standard timing model: . The TOA of each observation is determined by folding the pulse profile with a period of 407.9091 s. This period with a small uncertainty (0.0025 s) is taken from the epoch-folding result of the Swift data (see Table 1). A sinusoid can reproduce each folded pulse profile and is thus used to determine the TOA of each observation. The Swift data with the ID of 00033498008 are not used for the phase connection, since the short exposure (1.5 ks; less than 4 periods) is insufficient to provide a reliable TOA.
| Obs. ID | Obs. Date | Exposurea | Instrument | Count Rateb | Periodc |
|---|---|---|---|---|---|
| (ks) | (counts ) | (s) | |||
| 0402470101 | 2006 Oct 07 | 13.1/18.2 | XMM/MOS1 | 0.036(2) | 408.0(9) |
| 13.3/18.2 | XMM/MOS2 | 0.037(2) | 409(1) | ||
| 11.7/18.2 | XMM/pn | 0.058(4) | 408.9(6) | ||
| 0604820101 | 2010 Mar 21 | 28.6/45.6 | XMM/MOS1 | 0.045(2) | 407.7(2) |
| 24.3/45.6 | XMM/MOS2 | 0.042(2) | 408.2(2) | ||
| 15.0/45.6 | XMM/pn | 0.108(4) | 407.7(2) | ||
| 0693900101d | 2013 Mar 21 | 12.5/30.7 | XMM/MOS1 | 0.054(3) | 406.7(3) |
| 12.5/30.7 | XMM/MOS2 | 0.054(2) | 409.1(4) | ||
| 00033498001 | 2015 Apr 30 | 9.6 | Swift/XRT | 0.022(1) | 407.909(3) |
| 00033498002 | 2015 May 01 | 8.6 | Swift/XRT | 0.026(1) | - |
| 00033498003 | 2015 May 02 | 5.0 | Swift/XRT | 0.027(2) | - |
| 00033498004 | 2015 May 03 | 9.8 | Swift/XRT | 0.026(1) | - |
| 00033498005 | 2015 May 04 | 10.3 | Swift/XRT | 0.022(1) | - |
| 00033498006 | 2015 May 05 | 9.0 | Swift/XRT | 0.019(1) | - |
| 00033498007 | 2015 May 11 | 7.3 | Swift/XRT | 0.024(1) | - |
| 00033498008 | 2015 May 14 | 1.5 | Swift/XRT | 0.024(4) | - |
| 00033498009 | 2015 May 16 | 5.5 | Swift/XRT | 0.018(2) | - |
| 00033498010 | 2015 May 21 | 9.0 | Swift/XRT | 0.026(1) | - |
| 00033498011 | 2015 May 27 | 5.2 | Swift/XRT | 0.019(3) | - |
| 00033498012 | 2015 May 31 | 7.5 | Swift/XRT | 0.019(2) | - |
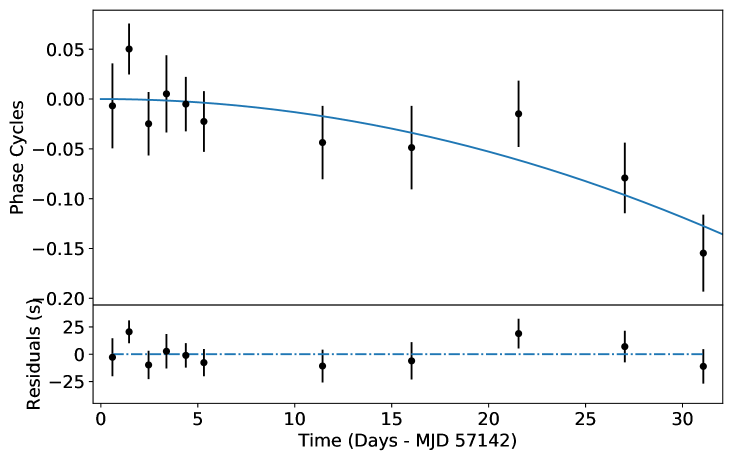
We started by fitting the first three TOAs to a linear ephemeris and added TOAs one at a time using a quadratic ephemeris. We repeated the fit procedure iteratively using the new solution until the last TOA is added. Each newly added TOA matches to cycles of the predicted phase derived from the previous solution. The best-fit quadratic ephemeris is given by the final phase-fitting procedure: on MJD 57142 and (1 uncertainty; rms=10.8 s, ; see Figure 1. ). During the Swift observation epoch, the quadratic term contributes -0.06 (-0.01 – -0.24) cycles. We did not fit retroactively back to the XMM-Newton TOAs, considering that a constant would contribute -37 – -882 cycles between the last XMM-Newton TOA and the first Swift TOA. The quadratic solution is marginally better than a linear solution (; rms=11.5 s, ).
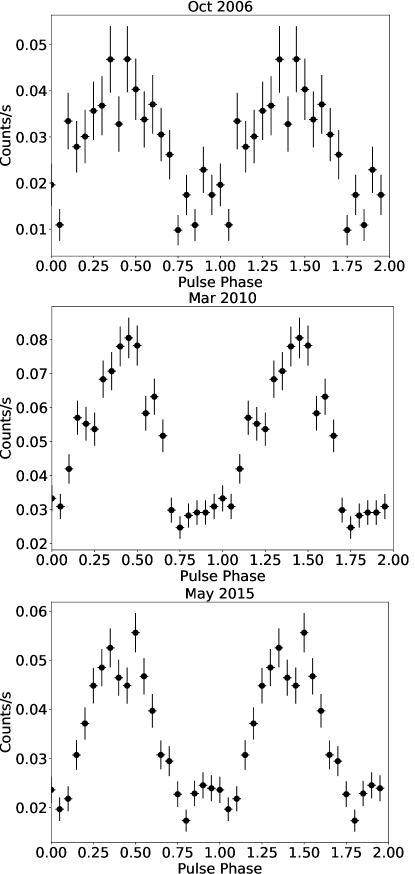
The background-subtracted pulse profiles of 3XMM J181923.7170616 in 0.3–10 keV are shown in Figure 2, in which one phase corresponds to a period of 407.904 s. The pulse profile maintains a nearly single-peak shape in 2006, 2010, and 2015, with small variation in the profile.
3.2 Spectral Analysis
The XMM-Newton and Swift spectra are extracted from a circular region centered at 3XMM J181923.7170616 with a radius of . The local background is selected from an annulus region centered at the point source with an inner radius of and an outer radius of .
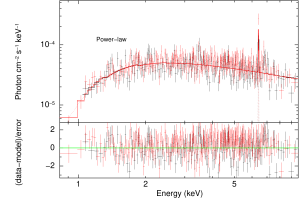
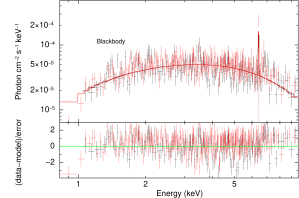
In order to obtain an overall properties of 3XMM J181923.7170616, first we produce two merged spectra of XMM-Newton (MOS1+2 and pn) by combining the long-time data of each instrument. As shown in the left panel of Figure 3, the spectra can be well described by an absorbed - model with a photon index of plus a Gaussian line at keV (). The Tübingen-Boulder interstellar medium absorption model is used for calculating the foreground absorption and the solar abundances are adopted from Asplund et al. (2009). The best-fit foreground absorption is (see spectral results in Table 2) obtained using merged XMM-Newton spectra. Although the fit can be slightly improved () after adding a Gaussian line at 6.7 keV, the line is too faint to be well constrained and is not clear in individual spectra. Therefore, we only include the 6.4 keV iron emission for spectral fit. We also model the spectra with an absorbed model plus a 6.4 keV line, which gives an best-fit absorption of and a temperature of . The fit results in a slightly larger than the - fit and displays large residuals keV and 7 keV (see the right panel of Figure 3). Other models, such as and , are tried but do not provide acceptable fit.
| Model 1: - | ||||||
|---|---|---|---|---|---|---|
| Year | Fe norma | Flux (1–10 keV) | ||||
| () | (cm-2s-1) | ( s-1) | ||||
| Merged | 1.11/404 | 2.81 | ||||
| 2006 | 0.99/116 | 2.83 | ||||
| 2010 | 1.13/423 | 2.69 | ||||
| 2013 | 0.90/91 | 3.44 | ||||
| Model 2: blackbody | ||||||
| Year | Fe norma | Flux (1–10 keV) | ||||
| () | (keV) | (cm-2s-1) | ( s-1) | |||
| Merged | 1.20/402 | 2.48 | ||||
| 2006 | 0.97/116 | 2.44 | ||||
| 2010 | 1.17/423 | (fixed) | 2.56 | |||
| 2013 | 0.92/91 | (fixed) | 2.98 | |||
Note. — The errors are estimated at the 90% confidence level.
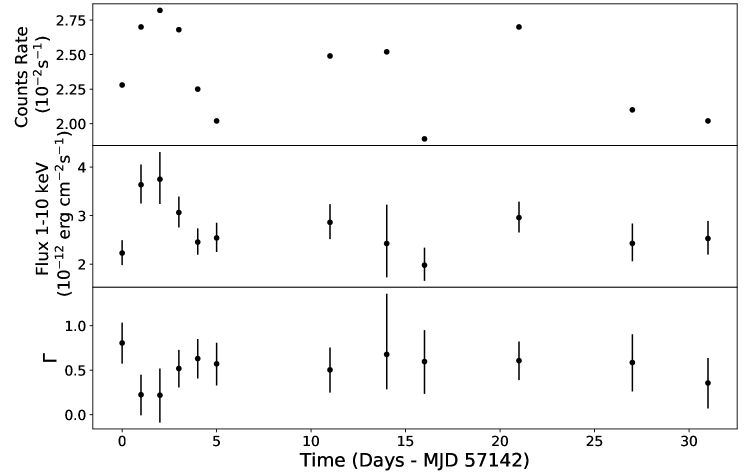
We subsequently model the spectra in each year to investigate the spectral evolution. The XMM-Newton spectra in each year are jointly fitted (MOS1, MOS2 and pn). We fit the spectra with the absorbed -/ models plus a 6.4 keV Gaussian line and show the best-fit results in Table 2. The - model generally provides a better fit than the model, especially for describing the low-energy spectra. The variation of can not be well constrained with the currently available data. The X-ray flux in 1–10 keV was in 2006, and was not significantly changed in 2010. The observation in 2013 was subject to flaring and we cannot further validate the nature of the flux change. A short-term spectral variation was revealed from the 12 Swift observation in 2015, with the 1–10 keV flux increased by within 2 days (MJD 57142–57143; see Figure 4). The flux varied between and , with a hardening as the flux increased.
We also perform a phase-resolved spectroscopic analysis of the XMM-Newton spectra. We divide the source time series of the XMM-Newton data into four individual phases: –0.2 (valley), 0.2–0.4, 0.4–0.6 (peak), 0.6–0.8 phases (see Figure 5). We apply the absorbed -/ models to jointly fit the spectra in the four phases (MOS 1 and MO2 are merged). The fit results are shown in Table 3.
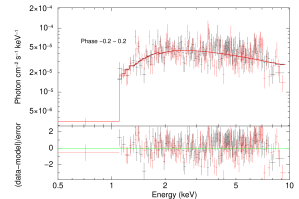
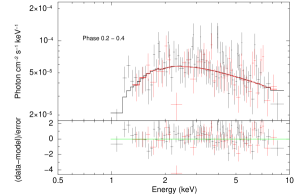
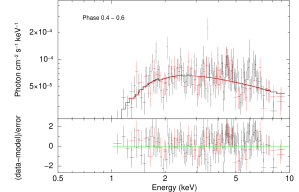
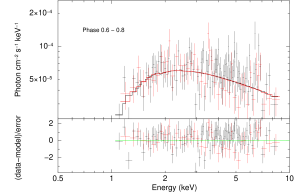
The absorbed - model can best describe () the spectra of all phases (see Figure 5), with an average column density of – and a photon index . Since the absorption value of phase 0.6–0.8 can not be constrained under the model, we fix this value to the result of the merged spectra. The table shows that among the phases there is little change to the parameters other than the flux. We have also examined the Fe K emission line flux in each phase, and have not found a significant change of the Fe line flux. Hereafter, we adopt the - results as they best describe the spectra.
| Model 1: power-law | |||||
|---|---|---|---|---|---|
| Phase | Flux(1-10) | ||||
| () | ( erg cm-2s-1) | ||||
| -0.2 – 0.2 | 1.22/269 | 2.56 | |||
| 0.2 – 0.4 | 1.14/115 | 3.17 | |||
| 0.4 – 0.6 | 1.15/173 | 3.88 | |||
| 0.6 – 0.8 | 1.17/137 | 3.27 | |||
| Model 2: blackbody | |||||
| Phase | Flux(1-10) | ||||
| () | (keV) | ( erg cm-2s-1) | |||
| -0.2 – 0.2 | 1.30/269 | (fixed) | 2.30 | ||
| 0.2 – 0.4 | 1.20/115 | 2.74 | |||
| 0.4 – 0.6 | 1.18/173 | 3.47 | |||
| 0.6 – 0.8 | 1.30/137 | (fixed) | 2.78 | ||
Note. — The errors are estimated at the 90% confidence level.
4 Discussion
We have shown that 3XMM J181923.7170616 is a pulsating X-ray source with a period of 407.904(7) s and a spin down rate of . The spectra is best characterized with a hard power-law with Fe lines at 6.4 keV and 6.7 keV. The flux in 1–10 keV has varied between 2–, and spectral index was in the range of 0.2–0.8. It appears to be a persistent source without luminous burst detected during the observation epochs. The absorption column density determined by XMM observations is similar to the value of the Galactic hydrogen column density – in this direction (Willingale et al. 2013). It implies that the X-ray source is distant and possibly located near the boundary of the Galactic plane. We conservatively set the lower limit of the distance of the X-ray source to the rotation tangent position at kpc. Hereafter the distance is parameterized as kpc, given that the interstellar gas distribution along the line of sight is uncertain.
4.1 Search for optical and near-infrared counterpart
We searched in the archival data and catalogues for the optical and near-IR counterparts of 3XMM J181923.7170616. The 1 positional uncertainty for 90% of the point sources in the 3XMM catalog is .
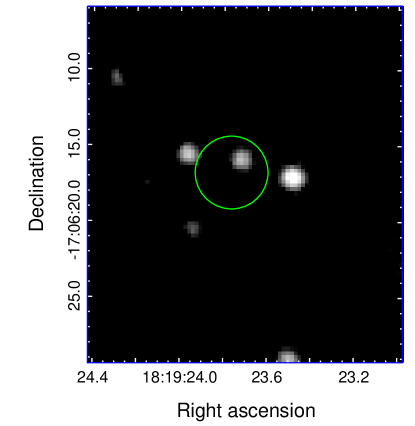
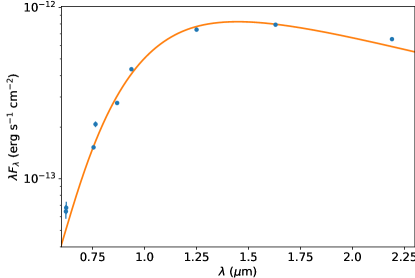
Using the VizieR catalogue access tool (Ochsenbein et al. 2000), we found a faint optical source (source #1; , , J2000) with the apparent magnitudes and in the VPHAS+ DR2 point source catalog (Drew et al. 2014, 2016), which is away from 3XMM J181923.7170616. It also shows an H line with a magnitude of . The optical source spatially matches a near-IR source (, , and ,) recorded in the UKIDSS Galactic Plane Survey (Lucas et al. 2012). We also notice that it matches the source PSO J181923.731-170616.083 in the Panoramic Survey Telescope and Rapid Response System (Pan-STARRS) survey (Chambers et al. 2016). Source #1 was detected in the r,i,z,y bands among the five filter bands used in the Pan-STARRS survey. Figure 6 shows the I-band image of the optical source. In Figure 7, we show the spectral energy distribution (SED) of source #1. It includes photometry in the bands mentioned above. We fit the SED with an absorbed blackbody model, while the absorbed power-law model can not explain the convex spectra. The V-band absorption of is converted from the foreground absorption cm-2 using a conversion factor cm-2 (Foight et al. 2016). The ratio of total to selective extinction at V band is adopted for the calculation of the absorption at each wavelength. The fit shows that source #1 has an effective temperature of and luminosity of . The temperature and luminosity of source #1 is similar to a giant star with a spectral type of K3 III.
There is another near-IR UKIDSS source located away (source #2; , , J2000) with , , and , which might be the same source with , , and in the GLIMPSE source catalog. The blackbody fit shows that source #2 has a temperature of and luminosity of .
The spectra of source #1 and #2 are not compatible with OB supergiants () or hot main-sequence stars () Nevertheless, we can not exclude the possibility that the donor star of 3XMM J181923.7170616 is a Be and the emission of the stellar component was not detected with current surveys. Some Be stars exhibit IR excess with a blackbody temperature of thousands of kelvin, which is attributed to the circumstellar material (Zhang et al. 2005). Assuming a detection limit of 21 magnitude in V band, current surveys may fail to detect a star with an absolute magnitude at an assumed distance of 30 kpc (near Galactic edge; ), which corresponds to a main-sequence star no earlier than B3-type. It is also unclear whether the two IR sources are relevant or only foreground/background sources projected near 3XMM J181923.7170616. Further targeted optical and IR observations are needed to achieve a firm conclusion.
The position accuracy of 3XMM J181923.7170616 can be improved by performing an astrometric analysis with the Swift-XRT data products generator333http://www.swift.ac.uk/user objects/. The position coordinates are derived from the XRT data product detecting and localizing all sources in the image, and then matching them with the 2MASS catalogue sources (Evans et al. 2014). This substantially increases the position accuracy to a 90% confidence error radius of centered at , , which is consistent with the position of the optical–IR source #1.
4.2 The nature of 3XMM J181923.7170616
3XMM J181923.7-170616 was considered to be a candidate of a slowly spinning X-ray pulsar (Farrell et al. 2015) and its nature remained unclear. Based on the analysis described above, we here discuss three possible scenarios for the nature of the X-ray source: an isolated NS, a cataclysmic variable (CV) or an X-ray binary.
If 3XMM J181923.7170616 is an isolated NS, the long period and the period derivative would suggest a rotational energy loss , which is insufficient to power the observed X-ray emission (). In this case, the long period and low would suggest that the source is not a classical rotation powered NS, but may be a magnetar. Magnetars are NSs with ultra-strong magnetic fields and their X-ray emission is powered by the decay of the magnetic fields (Thompson & Duncan 1995, 1996; Thompson et al. 2002). The known magnetars have periods 2-12 s, except one candidate 1E 1613485055 in the supernova remnant RCW 103 showing surprisingly large period of 6.67 hr (De Luca et al. 2006). Besides the anomalous long period, the X-ray emission of 3XMM J181923.7170616 appears to be much more stable than magnetars undergoing outbursts, when the magnetars are up to times brighter than the steady state and then experience a decay lasting a few weeks to months (Rea & Esposito 2011). It also can not be a quiescent magnetar, since the quiescent X-ray emission of a mangnetar is soft according to the magneto-thermal evolution model (Viganò et al. 2013) and observations (a power-law photon index = 1.5-4 or blackbody temperature = 0.1-0.7 keV; Olausen & Kaspi 2014). Moreover, the iron line at 6.4 keV supports the existence of cold materials surrounding the source. Therefore, the isolated pulsar explanation is not favored according to the spectral behaviors.
3XMM J181923.7170616 is more luminous than CVs which have a typical luminosity (Burenin et al. 2016). CVs show blackbody radiation during the outburst state (Mukai et al. 2003), while in quiescent state the emission becomes optically thin and presents multi-temperature Bremsstrahlung radiation (Mukai 2001, Richman et al. 1996, Bernardini et al. 2012). The X-ray emission of 3XMM J181923.7170616 does not show significant variation and the spectra cannot be well fitted with an optically thin model, making the CV explanation unlikely.
The remaining possibility is an X-ray binary. Since only one periodicity has been found with the Swift and XMM-Newton data, we need to discuss whether the 408 s is a spin period or an orbital period. According to the Kepler’s third law, the orbital period depends on the masses of the primary () and the donor (), and the separation between them (): . Assuming and for an NS, the separation are obtained as and , respectively (for a donor mass of and , where is the solar radius). If the 408 s is an orbital period, the companion radius must be much smaller than solar radius (e.g., a degenerate companion), and the X-ray source could be a ultra-compact LMXB with the smallest known among its group. However, the hard spectra ( or keV) are atypical for those low-level accretion LMXBs ( and ; e.g., Wijnands et al. 2015; in’t Zand et al. 2005; Wijnands et al. 2006) or for those in the quiescent (temperature of less than a few hundred eV; ; e.g., Heinke et al. 2003). Therefore, we suggest the 408 s is the pulsar spin period.
The long spin period and hard X-ray spectra widely exist in HMXBs. The hard power-law emission can be interpreted as Comptonization of the thermal photons by the high-energy electrons. 3XMM J181923.7170616 is unlikely to be a SGXB due to the absence of OB supergiant at its location (see Section 4.1). The X-ray properties of the source indeed well matches the characteristics of persistent Be X-ray binaries, including the long pulse period (), persistent and low-luminosity (), low X-ray variability and hard spectrum with faint Fe 6.4 keV line (Reig & Roche 1999; Reig 2011). In this case, the NS is orbiting in a low-density region of the Be star’s wind. This explanation is waiting to be tested, given that no massive star earlier than B3 has been detected at the position of 3XMM J181923.7170616.
SyXBs are a new group of XRBs that display some X-ray properties similar to HMXBs but are systems that host a K/M-type giant as its donor. These objects display long pulse periods (), low luminosity, and hard power-law spectra (0.5–2; Enoto et al. 2014). As mentioned in Section 4.1, an optical/IR source spatially consistent 3XMM J181923.7170616 shows characteristics of an K3 giant. The SyXBs scenario is therefore most favorable nature of 3XMM J181923.7170616 due to the existence of a late type counterpart candidate.
Hence, 3XMM J181923.7170616 is most likely an SyXB with a K-type giant donor (source #1, see Figure 6). An alternative possibility is that it is a persistent BeXB with a companion star no earlier than B3. Future X-ray and optical monitoring observations will shed light on the other period and the type of the companion star, so as to confirm the nature of 3XMM J181923.7170616.
5 Summary
We have performed a detailed X-ray analysis of 3XMM J181923.7170616 using the XMM-Newton and Swift observations spanning over 9 years. The main conclusions are the following:
-
1.
We have accurately determined the spin period of and discovered the spinning down of the source with (). The pulse shape is similar to a sinusoid profile and does show significant change in 9 yrs.
-
2.
3XMM J181923.7170616 emits persistent X-ray emission which is best characterized by an absorbed power-law emission with and plus two Fe lines at 6.4 keV and 6.7 keV. The source experienced a small flux variation (2–), with a spectral hardening as the flux increased. No burst activities have been observed during the observation epochs. We performed phase-resolved spectroscopy and do not find significant change of , and the flux of 6.4 keV line between different phases.
-
3.
The absorption column density of 3XMM J181923.7170616 is similar to the total Galactic along its direction, indicating that it is a distant source. We searched for optical and IR counterparts from the archival surveys, and exclude the existence of a Galactic OB supergiant. We discover an optical counterpart with a temperature and luminosity similar to a K3-type giant.
-
4.
We discussed the nature of 3XMM J181923.7170616 by comparing its properties with those of isolated NSs, CVs and X-ray binaries. It is unlikely to be an isolated magnetar, given the relatively small variability, hard spectra, and the existence of surrounding cold materials as indicated by the 6.4 keV line. The luminosity and the spectra are also not consistent with the properties of a CV. An X-ray binary is the probable explanation. An SyXB is the favored nature of 3XMM J181923.7170616 and can essentially explain its low luminosity, slow pulsation, hard spectrum, and possible late type companion. An alternative explanation of the source is a persistent Be/X-ray binary with a companion star no earlier than B3-type.
References
- Asplund et al. (2009) Asplund, M., Grevesse, N., Sauval, A. J., & Scott, P. 2009, ARA&A, 47, 481
- Bernardini et al. (2012) Bernardini, F., de Martino, D., Falanga, M., et al. 2012, A&A, 542, A22
- Burenin et al. (2016) Burenin, R. A., Revnivtsev, M. G., Tkachenko, A. Y., et al. 2016, Astronomy Letters, 42, 240
- Chambers et al. (2016) Chambers, K. C., Magnier, E. A., Metcalfe, N., et al. 2016, arXiv:1612.05560
- De Luca et al. (2006) De Luca, A., Caraveo, P. A., Mereghetti, S., Tiengo, A., & Bignami, G. F. 2006, Science, 313, 814
- Drew et al. (2014) Drew, J. E., Gonzalez-Solares, E., Greimel, R., et al. 2014, MNRAS, 440, 2036
- Drew et al. (2016) Drew, J. E., Gonzalez-Solares, E., Greimel, R., et al. 2016, VizieR Online Data Catalog, 2341, http://adsabs.harvard.edu/abs/2016yCat.2341….0D
- Edwards et al. (2006) Edwards, R. T., Hobbs, G. B., & Manchester, R. N. 2006, MNRAS, 372, 1549
- Enoto et al. (2014) Enoto, T., Sasano, M., Yamada, S., et al. 2014, ApJ, 786, 127
- Evans et al. (2014) Evans, P. A., Osborne, J. P., Beardmore, A. P., et al. 2014, ApJS, 210, 8
- Farrell et al. (2015) Farrell, S. A., Murphy, T., & Lo, K. K. 2015, ApJ, 813, 28
- Foight et al. (2016) Foight, D. R., Güver, T., Özel, F., & Slane, P. O. 2016, ApJ, 826, 66
- Heinke et al. (2003) Heinke, C. O., Grindlay, J. E., Lugger, P. M., et al. 2003, ApJ, 598, 501
- Hobbs et al. (2006) Hobbs, G. B., Edwards, R. T., & Manchester, R. N. 2006, MNRAS, 369, 655
- in’t Zand (2005) in’t Zand, J. J. M. 2005, A&A, 441, L1
- Leahy (1987) Leahy, D. A. 1987, A&A, 180, 275
- Lü et al. (2012) Lü, G.-L., Zhu, C.-H., Postnov, K. A., et al. 2012, MNRAS, 424, 2265
- Mukai et al. (2003) Mukai, K., Kinkhabwala, A., Peterson, J. R., Kahn, S. M., & Paerels, F. 2003, ApJ, 586, L77
- Mukai (2001) Mukai, K. 2001, arXiv:astro-ph/0112048
- Negueruela (1998) Negueruela, I. 1998, A&A, 338, 505
- Ochsenbein et al. (2000) Ochsenbein, F., Bauer, P., & Marcout, J. 2000, A&AS, 143, 23
- Olausen & Kaspi (2014) Olausen, S. A., & Kaspi, V. M. 2014, ApJS, 212, 6
- Rea & Esposito (2011) Rea, N., & Esposito, P. 2011, Astrophysics and Space Science Proceedings, 21, 247
- Reig (2011) Reig, P. 2011, Ap&SS, 332, 1
- Reig & Roche (1999) Reig, P., & Roche, P. 1999, MNRAS, 306, 100
- Richman (1996) Richman, H. R. 1996, ApJ, 462, 404
- Rosen et al. (2016) Rosen, S. R., Webb, N. A., Watson, M. G., et al. 2016, A&A, 590, A1
- Strüder et al. (2001) Strüder, L., Briel, U., Dennerl, K., et al. 2001, A&A, 365, L18
- Thompson et al. (2002) Thompson, C., Lyutikov, M., & Kulkarni, S. R. 2002, ApJ, 574, 332
- Thompson & Duncan (1995) Thompson, C., & Duncan, R. C. 1995, MNRAS, 275, 255
- Turner et al. (2001) Turner, M. J. L., Abbey, A., Arnaud, M., et al. 2001, A&A, 365, L27
- UKIDSS Consortium (2012) UKIDSS Consortium 2012, VizieR Online Data Catalog, 2316,
- Viganò et al. (2013) Viganò, D., Rea, N., Pons, J. A., et al. 2013, MNRAS, 434, 123
- Wijnands et al. (2015) Wijnands, R., Degenaar, N., Armas Padilla, M., et al. 2015, MNRAS, 454, 1371
- Wijnands et al. (2006) Wijnands, R., in’t Zand, J. J. M., Rupen, M., et al. 2006, A&A, 449, 1117
- Willingale et al. (2013) Willingale, R., Starling, R. L. C., Beardmore, A. P., Tanvir, N. R., & O’Brien, P. T. 2013, MNRAS, 431, 394
- Zhang et al. (2005) Zhang, P., Chen, P. S., & Yang, H. T. 2005, New A, 10, 325