On the precise determination of the Tsallis parameters in proton - proton collisions at LHC energies
T. Bhattacharyya1***email: trambak.bhattacharyya@uct.ac.za, J. Cleymans1†††email: jean.cleymans@uct.ac.za,
L. Marques2‡‡‡email: lmarques.if@gmail.com,
S. Mogliacci1§§§email: sylvain.mogliacci@uct.ac.za, M. W. Paradza1,3¶¶¶email: mwparadza@gmail.com
1UCT-CERN Research Centre and Department of Physics, University of Cape Town,
Rondebosch 7701, South Africa
2Instituto de Física, Universidade de São Paulo-IFUSP, Rua do Matão,
Travessa R187, 05508-900 São Paulo, São Paulo, Brazil
3 Department of Physics and Astronomy,
University of The Western Cape, Bellville 7535, South Africa
Abstract
A detailed analysis is presented of the precise values of the Tsallis parameters obtained in collisions for identified particles, pions, kaons and protons at the LHC at three beam energies and TeV. Interpolated data at 5.02 TeV have also been included. It is shown that the Tsallis formula provides reasonably good fits to the distributions in collisions at the LHC using three parameters , and . However, the parameters and depend on the particle species and are different for pions, kaons and protons. As a consequence there is no scaling and also no universality of the parameters for different particle species.
PACS Indices: 12.38.Aw, 13.60.Le, 14.40.Lb, 14.40Nd
1 Introduction
It is well accepted that the transverse momentum distributions in high energy collisions are described by a power law distribution at the Relativistic Heavy Ion Collider (RHIC) [1, 2, 3] as well as at the Large Hadron Collider (LHC) [4, 5, 6, 7, 8].
In this paper we investigate in detail one particular form of power law distribution which has been used extensively in the literature [9, 10, 11, 12, 13, 14, 15, 16, 17, 18, 19, 20, 21, 22, 23, 24, 25, 26, 27] given by [28]
| (1) |
where and are two parameters to be determined. It is referred to as the Tsallis distribution [28] and forms the basis for non-extensive statistical thermodynamics. It has been shown [29, 30] that the corresponding pressure, the particle number and energy densities obey the usual thermodynamic consistency relations and the parameter is indeed related to the entropy via
| (2) |
albeit that the entropy is the Tsallis entropy and not the standard Boltzmann-Gibbs one. Therefore we refer to the parameter as temperature. The physical interpretation of the parameter and the connection between the Tsallis temperature and the Boltzmann-Gibbs one were elucidated in [31]. A few years ago it was suggested that the parameters appearing in the Tsallis distribution are the same for a wide range of identified hadrons [29, 30] at = 900 GeV in collisions. Subsequently several analyses have appeared which do not support this conclusion. Due to the size of the errors and the uncertainties on some of the parameters it was not completely possible to eliminate this option at = 900 GeV but further analyses at higher energies are not in support of the original ansatz and led to the proposal of having sequential freeze-outs depending on the particle type [32, 33, 34, 35].
In this paper we focus on the data of the ALICE collaboration [43, 44, 45] and determine the parameters appearing in the Tsallis distribution as precisely as possible at beam energies of = 0.9, 2.76 and 7 TeV. We have also included the interpolated spectra provided by the ALICE collaboration at = 5.02 TeV [36].
The fits were performed over the full range of the available range. In order to test the quality of the extrapolation to very high values of we included at the end a fit to the spectrum of charged particles as measured by the CMS collaboration [37] which extends to values of up to 200 GeV.
The conclusion we reach is that for the ’s, ’s and protons the parameters are different and no universality in the parameters exists. Thus, even though the Tsallis distribution provides a reasonable description of the transverse momenta distributions, it has to be concluded that the parameters are clearly different.
In this paper we do not add radial flow to the Tsallis distribution. A considerable effort was spent on making fits with radial flow using a blast-wave formalism as was done by the authors in references [26, 38] but in the end we concluded that radial flow, even though it adds at least one parameter to the fitting procedure, does not improve the quality of the fits in collisions. We note that reference [10] uses a similar procedure but with a considerable number of parameters (at least 8). Also the radial flow is made to depend on the hadron considered, it is different for pions, kaons and protons. In the end we decided to go for the simplest form as far as possible and use the smallest number of parameters. Also, our results show that the temperature is comparable for kaons and for protons at higher beam energies which does not have a natural explanation in the radial flow scenario.
One open question, concerning the effect of feed-down decays from resonances, remains. This has been considered in great detail in annihilation in [39]. The calculations are however much more involved and at the moment it does not look feasible to repeat such an analysis in the energy range of the LHC.
2 Tsallis Distribution
The following form is used for the transverse momentum distribution of hadrons produced at LHC energies [29, 30]
| (3) |
where and are the transverse momentum and transverse mass respectively, being the rapidity, is the degeneracy factor, i.e. for since these are pseudoscalar particles while for protons and antiprotons because of their spin 1/2 nature. is the volume of the system. Since particles and antiparticles are produced equally abundantly at LHC energies there is no need for the introduction of chemical potentials. At lower energies it would, of course, be necessary to take a chemical potential into account. The resulting values of and are for a system at kinetic freeze-out. The fact that the right-hand side of Eq. (3) only depends on is known as scaling.
Eq. 3 is a generalisation of the standard Boltzmann-Gibbs distribution, in the limit where one recovers
| (4) |
hence, many concepts familiar from statistical mechanics can be carried over to the distribution presented in Eq. 3.
As noted in [40], Eq. (3) can be integrated over the transverse momentum, leading to
| (5) | |||||
where is the mass of the considered particle.
From Eq. (5), we can express the volume in terms of and the parameters and as
| (6) |
Thus, replacing the volume in Eq. (3) by the more accessible it can be rewritten as
| (7) | |||||
It has to be noted that, in order to have a positive number of particles, must be less than the value 3/2. A similar consideration for a positive energy density leads to an even stronger constraint, namely <4/3 [41, 42].
It is also worth mentioning that the parameterization given in Eq. (7) is close to the one used for fitting the data taken at RHIC and LHC experiments [1, 2, 3, 4, 5, 6, 7, 43], which is given by
| (8) |
where and are fit parameters. There is no justification in calling the parameter a temperature. Notice that Eq. (8) shows the same dependence on the transverse momentum as Eq. (3) except for an additional factor which is present in Eq. (7) but not in Eq. (8). Omission of this additional factor of leads to values of which are clearly larger, about double the values presented in this paper.
3 Analysis of the transverse momentum spectra
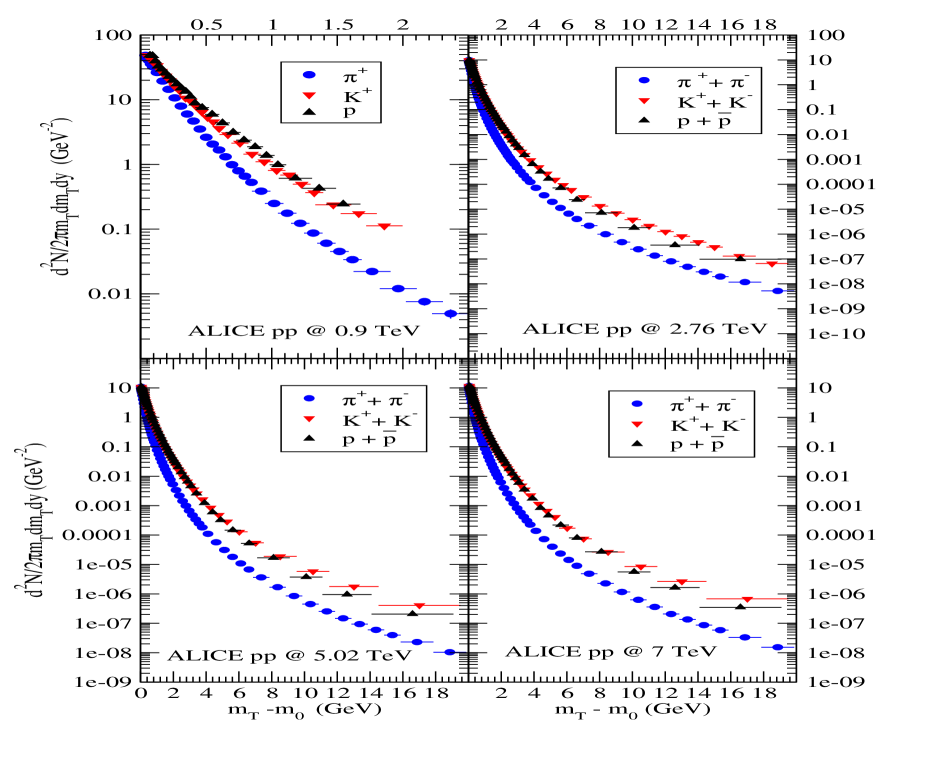
The Tsallis parameters were determined by fitting the experimental results published by the ALICE collaboration for collisions at three different beam energies [43, 44, 45] to Eq. (7). For completeness we also considered the data extrapolated by the ALICE collaboration at 5.02 TeV [36]. The results are shown in Figures 1 and 2 and will be discussed sequentially in the following subsections.
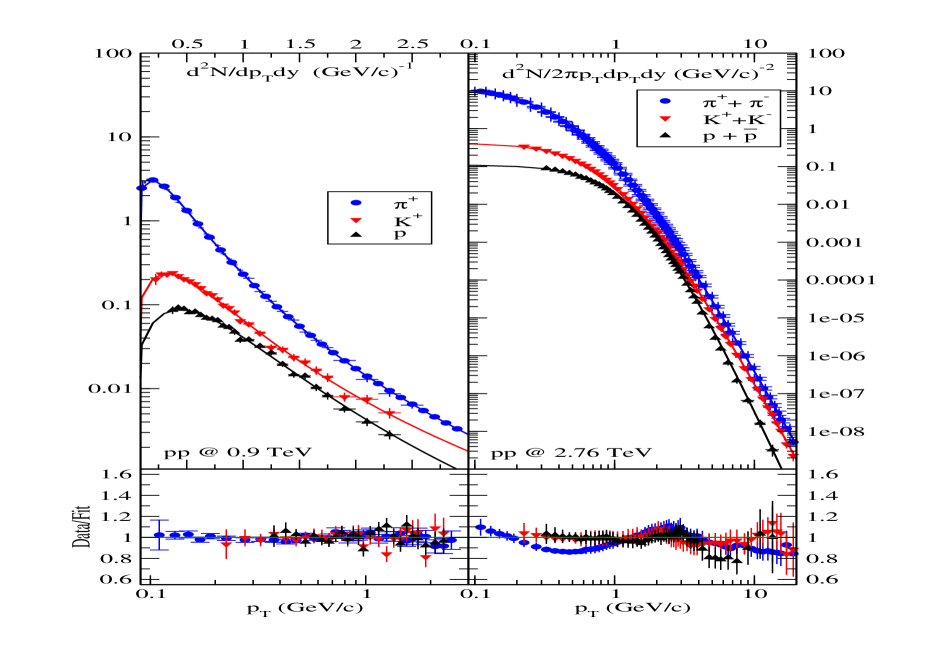
3.1 Fits to transverse momentum spectra at the beam energy of 900 GeV
Of all the beam energies considered in this analysis, the one at 900 GeV has the smallest range in , namely about an order of magnitude less than the ones at 2.76 and 7 TeV. Figure 1 shows the results for particles and . The results for and are compatible with those for and and are not shown.
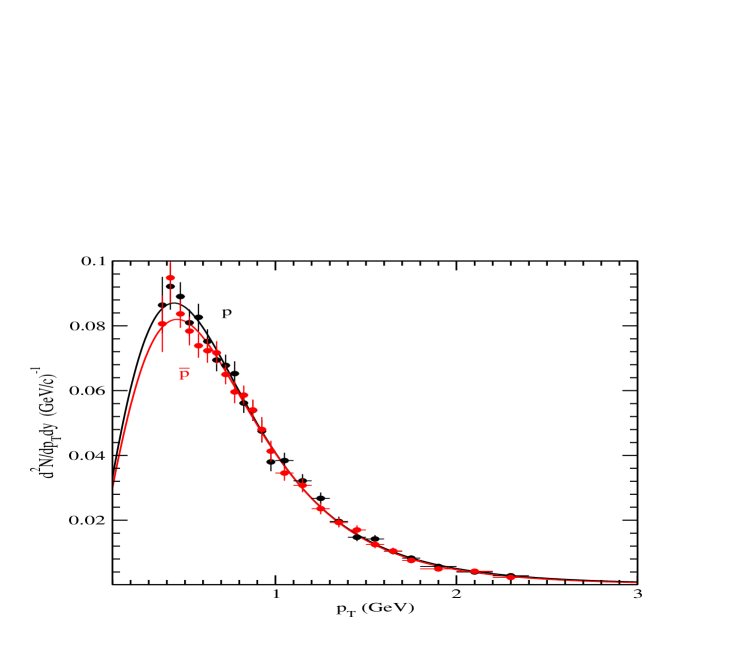
The comparison between protons and antiprotons is shown separately in Fig. 3 and deserves some further discussion. As can be seen, the difference comes mainly from the (low) 0.6 GeV region, while the two distributions nicely overlap for higher values of . It is to be noted that the integrated quantities, i.e. the values of as well as , are in good agreement. The resulting parameters have large errors but are compatible within one standard deviation: for protons is 17 28 MeV with being 1.160 0.025; for antiprotons the value of is 52 30 while is 1.132 0.025. A combined fit of protons and antiprotons yields values with smaller errors, namely for = 47 10 MeV and = 1.136 0.007. The central values of thus differ by a factor of more than two between protons and antiprotons.
A summary of the resulting values for the beam energy of GeV is shown in Table 1. Especially, the values for deviate clearly from those obtained for and even for the combined fit of protons and antiprotons. An earlier analysis gave consistent values, however, with large error bars [29], these are not confirmed by the present analysis.
| Particle | (GeV) | / NDF | (GeV) | ||
|---|---|---|---|---|---|
| 1.488 0.019 | 1.148 0.005 | 0.070 0.002 | 22.73 / 30 | 0.408 0.023 | |
| 1.479 0.018 | 1.145 0.005 | 0.072 0.002 | 15.83 / 30 | 0.408 0.022 | |
| 0.184 0.004 | 1.175 0.016 | 0.057 0.012 | 13.02 / 24 | 0.663 0.142 | |
| 0.182 0.004 | 1.161 0.015 | 0.064 0.012 | 6.214 / 24 | 0.641 0.202 | |
| 0.083 0.002 | 1.160 0.025 | 0.017 0.028 | 14.52 / 21 | 0.773 0.270 | |
| 0.079 0.002 | 1.132 0.025 | 0.052 0.030 | 13.82 / 21 | 0.766 0.250 | |
| + | 1.136 0.007 | 0.047 0.010 |
This difference in the Tsallis parameters comes as a surprise since the integrated proton and antiproton yields are equal within the uncertainties. Our interpretation is that within the measured range of transverse momenta, it is not possible to determine precisely the values of the Tsallis parameters. To emphasize this we show in Figure 4 the contour of 1- uncertainties in the plane.
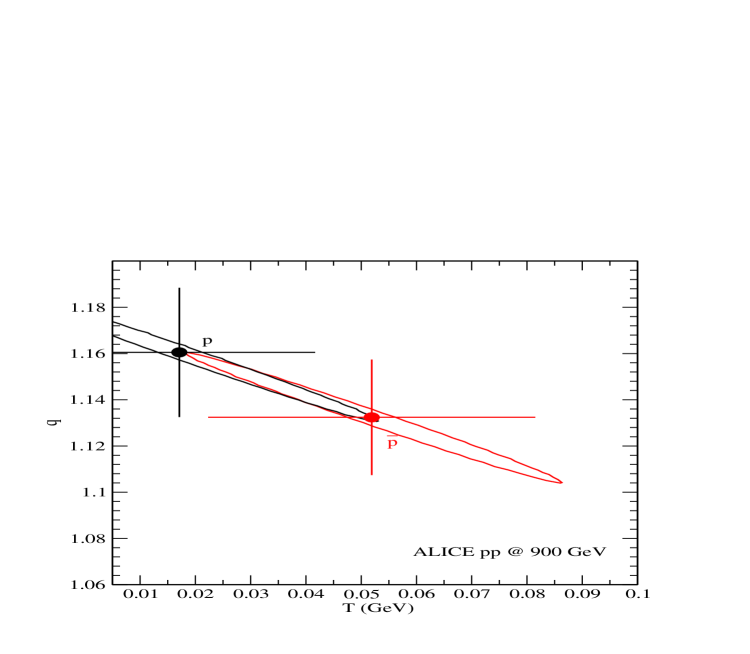
The proposed universality of the Tsallis parameters at = 900 GeV can therefore not be established. There is no ambiguity in determining the parameters for the pion distributions. Differences are apparent at very small values of as can be clearly seen in Figure 3.
The values of listed in the Table 1 were determined as follows. Using the values of the transverse momentum distribution for a given value of
| (9) |
for the data at 900 GeV and by
| (10) |
for all other beam energies. Both are calculated using the Tsallis distribution with the optimised values of , and . We then compare this theoretical result with the experimental values to determine a value of
| (11) |
where is the experimental value of the momentum distribution at the same value of and is the experimental error on the distribution. A similar procedure was used in all the subsequent tables. We add the index to emphasize that these values refer to the error bars on the ordinate () axis.
3.2 Fits to transverse momentum spectra at the beam energy of 2.76 TeV
The transverse momentum spectra at = 2.76 TeV have been measured in a range extending up to about 20 GeV/c. The fit is shown in Figure 2 and the resulting values of the parameters are listed in Table 2. It can be seen that the values of and are much more constrained than in the previous case of = 900 GeV. If the possibility of common values could not be entirely excluded in the previous case, there is no doubt here that the values are different.
The resulting values for the beam energy of TeV are shown in Table 2.
| Particle | (GeV) | / NDF | (GeV) | ||
|---|---|---|---|---|---|
| 3.967 0.083 | 1.149 0.002 | 0.077 0.001 | 242.8 / 60 | 0.442 0.011 | |
| 0.463 0.010 | 1.144 0.002 | 0.096 0.003 | 10.55 / 55 | 0.706 0.024 | |
| 0.209 0.006 | 1.120 0.005 | 0.087 0.009 | 26.35 / 46 | 0.835 0.056 |
3.3 Fits to transverse momentum spectra for the interpolated data at 5.02 TeV
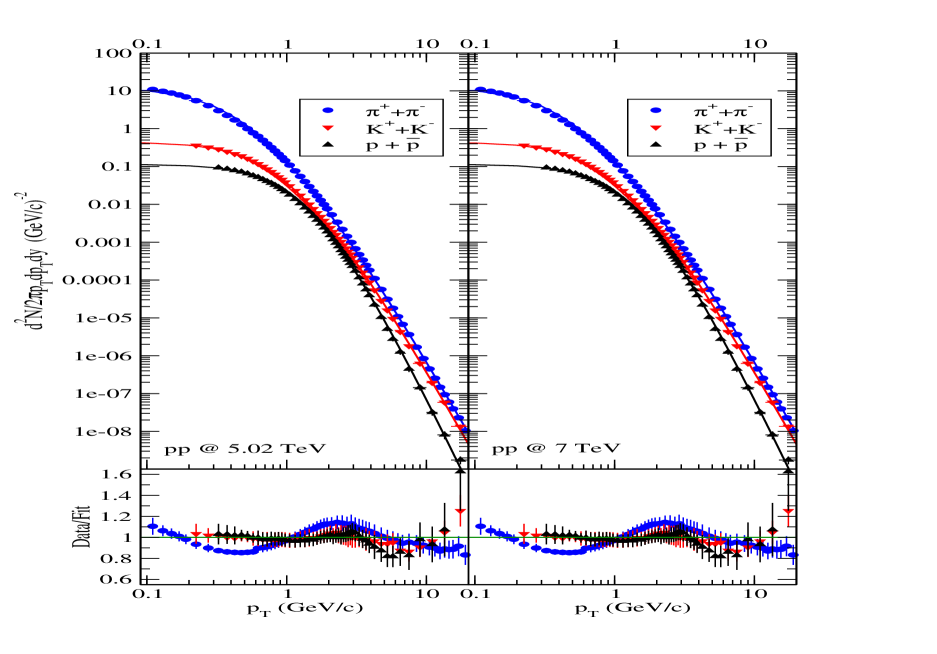
For the transverse momentum spectra at = 5.02 TeV we have used the results presented by the ALICE collaboration [36] (in a range extending up to about 20 GeV/c) by interpolating their own data at 2.76 TeV and 7 TeV. The fit is shown in Figure 2. The resulting values of the parameters are given in Table 3. Again the values of and are much more constrained than for = 900 GeV. As in the previous case, no common values of the parameters and can be found.
| Particle | (GeV) | / NDF | (GeV) | ||
|---|---|---|---|---|---|
| 4.452 0.095 | 1.155 0.002 | 0.076 0.002 | 266.3 / 60 | 0.452 0.016 | |
| 0.530 0.011 | 1.150 0.005 | 0.099 0.006 | 12.11 / 55 | 0.750 0.049 | |
| 0.235 0.007 | 1.126 0.005 | 0.091 0.009 | 18.89 / 46 | 0.877 0.059 |
We would like to emphasize that all these results will have to be confirmed by the final analysis of the 5.02 TeV data.
3.4 Fits to transverse momentum spectra at the beam energy of 7 TeV
4 Analysis of the results
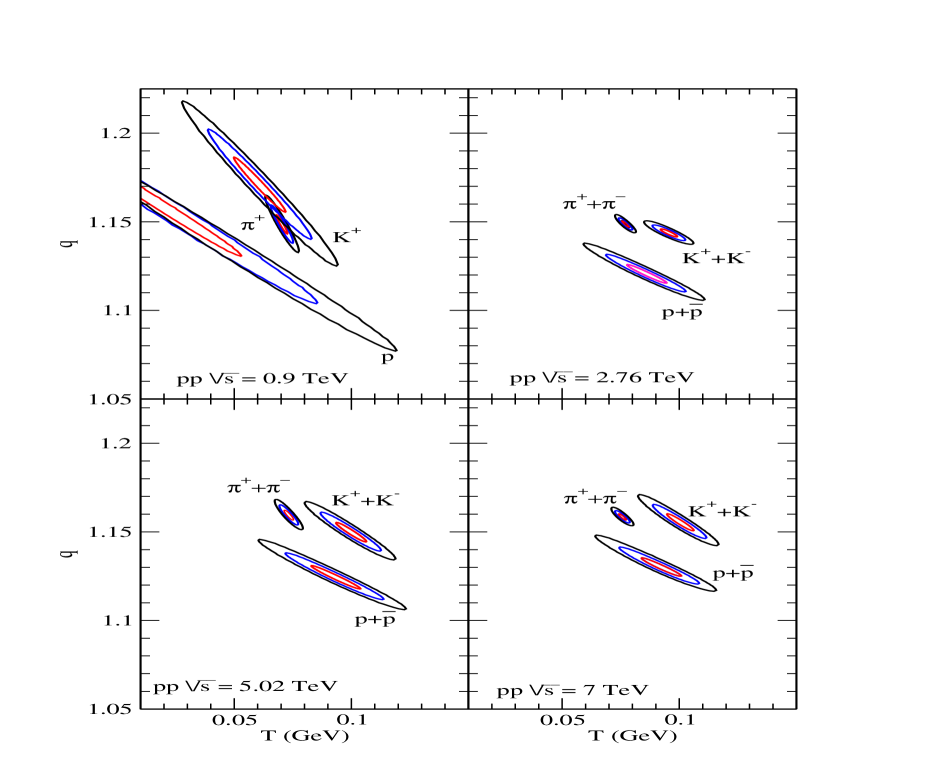
In Figure 5 we show contours in the plane. The ellipses correspond to fixed values of deviations from the minimum values, 1- uncertainties on the fit parameters are shown in red, 2- uncertainties are shown in blue, while those with 3- uncertainties are shown in black.
At 0.9 TeV (upper left-hand pane in Figure 5) it can be seen that while the pions and kaons do overlap in a small region, this is not the case for the protons, albeit there is a wide range of possible values for the latter so that an eventual complete overlap for all three particles cannot really be excluded. A wider range in or a more precise measurement of the very low region is necessary to really exclude this eventuality.
At TeV (upper right-hand pane in Figure 5), it can be seen that the values of and are much more constrained than in the previous case of 0.9 TeV. If the possibility of common values could not be discarded in the case of TeV, there is no doubt here that the values are different. The same goes for the TeV results (lower right-hand pane in Figure 5), and no common values of the parameters and can be found, nor any strict scaling because the parameters are different for each species.
We notice that the 7 TeV case has been discussed previously [11, 13, 19], within the framework of the Tsallis distribution. The authors from [11, 13] use a different form of the Tsallis distribution, not having a factor on the right-hand side of Eq. (3) and hence they obtain higher values for the parameter (recalling that this is no longer a temperature in the thermodynamic sense).
Within the framework considered here, the values for and obtained from the ALICE collaboration data are close to those of the CMS collaboration [46], as shown in the contour plot presented in Figure. 5. The CMS contours are indeed being situated as roughly equidistant from each of the ALICE ones for pions, kaons and protons. This comes as a surprise since at those large values of the transverse momentum , hard scattering processes are presumed to be dominant.
In Figure 6 we show the transverse mass distributions for pions, kaons and protons at different beam energies. It is clearly seen that there is no scaling because of the differences for each particle type.
In Figure 7 we summarize some of the results separately for protons (upper pane), kaons (middle pane) and pions (lower pane). We notice here that our results clearly show that the fitted temperature is often comparable for kaons and for protons, which does not have a natural explanation in the radial flow scenario. In addition, the fitted parameter is also often comparable for pions and kaons. As a consequence, different groups of nearly scaling appear (see Figure 6), groups whose characteristic allowing for differentiating them could well be the mass range of the given particles.
We also notice that the resulting values for at mid-rapidity are fully compatible (if not identical) to the values quoted by the ALICE collaboration using a slightly different parameterization for the transverse momentum distribution.
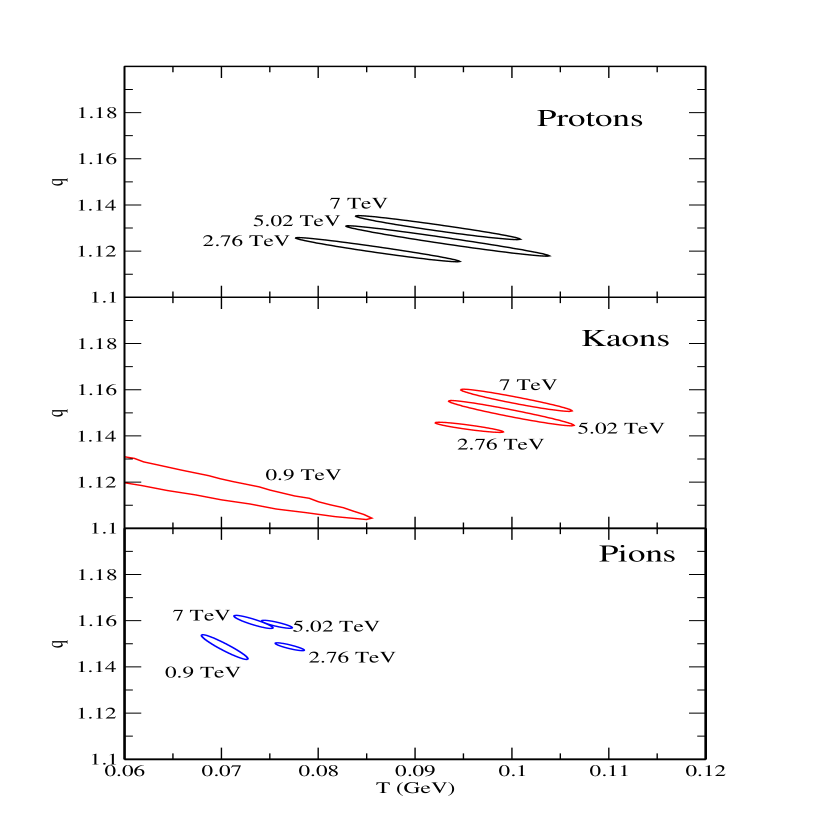
Finally there is also a clear beam energy dependence in the values of the parameters. The results obtained at 0.9 TeV are out of line, presumably because of the limited range in at this beam energy. Discarding for the moment the results at 0.9 TeV, one can see a clear shift for the pions towards higher values for but unchanged values of . For protons the opposite result is seen, namely a shift towards higher temperatures but the values for are almost independent on the beam energy. For kaons the pattern is different again, namely an almost constant value for the temperature but a clear increase in the value of .
5 Large Transverse Momenta
In order to get a feeling for the limit of applicability of the Tsallis distribution given in Eq. 3 we applied the results obtained above to the highest transverse momenta measured by the CMS collaboration [37] for charged particles up to 200 GeV/c in collisions at a beam energy of 7 TeV. To achieve this we simply added , , using the parameters listed in Table 4. This has been done using the following expression:
| (12) |
where . The relative weights between particles were determined by the
corresponding degeneracy factors and given by = = 1 and = 2.
The factor 2 on the right hand side shows the contribution from the antiparticles, and .
There are of course more charged particles than
just , and protons (and their respective antiparticles) used here but it should be close to a
good approximation of the total number of charged particles.
The result is shown in Figure 8 and the description of the data is quite appropriate.
The lower pane of the figure shows the ratio of experimental data over fit values. There are indications that the
description using the Tsallis distribution deviates from measurements for higher values of but this is also the region where the uncertainty is largest.
It is to be concluded that the Tsallis distribution provides a reasonably good description up to the highest measured values of .
The oscillations
seen in previous fits [47, 48, 49] are due to a simplified use of the Tsallis distribution which
does not distinguish between
pions, kaons and protons.

6 Conclusions
In this paper we have thoroughly investigated one particular form of power tail distribution which is based on non-extensive statistical thermodynamics and has the property of having consistent thermodynamic relations for the particle number, the energy, the pressure and the entropy.
We have determined the parameters appearing in the Tsallis distribution as precisely as possible at beam energies of = 0.9, 2.76 and 7 TeV. The conclusion we reach is that for the ’s, ’s and protons the parameters are different and no universality in the parameters exist. At the beam energy of = 0.9 TeV, the interval in transverse momentum is fairly narrow and the uncertainty on the parameters is large so that the original analysis [29, 30] made such a scenario possible.
The suggestion, made a few years ago, that the parameters appearing in this distribution are the same for a wide range of identified hadrons [29, 30] at = 900 GeV in p-p collisions is therefore not supported by the analysis presented here.
Thus, even though the Tsallis distribution provides a reasonable description of the transverse momenta distributions, it has to be concluded that the parameters are clearly different. As a consequence, one basic property of the Tsallis distribution, namely scaling in the transverse mass is not obeyed because the relevant parameters change for different hadrons.
At last, our conclusions are as follows:
-
•
The Tsallis formula provides reasonably good fits to the distributions in collisions at the LHC using three parameters , and .
-
•
The parameters and depend on the particle species and are different for pions, kaons and protons. No universal behavior has been found.
-
•
As a consequence of this, there is no scaling.
Acknowledgments
T. B. would like to acknowledge the University Research Committee, University of Cape Town, South Africa for its
financial support. S. M. would like to acknowledge the financial support from the Claude Leon Foundation.
The work of J.C. is based on research supported by the National Research Foundation (NRF) of South Africa.
References
- [1] B. I. Abelev, et al., Phys. Rev. C75, 064901 (2007).
- [2] A. Adare, et al., Phys. Rev. D83, 052004 (2011).
- [3] A. Adare, et al., Phys. Rev. C83, 064903 (2011).
- [4] K. Aamodt, et al., Eur. Phys. J. C71, 1655 (2011).
- [5] V. Khachatryan, et al., JHEP 02, 041 (2010).
- [6] V. Khachatryan, et al., Phys. Rev. Lett. 105, 022002 (2010).
- [7] G. Aad, et al., New J. Phys. 13, 053033 (2011).
- [8] B. B. Abelev, et al., Eur. Phys. J. C73, 2662 (2013).
- [9] V. Cirigliano, G. M. Fuller, A. Vlasenko, Phys. Lett. B747, 27 (2015).
- [10] S. Grigoryan, Phys. Rev. D95, 056021 (2017).
- [11] C.-Y. Wong, G. Wilk, L. J. L. Cirto, C. Tsallis, Phys. Rev. D91, 114027 (2015).
- [12] O. Ristea, C. Ristea, A. Jipa, Eur. Phys. J. A53, 91 (2017).
- [13] G. Bíró, G. G. Barnaföldi, T. S. Biró, K. Ürmössy, Á. Takács, Entropy 19, 88 (2017).
- [14] A. S. Parvan, Eur. Phys. J. A53, 53 (2017).
- [15] A. S. Parvan, O. V. Teryaev, J. Cleymans, Eur. Phys. J. A53, 102 (2017).
- [16] S. Tripathy, et al., Eur. Phys. J. A52, 289 (2016).
- [17] H. Zheng, L. Zhu, Adv. High Energy Phys. 2016, 9632126 (2016).
- [18] L. Marques, J. Cleymans, A. Deppman, Phys. Rev. D91, 054025 (2015).
- [19] M. D. Azmi, J. Cleymans, Eur. Phys. J. C75, 430 (2015).
- [20] J. Cleymans, et al., Phys. Lett. B723, 351 (2013).
- [21] I. Sena, A. Deppman, Eur. Phys. J. A49, 17 (2013).
- [22] M. D. Azmi, J. Cleymans, J. Phys. G41, 065001 (2014).
- [23] T. S. Biro, A. Jakovac, Phys. Rev. Lett. 94, 132302 (2005).
- [24] A. Khuntia, S. Tripathy, R. Sahoo, J. Cleymans, Eur. Phys. J. A53, 103 (2017).
- [25] P. K. Khandai, P. Sett, P. Shukla, V. Singh, Int. J. Mod. Phys. A28, 1350066 (2013).
- [26] H. Zheng, L. Zhu, A. Bonasera, Phys. Rev. D92, 074009 (2015).
- [27] B. De, Eur. Phys. J. A50, 138 (2014).
- [28] C. Tsallis, J. Statist. Phys. 52, 479 (1988).
- [29] J. Cleymans, D. Worku, J. Phys. G39, 025006 (2012).
- [30] J. Cleymans, D. Worku, Eur. Phys. J. A48, 160 (2012).
- [31] G. Wilk, Z. Wlodarczyk, Phys. Rev. Lett. 84, 2770 (2000).
- [32] D. Thakur, S. Tripathy, P. Garg, R. Sahoo, J. Cleymans, Adv. High Energy Phys. 2016, 4149352 (2016).
- [33] H.-L. Lao, F.-H. Liu, B.-C. Li, M.-Y. Duan (2017). ArXiv:1703.04944.
- [34] H.-L. Lao, F.-H. Liu, R. A. Lacey, Eur. Phys. J. A53, 44 (2017). [Erratum: Eur. Phys. J. A53, no. 6, 143 (2017)].
- [35] D. Thakur, S. Tripathy, P. Garg, R. Sahoo, J. Cleymans, Acta Phys. Polon. Supp. 9, 329 (2016).
- [36] J. Adam, et al., Phys. Lett. B760, 720 (2016).
- [37] S. Chatrchyan, et al., JHEP 08, 086 (2011).
- [38] K. Jiang, et al., Phys. Rev. C91, 024910 (2015).
- [39] L. Ferroni, F. Becattini, Eur. Phys. J. C71, 1824 (2011).
- [40] M. Rybczynski, Z. Wlodarczyk, Eur. Phys. J. C74, 2785 (2014).
- [41] M. Ishihara, Int. J. Mod. Phys. E25, 1650066 (2016).
- [42] T. Bhattacharyya, J. Cleymans, S. Mogliacci, Phys. Rev. D94, 094026 (2016).
- [43] K. Aamodt, et al., Phys. Lett. B693, 53 (2010).
- [44] B. B. Abelev, et al., Phys. Lett. B736, 196 (2014).
- [45] J. Adam, et al., Eur. Phys. J. C75, 226 (2015).
- [46] S. Chatrchyan, et al., Eur. Phys. J. C72, 2164 (2012).
- [47] G. Wilk, Z. Wlodarczyk, Acta Phys. Polon. B46, 1103 (2015).
- [48] G. Wilk, Z. Wlodarczyk, Chaos Solitons Fractals 81, 487 (2015).
- [49] G. Wilk, Z. Wlodarczyk, Physica 486, 579 (2017).