Structurally Triggered Metal-Insulator Transition in Rare-Earth Nickelates
Rare-earth nickelates form an intriguing series of correlated perovskite oxides. Apart from LaNiO3, they exhibit on cooling a sharp metal-insulator electronic phase transition, a concurrent structural phase transition and a magnetic phase transition toward an unusual antiferromagnetic spin order. Appealing for various applications, full exploitation of these compounds is still hampered by the lack of global understanding of the interplay between their electronic, structural and magnetic properties. Here, we show from first-principles calculations that the metal-insulator transition of nickelates arises from the softening of an oxygen breathing distortion, structurally triggered by oxygen-octahedra rotation motions. The origin of such a rare triggered mechanism is traced back in their electronic and magnetic properties, providing a united picture. We further develop a Landau model accounting for the evolution of the metal-insulator transition in terms of the cations and rationalising how to tune this transition by acting on oxygen rotation motions.
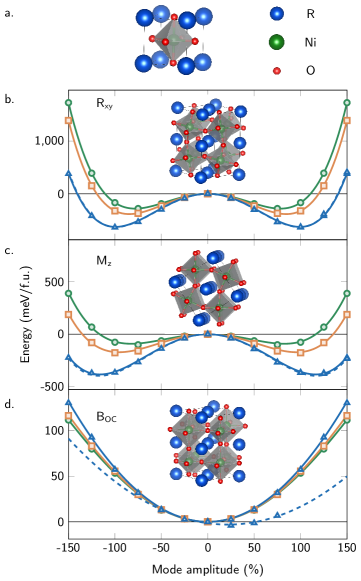
First synthetized in 1971 Demazeau1971 , rare-earth nickelates (NiO3, with rare earth) are appealing for various applications Shi2013 ; Zhou2016 and the possibility to tune their properties in epitaxial films and heterostructures Middey2016 has recently fuelled an even larger interest Forst2015 ; Kim2016 ; Grisolia2016 . NiO3 compounds belong to the family of perovskite oxides with a reference cubic structure (Fig. 1a), nevertheless not directly observed. Apart for LaNiO3, which always keeps a metallic phase and will not be further discussed here, all NiO3 adopt at reasonably high temperature a metallic orthorhombic phase Catalan2008 . This phase, rather ubiquitous Benedek2013 amongst perovskites with small Goldschmidt tolerance factor Catalan2008 , , corresponds to a distortion of the cubic structure arising from the appearance of (i) combined anti-phase rotations of the oxygen octahedra along the and directions, (Fig. 1b), with the same amplitude and (ii) in-phase rotations of the oxygen octahedra along , (Fig. 1c), with amplitude .
In this phase, all Ni atoms are equivalent and formally in a Jahn-Teller active (likely low spin) configuration. Surprisingly, although compatible with the symmetry, cooperative Jahn-Teller distortions do not appear. Instead, at a temperature which strongly evolves with the cation (i.e with ) Medarde1997 , NiO3 compounds exhibit an electronic metal-insulator transition (MIT), which was shown to be concurrent with a structural transition from to monoclinic symmetry Alonso1999 . This symmetry lowering is accompanied with the appearance of a breathing distortion of the oxygen octahedra, (Fig. 1d), which alternatively expand and contract with amplitude , according to a rock-salt pattern. This gives rise to two types of Ni sites with long and short Ni–O bonds respectively.
At low temperature (100-200K), NiO3 compounds finally show a magnetic phase transition toward an unusual E’-type antiferromagnetic (AFM) spin order identified by a Bragg vector in pseudocubic notation Garcia-munoz1994 ; Alonso1999 ; Lee2011 . For large cations ( Nd and Pr), the Neel temperature and the system goes directly from paramagnetic metal (PM-M) to AFM insulator (AFM-I). For smaller cations, is much lower than ; the two phase transitions are decoupled and the system goes through an intermediate paramagnetic insulating phase (PM-I).
The origin of the MIT has been widely debated in the literature Torrance1992 ; Mizokawa2000 ; Raebiger2008 ; Park2012 ; Ruppen2015 ; Varignon2016 . It was sometimes interpreted as a charge disproportionation at Ni sites Mazin2007 : . However, the importance of Ni 3d – O 2p hybridization – i.e., transfer of electrons from O to Ni and formation of oxygen holes (L) keeping Ni in a configuration (i.e., ) – was evoked early on Mizokawa2000 . Nowadays, the MIT is usually viewed as a charge ordering of the type Park2012 ; Johnston2014 ; Bisogni2016 . In this scenario, appears important to stabilise the charge ordering and open the gap. As suggested in Ref. De_la_cruz2002 and confirmed from statistical correlation techniques Balachandran2013 , and are also expected to play an active role. However, a complete picture linking electronic, structural and magnetic properties is yet to emerge.
Unlike recent theoretical studies which were focusing specifically on the electronic properties Park2012 ; Johnston2014 ; Ruppen2015 ; Varignon2016 , we investigate here self-consistently the electronic and structural degrees of freedom of NiO3 compounds from density functional theory calculations (DFT, see Methods). Specific care was given to the validation of our approach, which turns out to provide an unprecedented agreement with experimental data. Focusing on YNiO3, we show (see Supplementary S1) that not only the atomic structure but also the AFM-E’ ground state, the estimated and the electronic bandgap of the insulating phase are very accurately reproduced, making therefore our approach a method of choice to shed light on the interlink between these different features.
We start from the reference cubic structure. Inspection of the phonon dispersion curves (see Supplementary S2) reveals dominant structural instabilities at R ( 310i cm-1) and M ( = 278i cm-1) points of the Brillouin zone (BZ), which are associated respectively to the and distortions responsible for the phase. These imaginary frequencies are linked to a negative energy curvature at the origin () and to a typical double-well (DW) shape of the energy when freezing and distortions of increasing amplitude within the cubic structure, as illustrated in Fig. 1. These wells are nearly independent of the spin order but strongly evolve with the cation : they become shallower when size increases, consistently with a reduction of the related distortion amplitudes in the phase.
In contrast, the motion, corresponding to another phonon at R, is stable and extremely stiff (in fact the stiffest mode with 700 cm-1), in line with the single well (SW) shape illustrated in Fig. 1. Decreasing -cation size tends to stabilise slightly further , in apparent contradiction with the observed increase of . As illustrated for YNiO3, switching from ferromagnetic (FM) to AFM-E’ spin order reduces slightly the curvature but does not reverse it; instead it shifts the SW to lower energy Lee2011 , yielding a finite at the minimum. Although tends to make the system insulating, this amplitude (25% of ground-state’s value) is however not large enough to open a gap (more than 75% would be required). This shows that and the magnetic order only cannot explain the MIT by themselves.
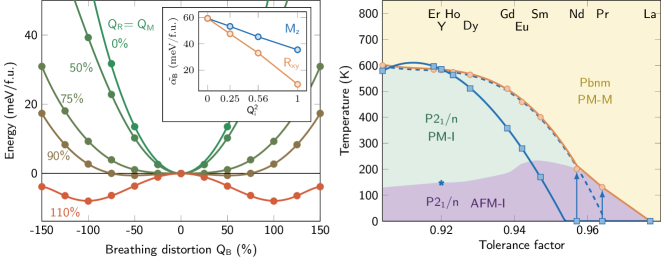
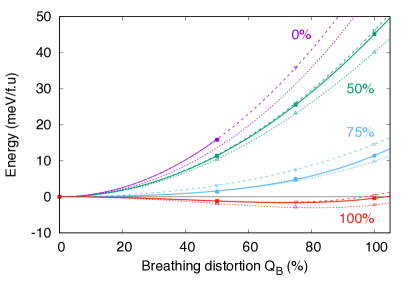
Our central result is presented in Fig. 2 where we report the evolution of the energy well of YNiO3 at various fixed amplitudes of oxygen rotation motions. It highlights that, although initially stable (SW), is progressively destabilized (DW) by the appearance of and . As illustrated in the inset, is renormalized into which evolves linearly with and . The slope associated to is twice as large as that related to , attesting that each of the three individual rotations similarly affects . This behavior arises from the presence in the energy expansion of cooperative () bi-quadratic coupling terms between and oxygen rotations (, ) which, being the lowest-order couplings allowed by symmetry, should give rise to the appearance of through a "triggered" phase transition according to Holakovsky Holakovsky1973 . The same behavior is observed independently of the magnetic order (see Supplementary S3). From now we focus on representative FM results while coming back to the role of magnetism later.
To further assess the relevance of such a triggered mechanism in nickelates, we built a Landau model including , and degrees of freedom Balachandran2013 , restricting to lowest coupling terms and assuming temperature dependence of the oxygen rotations only :
| (1) | |||||
Within this model, and appear at and . On cooling, they progressively develop within the phase and renormalize the energy curvature of as made clear when grouping the terms in Eq. (1):
| (2) |
When reaching a critical amplitude at which , they trigger the appearance of and produce concurrent structural and metal-insulator phase transitions. The phase transition appears to be second order within this model, which is however too simple to be conclusive on this point (see Supplementary S3).
All parameters and their evolution with were directly fitted from first-principles; only Curie temperatures were uniformly scaled to reproduce the experimental of YNiO3 (see Supplementary S3). The phase diagram of nickelates as predicted within this model is reported in Fig. 2. This figure demonstrates that the cooperative coupling of with and is a key mechanism that, by itself, accounts for the experimentally observed evolution of with the tolerance factor.
Hence, the MIT in nickelates turns out to be a concrete example of triggered phase transitionFlerov1995 ; Iwata2007 , a kind of transition never identified before in simple perovskites. Indeed, although bi-quadratic interactions are generic in this class of compounds, different distortions usually compete and exclude each other Benedek2013 . The cooperative coupling of with oxygen rotations pointed out here is therefore an unusual and intriguing feature, whose origin is now traced back in the electronic band structure.
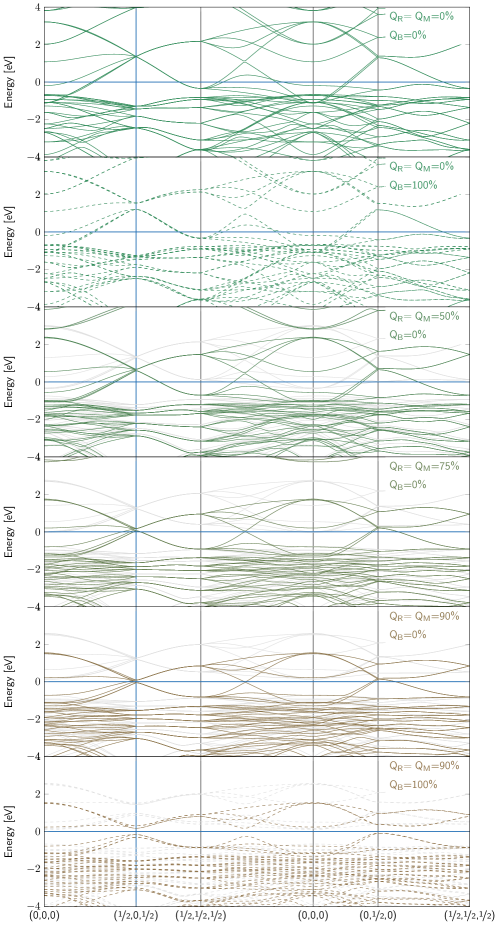
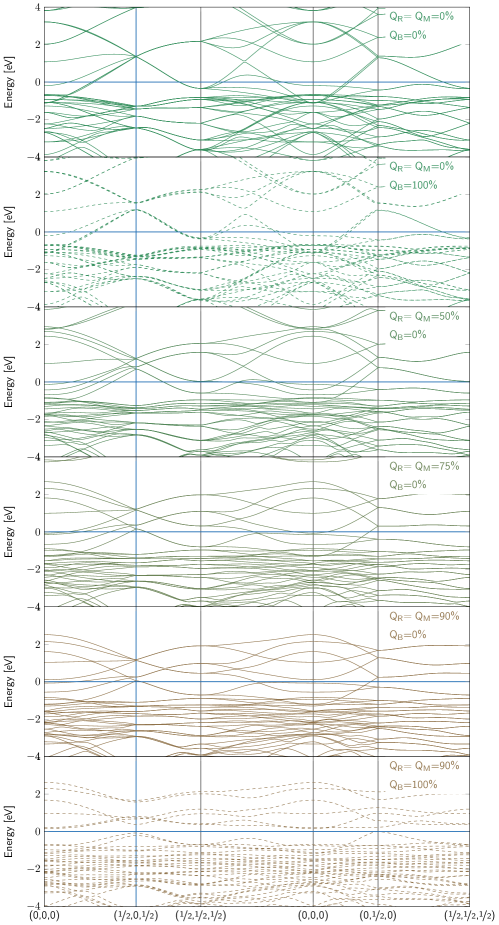
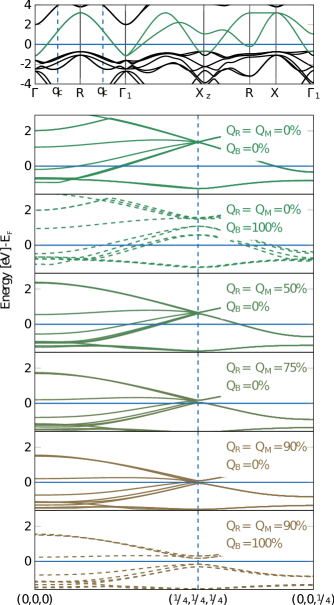
In the cubic phase, as expected from the formal Ni () occupancy, the Fermi energy crosses levels of dominant Ni - character (i.e. anti-bonding Ni - O states); such levels form an isolated and rather dispersive set of two bands, shifted above the levels by the crystal field (Fig. 3). Forcing into this cubic structure a distortion, associated to a phonon at , can open a gap at within the bands but well above and without any direct impact on the metallic character and the occupied states. Nevertheless, the oxygen rotation motions substantially affect the bands (Fig. 3), reducing their bandwidth and yielding a progressive down shift of the levels at . As the rotations gradually increase and the bandwidth decreases, more substantially pushes down the electronic states around , providing a progressive gain of electronic energy which, in turn, results in the softening of . The critical rotation amplitude at which becomes unstable () is precisely that at which the levels at cross . At these amplitudes, the electronic system itself becomes unstable; the appearance of is favored and opens a gap precisely at , making the system insulating. As such, the MIT can therefore be interpreted as a Peierls instability but one that is not initially present and has been triggered by oxygen rotations.
For compounds with small cations, and are large and able to produce the MIT at relatively high temperatures, well above . For large cations ( Nd, Pr), oxygen rotations are reduced and, from our Landau model (built on FM results), no more sufficient to trigger the MIT (Figure 2b). However, as previously mentioned, the AFM-E’ spin order is compatible by symmetry with and induces its appearance as an improper order (linear shift of SW, Fig. 1d). Hence, although not opening a gap in the cubic phase, the onset of the AFM-E’ order in the phase of NdNiO3 and PrNiO3 promotes the occurrence of the MIT almost triggered by the rotations. In these compounds, we have therefore ; the transition is more abrupt and first-order Catalan2008 . Such active role of magnetism for large cations is supported by the experimental results and discussion in Ref. Vobornik1999 . It is also confirmed by our first-principles calculations on NdNiO3, showing that the predicted is rescaled when including the change of magnetic order: while the system prefers to stay in the metallic phase when imposing a FM order, it switches to the phase when adopting a AFM-E’ order. The cooperative effect of the magnetic order remains true for small cations but without any impact on ().
In conclusion, the concurrent electronic and structural transitions at in NiO3 compounds take the form of a Peierls instability which, primarily, is structurally triggered by the oxygen rotation motions and and, eventually, is further assisted by the appearance of the E’-type AFM magnetic ordering. Our Landau model, and its possible extension to incorporate explicitly strain degrees of freedom neglected here for simplicity, provides a simple and useful quantitative tool to estimate and interpret how can be tuned toward the monitoring of oxygen rotation motions and when making solid-solutions Medarde1997 , applying pressure Catalan2008 or playing with the epitaxial strain and the orientation of the substrate in thin films Catalano2015 . Our findings are relevant to other families of perovskites like A2+Fe4+O3 compounds Akao2003 . For instance, they can explain why CaFeO3, which exhibits oxygen rotations, undergoes a MIT while SrFeO3 and BaFeO3, which stay cubic, remain metallic. In addition, the same physics is also inherent to manganites like LaMnO3, suggesting a close competition between charge and orbital orderings in this family compounds. However, the situation is slightly different in bismutate like BaBiO3, in which is intrinsically unstable in the cubic phase Lichtenstein1991 .
I Methods
First-principles calculations were performed in the framework of Density Functional Theory (DFT) Hohenberg1964 ; Kohn1965 using a Projected Augmented Wave (PAW) approach Blochl1994 as implemented within the ABINIT package Gonze2009 ; Gonze2002 ; Gonze2005 ; Torrent2008 . The calculations relied on the Generalized Gradient Approximation using the PBEsol Perdew2008 exchange-correlation functional. We worked within a collinear spin approximation. We included a Hubbard correction U = 1.5 eV Liechtenstein1995 on the orbitals of Ni atoms. A special care as been devoted to the determination of the appropriate U parameter (see Supplementary, Section S1).
We made use of JTH atomic potentials Jollet2014 . For the wave-functions, we used an energy cutoff of 24 Ha (38 Ha for the second grid in the PAW spheres), which guarantees a convergence better than 1 meV on the total energy. The Brillouin-zone was sampled with -point meshes equivalent to a grid in the 5-atoms unit cell. During structural relaxations, thresholds of Ha/bohr on the maximum force and of Ha/bohr3 on the maximum stress have been considered.
The Goldschmidt tolerance factor, Goldschmidt1926 , , of NiO3 compounds were determined using Nicole Benedek’s tool Benedek-tol relying on a bond valence model Lufaso2001 to calculate and , respectively the ideal –O and Ni–O bond lengths in the cubic perovskite structure.
Symmetry-adapted mode analysis have been performed with AMPLIMODE Orobengoa2009 ; Perez-Mato2010 . The modes are normalized to their amplitude in the AFM-E’ ground state. This normalization is such that in cubic phase (volume of the ground state) corresponds to rotation angles 11.33o (Ni-O-Ni angle of 157.33o) , corresponds to a rotation angle 12.12o (Ni-O-Ni angle of 155.75o) and corresponds to oxygen displacements .
The Landau model parameters have been fitted for YNiO3, GdNiO3 and SmNiO3 on first-principles data using in each case a FM cubic phase (volume of the ground state) and interpolated for the other compounds. was determined analytically (see Supplementary, Section S3).
II Supplementary Information
Supplementary Information is available in the online version of the paper.
III Acknowledgements
The authors thank Y. Zhang, E. Bousquet, F. Ricci, M. Verstraete, J.-Y. Raty, S. Catalano and J. Varignon for fruitful discussions. This work was supported by FRS-FNRS project HiT4FiT and ARC project AIMED. J.I. acknowledges support form FNR Luxembourg Grant P12/4853155 "COFERMAT". Calculations have been performed on the Céci facilities funded by F.R.S-FNRS (Grant No 2.5020.1) and Tier-1 supercomputer of the Fédération Wallonie-Bruxelles funded by the Walloon Region (Grant No 1117545). They also took advantage of HPC resources from the French Research and Technology Computing Center (CCRT) and from the PRACE project Megapasta.
References
- (1) Demazeau, G., Marbeuf, A., Pouchard, M. & Hagenmuller, P. Sur une série de composés oxygènes du nickel trivalent derivés de la perovskite. J. Solid State Chem. 3, 582 (1971).
- (2) Shi, J., Ha, S. D., Zhou, Y., Schoofs, F. & Ramanathan, S. A correlated nickelate synaptic transistor. Nature Communications 4, 2676 (2013).
- (3) Zhou, Y. et al. Strongly correlated perovskite fuel cells. Nature 534, 231–234 (2016).
- (4) Middey, S. et al. Physics of Ultrathin Films and Heterostructures of Rare-Earth Nickelates. Annual Review of Materials Research 46, 305–334 (2016).
- (5) Först, M. et al. Spatially resolved ultrafast magnetic dynamics initiated at a complex oxide heterointerface. Nature Materials 14, 883–888 (2015).
- (6) Kim, T. H. et al. Polar metals by geometric design. Nature 533, 68–72 (2016).
- (7) Grisolia, M. N. et al. Hybridization-controlled charge transfer and induced magnetism at correlated oxide interfaces. Nature Physics 12, 484–492 (2016).
- (8) Catalan, G. Progress in perovskite nickelate research. Phase Transitions 81, 729–749 (2008).
- (9) Benedek, N. A. & Fennie, C. J. Why are there so few perovskite ferroelectrics? The Journal of Physical Chemistry C 117, 13339–13349 (2013). eprint http://dx.doi.org/10.1021/jp402046t.
- (10) Medarde, M. L. Structural, magnetic and electronic properties of RNiO3 perovskites (R = rare earth). Journal of Physics: Condensed Matter 9, 1679 (1997).
- (11) Alonso, J. A. et al. Charge Disproportionation in Perovskites: Simultaneous Metal-Insulator and Structural Transition in . Physical Review Letters 82, 3871–3874 (1999).
- (12) García-Muñoz, J. L., Rodríguez-Carvajal, J. & Lacorre, P. Neutron-diffraction study of the magnetic ordering in the insulating regime of the perovskites RNiO3 R =Pr and Nd). Physical Review B 50, 978–992 (1994).
- (13) Lee, S., Chen, R. & Balents, L. Landau Theory of Charge and Spin Ordering in the Nickelates. Physical Review Letters 106, 016405 (2011).
- (14) Torrance, J. B., Lacorre, P., Nazzal, A. I., Ansaldo, E. J. & Niedermayer, C. Systematic study of insulator-metal transitions in perovskites RNiO3 R =Pr,Nd,Sm,Eu) due to closing of charge-transfer gap. Physical Review B 45, 8209–8212 (1992).
- (15) Mizokawa, T., Khomskii, D. I. & Sawatzky, G. A. Spin and charge ordering in self-doped Mott insulators. Physical Review B 61, 11263–11266 (2000).
- (16) Raebiger, H., Lany, S. & Zunger, A. Charge self-regulation upon changing the oxidation state of transition metals in insulators. Nature 453, 763–766 (2008).
- (17) Park, H., Millis, A. J. & Marianetti, C. A. Site-Selective Mott Transition in Rare-Earth-Element Nickelates. Physical Review Letters 109, 156402 (2012).
- (18) Ruppen, J. et al. Optical spectroscopy and the nature of the insulating state of rare-earth nickelates. Physical Review B 92, 155145 (2015).
- (19) Varignon, J., Grisolia, M. N., Íñiguez, J., Barthélémy, A. & Bibes, M. Reconciling the ionic and covalent pictures in rare-earth nickelates. arXiv:1603.05480 [cond-mat] (2016). ArXiv: 1603.05480.
- (20) Mazin, I. I. et al. Charge Ordering as Alternative to Jahn-Teller Distortion. Physical Review Letters 98, 176406 (2007).
- (21) Johnston, S., Mukherjee, A., Elfimov, I., Berciu, M. & Sawatzky, G. A. Charge Disproportionation without Charge Transfer in the Rare-Earth-Element Nickelates as a Possible Mechanism for the Metal-Insulator Transition. Physical Review Letters 112, 106404 (2014).
- (22) Bisogni, V. et al. Ground state oxygen holes and the metal-insulator transition in the negative charge transfer rare-earth nickelates. Nature Communications 7, 13017 (2016). ArXiv: 1607.06758.
- (23) de la Cruz, F. P. et al. Possible common ground for the metal-insulator phase transition in the rare-earth nickelates RNiO3 (R=Eu, Ho, Y). Physical Review B 66, 153104 (2002).
- (24) Balachandran, P. V. & Rondinelli, J. M. Interplay of octahedral rotations and breathing distortions in charge-ordering perovskite oxides. Physical Review B 88, 054101 (2013).
- (25) Holakovsky, J. A new type of ferroelectric phase transition. Phys. Stat. Sol. (b) 56, 615–619 (1973).
- (26) Flerov, I. N., Gorev, M. V., Voronov, V. N., Tressaud, A. & Grannec, J. Triggered phase transitions in Rb2KB3+F6(B3+: Er, ho) elpasolites. J. Solid State Chem. 3, 582 (1971).
- (27) Iwata, M., Zhao, C. H., Aoyagi, R., Maeda, M. & Ishibashi, Y. Splitting of triggered phase transition in Bi4-xLaxTi3O12 mixed crystals. Japonese Journal of Applied Physics 46, 5894 (2007).
- (28) Vobornik, I. et al. Electronic-structure evolution through the metal-insulator transition in . Phys. Rev. B 60, R8426–R8429 (1999).
- (29) Catalano, S. et al. Tailoring the electronic transitions of NdNiO3 films through (111)pc oriented interfaces. APL Materials 3, 062506 (2015).
- (30) Akao, T. et al. Charge-ordered state in single-crystalline CaFeO3 thin film studied by x-ray anomalous diffraction. Phys. Rev. Lett. 91, 156405 (2003).
- (31) Structural phase diagram and electron-phonon interaction in Ba1-xKxBiO3, author = Liechtenstein, A. I. and Mazin, I. I. and Rodriguez, C. O. and Jepsen, O. and Andersen, O. K. and Methfessel, M., journal = Phys. Rev. B, volume = 44, issue = 10, pages = 5388–5391, numpages = 0, year = 1991, month = Sep, publisher = American Physical Society, doi = 10.1103/PhysRevB.44.5388, url = https://link.aps.org/doi/10.1103/PhysRevB.44.5388 .
- (32) Hohenberg, P. & Kohn, W. Inhomogeneous electron gas. Phys. Rev. 136, B864–B871 (1964).
- (33) Kohn, W. & Sham, L. J. Self-consistent equations including exchange and correlation effects. Phys. Rev. 140, A1133–A1138 (1965).
- (34) Blöchl, P. E. Projector augmented-wave method. Phys. Rev. B 50, 17953–17979 (1994).
- (35) Gonze, X. et al. ABINIT: First-principles approach to material and nanosystem properties. Computer Physics Communications 180, 2582–2615 (2009).
- (36) Gonze, X. et al. First-principles computation of material properties: the ABINIT software project. Computational Materials Science 25, 478 – 492 (2002).
- (37) Gonze, X. et al. A brief introduction to the abinit software package .
- (38) Torrent, M., Jollet, F., Bottin, F., Zérah, G. & Gonze, X. Implementation of the projector augmented-wave method in the ABINIT code: Application to the study of iron under pressure. Computational Materials Science 42, 337–351 (2008).
- (39) Perdew, J. P. et al. Restoring the density-gradient expansion for exchange in solids and surfaces. Phys. Rev. Lett. 100, 136406 (2008).
- (40) Liechtenstein, A. I., Anisimov, V. I. & Zaanen, J. Density-functional theory and strong interactions: Orbital ordering in mott-hubbard insulators. Phys. Rev. B 52, R5467–R5470 (1995).
- (41) Jollet, F., Torrent, M. & Holzwarth, N. Generation of Projector Augmented-Wave atomic data: A 71 element validated table in the XML format. Computer Physics Communications 185, 1246–1254 (2014).
- (42) Goldschmidt, V. M. Die gesetze der krystallochemie. Naturwissenschaften 14, 477–485 (1926).
- (43) Benedek, N. Tolerance factor calculator v0.2.1 .
- (44) Lufaso, M. W. & Woodward, P. M. Prediction of the crystal structures of perovskites using the software program spuds. Acta Crystallogr. B 57, 725 (2001).
- (45) Orobengoa, D., Capillas, C., Aroyo, M. I. & Perez-Mato, J. M. AMPLIMODES: symmetry-mode analysis on the Bilbao Crystallographic Server. Journal of Applied Crystallography 42, 820–833 (2009).
- (46) Perez-Mato, J. M., Orobengoa, D. & Aroyo, M. I. Mode crystallography of distorted structures. Acta Crystallographica Section A 66, 558–590 (2010).
- (47) Alonso, J. A. et al. High-temperature structural evolution of R NiO 3 ( R = H o , Y , E r , Lu ) perovskites: Charge disproportionation and electronic localization. Physical Review B 64 (2001).
- (48) Prosandeev, S., Bellaiche, L. & Íñiguez, J. Ab initio study of the factors affecting the ground state of rare-earth nickelates. Physical Review B 85, 214431 (2012).
- (49) Muñoz, A., Alonso, J. A., Martínez-Lope, M. J. & Fernández-Díaz, M. T. On the magnetic structure of DyNiO3. Journal of Solid State Chemistry 182, 1982–1989 (2009).
- (50) Mercy, A., J., B. & Ghosez, P. Magnetic properties of YNiO3. unpublished (2017).
- (51) Arima, T., Tokura, Y. & Torrance, J. B. Variation of optical gaps in perovskite-type 3 d transition-metal oxides. Physical Review B 48, 17006–17009 (1993).
- (52) Perez-Cacho, J., Blasco, J., Garcia, J., Castro, M. & Stankiewicz, J. Study of the phase transitions in SmNiO3. J. Phys.: Condens. Matter 11, 405 (1999).
- (53) Nikulina, I., Novojilova, M., Kaulb, A., Maiorovab, A. & S.N., M. Synthesis and transport properties study of Nd1-xSmxNiO3-δ solid solutions. Materials Research Bulletin 39, 803 (2004).
- (54) Íñiguez, J., Ivantchev, S., Perez-Mato, J. M. & García, A. Devonshire-landau free energy of BaTiO3 from first principles. Phys. Rev. B 63, 144103 (2001).
- (55) Zhong, W., Vanderbilt, D. & Rabe, K. M. First-principles theory of ferroelectric phase transitions for perovskites: The case of BaTiO3. Phys. Rev. B 52, 6301–6312 (1995).
IV – Supplementary Information –
Structurally Triggered Metal-Insulator Transition
in Rare-Earth Nickelates
S1. Validation of the DFT+U approach
In order to assess the validity of our DFT+U approach and determine the appropriate U parameter, we have considered a wide range of possible values for U (from 0 to 8 eV) and have compared the computed structural, magnetic and electronic properties to experimental data.
The results are summarized below for YNiO3 considered as a test case. In line with what was reported independently in Ref. Varignon2016 , it appears that a DFT approach with a moderate U value of 1.5 eV provides for nickelates an unprecedented agreement with experimental data, combining accurate description not only of the structural but also of the magnetic and electronic properties. It therefore offers a robust and ideal framework for the study of the interplay between these properties.
IV.1 A. Atomic structure
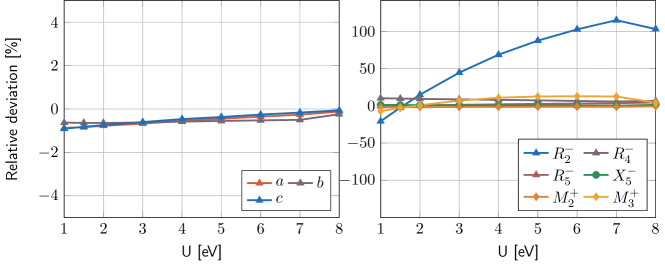
In Figure S1, we report the relative deviations respect to experimental data at low temperature Alonso2001 for the lattice parameters and atomic distortions in the E’-type AFM phase of YNiO3 in terms of the amplitude of the U parameter. The atomic distortions are those with respect to the phase and are quantified from a symmetry-adapted mode analysis performed with AMPLIMODE Orobengoa2009 ; Perez-Mato2010 . The labels of the modes that are allowed by symmetry in the and phases and a brief description of the related atomic motions are reported in Table S1.
| Labels | Atomic motion | ||
|---|---|---|---|
| Anti-phase rotations of O octahedra along and () | x | x | |
| In-phase rotations of O octahedra along () | x | x | |
| Anti-polar (layered) motion of cations () | x | x | |
| Jahn-Teller distortion of O octahedra () | x | x | |
| Anti-polar motion (rocksalt) of cations () | x | x | |
| Breathing distortion of the O octahedra () | x | ||
| Anti-polar motion of O () | x | ||
| Jahn-Teller distortion of O octahedra () | x |
We see in Figure S1 that the lattice parameters are rather independent of U and well described within the whole range (error smaller than ). At the level of the atomic distortions, the amplitude of breathing mode () is only properly described in the limit of small U values. For the dominant modes like () or (), although the relative errors remain reasonably small for any U, the absolute amplitude evolves significantly with U and also converge to the correct values at low U.
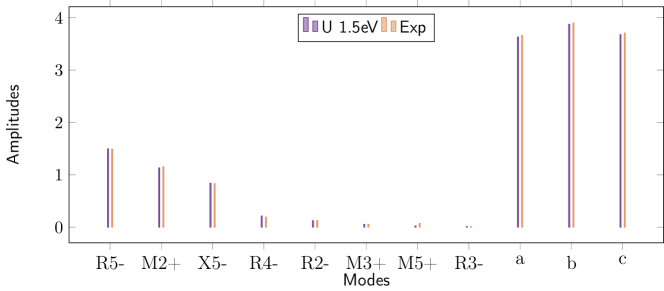
In Figure S2, we report comparison with experiment data Alonso2001 of the absolute amplitudes of the atomic distortions and lattice parameters in the E’-type AFM phase of YNiO3 as computed in DFT with U = 1.5 eV. It confirms that the atomic structure of YNiO3 is very accurately described in DFT using PBESol and a U parameter of 1.5 eV.
IV.2 B. Magnetic properties

In order to determine the magnetic ground state of the phase of YNiO3, we performed calculations for various magnetic orders associated to supercells of up to 80 atoms. While U values larger than 2 systematically favour a FM spin order, U = 1.5 eV properly stabilizes the E’-type spin ordering illustrated in Figure S3 as the ground state. It corresponds to an “up-up-down-down” spin arrangement related to a Bragg vector in pseudocubic notations.
In our calculations, we get a magnetic moment on the Ni atoms associated to the large oxygen octahedra and on the Ni atoms associated to the small octahedra. This is similar with what has been reported in Ref. Prosandeev2012 ; Varignon2016 and in line with the picture Johnston2014 . It is also compatible with experimental data as discussed in Ref. Alonso2009 .
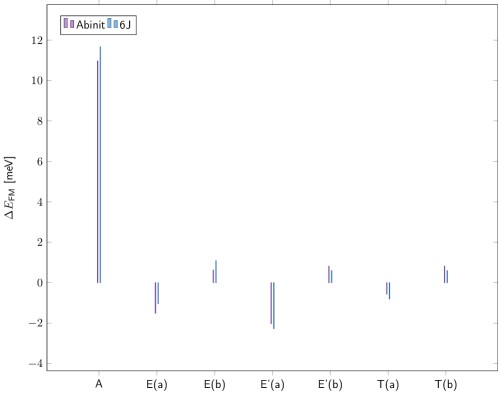
Beyond the fact that DFT calculations with U = 1.5 eV provides the right magnetic ground state, it is interesting to check if it properly accounts for the strength of the magnetic interactions. To that end, we built a simple spin model including interactions up to fourth neighbours (6 independent parameters) and fitted the parameters on our first-principles data Mercy2017 . As illustrated in Figure S4 for YNiO3 this spin model properly reproduces the energetics of the first-principles calculations.
Monte-Carlo simulations (using large boxes up to 1728 Ni atoms) from this spin-model Mercy2017 (i) confirmed the E’-type ground state and (ii) provided a Neel temperature 154 K, very similar to the mean-field estimate of 166 K and in close agreement with the experimental value of 150 K for YNiO3 Alonso1999 .
This demonstrates that our DFT calculations with U = 1.5 eV reproduces not only the correct E’-type magnetic ground state of nickelates but also properly describes the strength and anisotropy of their magnetic interactions.
IV.3 C. Electronic properties
Our DFT calculations with U = 1.5 eV properly accounts for the insulating character of the E’-type AFM ground state of YNiO3. For the electronic bandgap, we get a value of 0.46 eV in reasonable agreement with the experimental estimate of 0.305 eV Arima1993 .
The electronic properties are further discussed in the manuscript. As it appears clearer there, the structural and electronic properties are intimately linked together in nickelates. Hence, the fact that our simulations describe accurately the structural properties of these compounds strongly suggests that they can also be trusted to investigate their electronic properties.
S2. Phonon dispersion curves
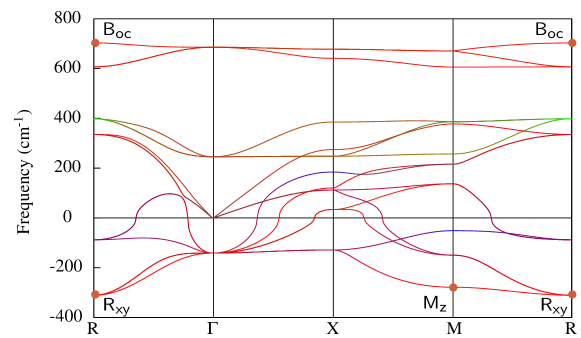
In Figure S5, we report the full phonon dispersion curves of the phase of YNiO3, as calculated for a FM spin ordering at the volume of the AFM-E’ phase (Å). Similar curves have been obtained at the relaxed volume (Å). Interpolation of these phonon dispersion curves relies on the calculation of the interatomic force constants within a supercell. Although this might not be totally sufficient to get a fully converged interpolation, it provides already a good estimate of the shape of the dispersion curves. It is worth to notice that the frequencies at the high-symmetry points, which are the only ones discussed below and in the manuscript, are not interpolated but calculated explicitly within our approach.
On the one hand, the phonon dispersion curves highlight strong instabilities at the R and M points of the BZ, associated to the and distortions. On the other hand, and quite amazingly, the breathing distortion, located at the R point, which finally produces the MIT, is associated to the hardest mode in the cubic phase. Clearly, such hard mode cannot spontaneously condense within the cubic structure.
We further notice the presence of two (triply-degenerated) unstable modes at with very close frequencies. The softest one is associated to a polar-type motion involving and O atoms; this kind of instability is expected for perovskites with small tolerance factors as YNiO3. The second one is the silent butterfly motion of the O atoms.
S3. Landau Model
Based on our DFT results, we have built a simple Landau-type model. In order to highlight the triggered mechanism, we restricted ourselves to the simplest possible model including only , and degrees of freedom and lowest-order terms.
IV.4 Expression
Within our Landau-type model, the free energy in terms of the amplitudes , and (of , and respectively) reads:
| (3) | |||||
The parameters and are assumed to be temperature dependent as
| (4) |
while all the other parameters are supposed to be constant.
Other modes allowed by symmetry (see Table S1) in the and phases have not be explicitly included within the model. Some of them, like (and to a lesser extent and ), take however a significant amplitude and are crucial to stabilize the phase. They are implicitly included through a renormalization of the parameter as it will appear more clearly in the next subsection.
The strain degrees of freedom have not been explicitly included within the model to highlight the key role of phonon-phonon couplings, which appear sufficient to reproduce experimental data on bulk compounds. However, this model could be naturally extended to strain degrees of freedom and their couplings with lattice modes. This might be useful to quantify for instance the role of epitaxial strain in thin films but is beyond the scope of this work.
The expansion has been limited to 4th order for all three order parameters including . This is justified by the fact that, from the fit of the parameters, the triggered transition appears to be second order . We notice however that explicit treatment of the strain (neglected here) could affect the order of the phase transition as further discussed below.
IV.5 Fit from DFT
Parameters of our Landau-type model have been fitted on first-principles results. At first, we focused on YNiO3.
We considered in our calculations a fixed cubic cell at a volume similar to that of the AFM-E’ ground-state (Å), which corresponds to imposing a negative strain of . At this volume, relaxing within the symmetry while keeping the unit cell fixed yields amplitudes of distortion comparable to the ground-state. We notice that, as illustrated in Fig. 9, similar calculations performed at the relaxed lattice constant (Å) yield very similar results. Even calculations performed while relaxing the lattice parameters at fixed mode amplitudes (in reduced coordinates) do not provide any significant change.
The calculations have been performed with a FM spin order which does not break any symmetry. We checked explicitly that the key physical features and conclusions (cooperative bi-quadratic coupling between rotations and breathing and triggered mechanism) remain similar for different AFM spin orders. The results remain even very similar in a non-magnetic (NM) calculation (with or without U correction) although, in that case, the amplitude of rotations required to destabilise is slightly larger (%); this last result illustrates that electronic Hund’s rule energy, although playing a role, is not driving alone the appearance of as sometimes suggested Mazin2007 .
The parameters of the Landau model at 0 K have then been extracted from DFT data as follows.
-
•
), ), and were fitted on the individual double wells associated to and (Figure 1).
-
•
was fitted to reproduce the energy of a relaxed -like phase (full atomic relaxation while keeping the cubic cell fixed). From this, we renormalize the natural competition between and by including implicitly the stabilising effect of , and modes. We notice that in all compounds, and compete with each other and should yield . However, because of the renormalization due to the implicit presence of the other modes, becomes negative for large cations (i.e. helps stabilizing the phase consistently with the discussion in Ref. Benedek2013 .
-
•
was fitted on the single well associated to (Figure 1).
-
•
and were fitted from the change of curvature of the well of when freezing 100% of and respectively (Figure 2).
-
•
was fitted to reproduce the right amplitude of in the ground state of the model and it was checked that the result still properly describes the single well associated to .
Within the model, the amplitude for the atomic distortion are renormalised to the one obtained from DFT calculation for the YNiO3 ground state. This means 1 for rotation, tilts and breathing mode correspond to the amplitude of these modes in a cubic box with lattice parameters coresponding to 3.728 Å.
We applied the same procedure to GdNiO3 and SmNiO3. All the computed parameters are summarized in Table 2.
| parameter | Y | Gd | Sm |
|---|---|---|---|
| 0.920 | 0.938 | 0.947 | |
| 58.1 | 52.6 | 50.6 | |
| 10.0 | 16.0 | 31.0 | |
| -578.3 | -385.5 | -277.3 | |
| 3918 | 2571 | 1897 | |
| 213.9 | 209.4 | 201.0 | |
| -1288.1 | -1081.2 | -920.9 | |
| 3918 | 3195 | 2833 | |
| 648.8 | 754.9 | 750.4 | |
| 31.8 | -57.7 | -99.4 | |
| -26.0 | -29.0 | -29.4 | |
| -35.8 | -42.2 | -42.4 |
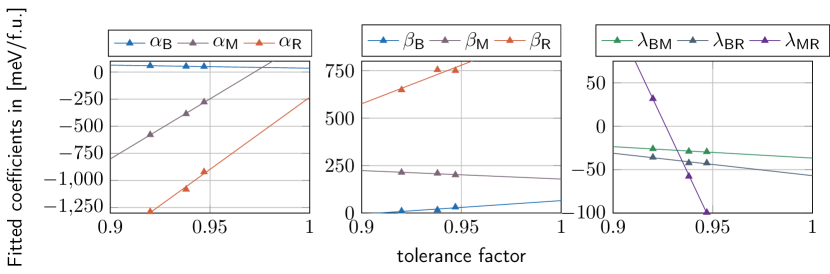
As illustrated in Figure S6, all the parameters have an almost linear dependence in terms of the tolerance factor . So, in our model, we assumed such a linear dependence to determine the value of the parameters at arbitrary .
Finally, knowing at 0 K (from the DFT calculations), their temperature dependence was estimated as follows. Focusing first on YNiO3 we adjusted so that within our model, appears at the experimental value of 585K Catalan2008 and we deduced : and . Then, assuming constant within the whole family the evolution of and with the tolerance factor were obtained as: .
From this, we get the following final Landau-type expression for the free energy, allowing us to determine the values of , and for any value of the temperature and tolerance factor :
| (5) | |||
IV.6 Analytical solution
From this model, can be determined analytically.
We start from the expression:
| (6) | |||||
At the energy minimum, we should have :
| (7) |
The solutions for that, other than and , are :
| (8) | |||||
Introducing this in Eq. (4) we get :
| (9) |
where
| (10) | |||||
| (11) |
The MIT is linked to the appearance of the . This will appear at a temperature at which . This critical temperature is given by :
| (13) | |||||
Furthermore, supposing a linear dependence for all the coefficients with respect to the tolerance factor, we get a generic expression :
| (14) |
where is the tolerance factor and and are a combination of model parameters.
Using the coefficients determined from DFT calculations in the previous Section, we can predict the evolution of as a function of the tolerance factor as illusrated in Figure 2b, blue line.
Independently, we can also fit the experimental data point using Eq. 13. Making such a fit, while excluding Nd and Pr compounds, we get the dashed blue line in Figure 2b.
IV.7 Order of the transition
Experimentally, there is still some debate about the order of the MIT. For large cations (), the MIT is rather abrupt and hysteretic and unanimously considered as being first order Catalan2008 . The magnetic transition that takes place at the same temperature is also first order Vobornik1999 . For small cations (), the MIT is less hysteretic and sometimes considered as evolving to second-order. Some studies seem however to show that it stays first-order Perez1999 ; Nikulina2004 , while the less hysteretic behavior could be related to the fact that kinetics are better at higher temperatures Catalan2008 . For these compounds the magnetic transition is second-order.
As previously mentioned, the MIT is predicted to be second-order within our very simple model. As highlighted in Table S2, computed is positive for all compounds. From Eq. LABEL:betaprime, the oxygen rotations renormalize the fourth-order term coefficient and a negative value of would give rise to a first-order transition (it would then further require including 6th order terms in ). Although this renormalization is negative, stays nevertheless positive in all cases ( 9, 14 and 29 respectively for YNiO3, GdNiO3 and SmNiO3 respectively) corresponding therefore to a second-order transition.
Yet, we have to stress that our approach does not allow us to address the order of the transition conclusively. First, our model is built at fixed cubic cell and does not include strain relaxation. Explicit treatment of the latter will further renormalize the -order term and might potentially make it negative, so eventually changing the order of the transition. Second, at a more fundamental level, even if our DFT+U results suggest that undergoes a second-order transition, that does not rule out the possibility that thermal effects effectively render a first-order transformation driven by temperature. The ferroelectric phase transitions of BaTiO3, a well studied case, are a concrete example of this Iniguez2001 , and also illustrate the critical role of strains to enhance the discontinuous character of the transformation Zhong1995 . Hence, discussing the character of the transition from first-principles would require explicitly statistical simulations that fall beyond of the scope of this work. The Landau model introduced here was kept simple on purpose in order to highlight the key role of the triggered mechanism and it show that, based on our first-principles results and a minimal experimental input, the main features of the phase diagram can be readily reproduced. Further, the main trends (regarding ionic size, amplitude of the different rotations, …) are properly captured by this simple model, which moreover provides us with insights about how to tune the behaviour of these materials. In this sense, we consider that the proposed Landau model is valid and useful although, admittedly, it is not suitable for a definite discussion of the order of the transition.
For large cations (Nd and Pr), our model predicts that the MIT can no more be fully triggered by the oxygen rotations (which are reduced); for those compounds, it is complementarily promoted by the appearance of the AFM-E’ magnetic order. In such case, the MIT takes place at ; it is expected to be more abrupt and to be first order. Such coupling between the structural and magnetic transition for large cations is in line with the conclusions of Vobornik et al. in Ref. Vobornik1999 : they suggest indeed that, contrary to other cases, there is a possible interplay between electronic and magnetic degrees of freedom when and that any further model of the TMI should address that fact. Our manuscript explicitly addresses that point and we believe that it convincingly answers their questioning.
S4. Electronic band structures
In Figure S6, we report the electronic dispersion curves of YNiO3 with a FM spin order, along a more exhaustive path of the Brillouin zone of the or 20-atom cell. The majority spins are in colors while the minority spins are in light grey. The latter have been omitted for clarity in the main manuscript. We notice that the cubic phase is essentially non magnetic (up and down spin bands nearly degenerate) and magnetism starts to develop with the rotations.
In Figure S7, we report similarly the electronic dispersion curves of YNiO3 but with an AFM-A spin order. This figure is very similar to the previous one, demonstrating that our results are not dependent of the specific choice of spin order.