A census of radio-selected AGN on the COSMOS field and of their FIR properties
Abstract
We use the new catalogue by Laigle et al. (2016) to provide a full census of VLA-COSMOS radio sources. We identify 90% of such sources and sub-divide them into AGN and star-forming galaxies on the basis of their radio luminosity. The AGN sample is complete with respect to radio selection at all . Out of 704 AGN, 272 have a counterpart in the Herschel maps. By exploiting the better statistics of the new sample, we confirm the results of Magliocchetti et al. (2014): the probability for a radio-selected AGN to be detected at FIR wavelengths is both a function of radio luminosity and redshift, whereby powerful sources are more likely FIR emitters at earlier epochs. Such an emission is due to star-forming processes within the host galaxy. FIR emitters and non-FIR emitters only differentiate in the universe. At higher redshifts they are indistinguishable from each other, as there is no difference between FIR-emitting AGN and star-forming galaxies. Lastly, we focus on radio AGN which show AGN emission at other wavelengths. We find that MIR emission is mainly associated with ongoing star-formation and with sources which are smaller, younger and more radio luminous than the average parent population. X-ray emitters instead preferentially appear in more massive and older galaxies. We can therefore envisage an evolutionary track whereby the first phase of a radio-active AGN and of its host galaxy is associated with MIR emission, while at later stages the source becomes only active at radio wavelengths and possibly also in the X-ray.
keywords:
galaxies: evolution - infrared: galaxies - galaxies: starburst - galaxies: active - radio continuum: galaxies - methods: observational1 Introduction
While in the recent years there has been a growing interest of the scientific community in extra-galactic radio objects, and very ambitious programs like the planned Square Kilometer Array (SKA, Carilli et al. 2004) or its precursors ASKAP (Australian SKA pathfinder, Johnston S. et al. 2007) and MeerKAT (Jonas J.L. 2009) will soon see their first light, investigating the very nature of these sources is not an easy task. They are indeed a mixed bag of astrophysical objects: from the powerful radio-loud QSOs and FRII (Fanaroff & Riley 1974) galaxies to the weaker FRI, low-excitation galaxies and star-forming galaxies, whose contribution to the total radio counts becomes predominant at the sub-mJy level (see e.g. Magliocchetti et al. 2000; Prandoni et al. 2001; Bonzini et al. 2013, Bonzini et al. 2015; Padovani et al. 2015). Discerning amongst them is only possibile via photometric and, whenever possibile, spectroscopic follow-ups and to this aim a series of deep-field radio surveys have been performed on very well studied cosmological fields such as COSMOS (Schinnerer et al. 2004; 2007; 2010), GOODS-North (Morrison et al. 2010), VIDEO-XMM3 (McAlpine et al. 2013), VVDS (Bondi et al. 2003), Subaru/XMM (Simpson et al. 2013) and the Extended Chandra Deep Field (Mao et al. 2011 and Bonzini et al. 2012).
Following the launch of the Spitzer and Herschel satellites, radio sources have also been investigated at Mid-Infrared (MIR) (e.g. Appleton et al. 2004; Boyle et al. 2007; Magliocchetti, Andreani & Zwaan 2008; Garn et al. 2009; Leipski et al. 2009; De Breuck et al. 2010; Norris et al. 2011 amongst the many) and Far-Infrared (FIR) wavelengths (e.g. Seymour et al. 2011; Del Moro et al. 2013; Magliocchetti et al. 2014, 2016). These studies allowed to probe the sub-population of star-forming galaxies up to , and also provided invaluable information on the central engine responsible for radio (and MIR) AGN emission.
In more detail, Magliocchetti et al. (2014) for the first time investigated the FIR properties of AGN selected at 1.4 GHz of all radio luminosities (except for the ”monsters” which do not appear in small and deep fields) and at all redshifts . This was done by using the very deep catalogue obtained at 1.4 GHz on the COSMOS field by Schinnerer et al. (2004; 2007; 2010) and Bondi et al. (2008); AGN were selected solely on the basis of their radio-luminosity and FIR information was provided by the PEP survey (Lutz et al. 2011, 2014). Magliocchetti et al. (2016) then extended this previous analysis to deeper FIR fields such as GOODS-North, GOODS-South and the Lockman Hole.
The present work is the third one of the above series and re-analyses the radio and FIR properties of radio-selected sources in the COSMOS field by making use of the very recently published catalogue of redshifts by Laigle et al. (2016). In fact, the COSMOS field (Scoville et al. 2007) covers a large ( deg2) area and it is observed with very deep (AB) multi-wavelength data, including imaging in 18 intermediate band filters from Subaru (Taniguchi et al. 2007), which allow to pinpoint emission/absorption lines in the SEDs, and NIR/MIR data from UltraVISTA (McCracken et al. 2012) and IRAC (SPLASH Survey; Capak et al. in prep). The photometry is homogenized and blending is also taken into account, making the quality of the data, the photometric redshifts and the stellar masses in the Laigle et al. (2016) catalogue among the best available. The availability of reliable photometric redshifts is not limited to normal galaxies but it also assured for the X-ray sources detected by Chandra in a deep and homogeneous manner (Civano et al. 2016, Marchesi et al. 2016).
Indeed, while the work by Magliocchetti et al. (2014) was based on the catalogue by Ilbert et al. (2013), which only provided redshifts for about 65% of the radio sources from the VLA-COSMOS survey, the Laigle et al. (2016) dataset provides information for more than 90% of such objects. This is due to the fact that, unlike the Capak et al. (2007) and Ilbert et al. (2010) works which relied on i-band selection, the Laigle et al. (2016) catalogue is based on a near-infrared selection which allows to sample much redder objects and therefore probe higher redshift sources. This extremely high completeness then allows to reinvestigate the radio and FIR properties of COSMOS radio-selected AGN and draw conclusions at much higher confidence levels.
Furthermore, galaxies in the Laigle et al. (2016) catalogue are also provided with a flag which indicates whether the source shows signature for AGN emission in a number of wavebands. This information will then be used throughout the present work to assess whether there are systematic differences amongst radio-active AGN which also emit in the MIR or X-ray bands and to envisage an evolutionary connection between these different classes of sources.
Throughout the work we will assume a CDM cosmology with (), , and . Masses for the sources under examination come from the Laigle et al. (2016) catalogue and are calculated using the Bruzual & Charlot (2003) templates and adopting a Salpeter (1955) Initial Mass Function (IMF).
2 The Radio-Infrared Master Catalogue
The main properties of the radio and FIR catalogues are extensively described in Magliocchetti et al. (2014). Here we report a brief summary. The VLA-COSMOS Large Project observed the 2 deg2 of the COSMOS field at 1.4 GHz (Schinnerer et al. 2004; Schinnerer et al. 2007). The catalogue adopted in our work is that presented in Bondi et al. (2008), which comprises 2382 sources selected above a 1.4 GHz integrated flux of 60 Jy.
The COSMOS region has been observed down to mJy at 100m and mJy at 160m by the PACS (Poglitsch et al. 2010) instrument onboard the Herschel Space Observatory (Pilbratt et al. 2010) as a part of the PACS Evolutionary Probe (PEP, D. Lutz et al. 2011) Survey. Infrared counterparts to FJy VLA-COSMOS sources have been found by a simple matching technique between the radio and the COSMOS-PEP catalogues. By adopting the same criteria of Magliocchetti et al. (2014), we chose as maximum separation values 4′′ at 100m and 5′′ at 160m. We find that 1063 VLA-COSMOS sources (corresponding to 44% of the parent sample) have a counterpart at 100m and 1100 (corresponding to 46%) have a counterpart at 160m. The total number of FJy VLA-COSMOS sources with an infrared counterpart either at 100m or at 160m is 1219, corresponding to 51% of the original sample.
Finally, in order to provide the overwhelming majority of radio sources with a redshift determination, in this work we cross correlated the above sample with the Laigle et al. (2016) catalogue which provides reliable photometric redshifts ( for galaxies brighter than ) for COSMOS galaxies, with only a handful of outliers. When possible, we used spectroscopic redshifts available within the COSMOS collaboration.
Given the high positional accuracy of both the radio and the optical-near infrared surveys, we fix the matching radius to 1 arcsec. This procedure provides redshift estimates for 2123 radio sources (out of which 1199 are spectroscopic), corresponding to per cent of the parent sample. This has to be compared with our previous work where only per cent of the VLA-COSMOS objects were endowed with a redshift determination. Of the 2123 radio sources with redshift of the present work, 1173 also have a counterpart on the Herschel maps. This corresponds to 96% of FIR-detected galaxies.
3 AGN selection via radio luminosity
A tricky point in the process of identifying extragalactic sources observed in monochromatic radio surveys is that of distinguishing between radio emission of AGN origin and that instead due to star forming processes. The approach we adopt here is that introduced by Magliocchetti et al. (2014) and already used in Magliocchetti et al. (2016). This is based on the results of McAlpine, Jarvis & Bonfield (2013) who provide luminosity functions at 1.4 GHz for the two classes of AGN and star-forming galaxies. Their results show that the radio luminosity Pcross beyond which AGN-powered galaxies become the dominant radio population scales with redshift roughly as
| (1) |
at least up to . [W Hz-1 sr-1] is the value which is found in the local universe and which roughly coincides with the break in the radio luminosity function of star-forming galaxies (cfr Magliocchetti et al. 2002; Mauch & Sadler 2007). Beyond this value, their luminosity function steeply declines, and the contribution of star-forming galaxies to the total radio population is drastically reduced to a negligible percentage (Magliocchetti et al. 2002; Mauch & Sadler 2007).
We then distinguished between AGN-powered galaxies and star-forming galaxies by means of equation (1) for and by fixing [W Hz-1 sr-1] at higher redshifts. This procedure identifies 704 AGN (corresponding to 33% of the total radio population) and 1419 star-forming galaxies. With respect to our earlier work, these numbers imply an increase of a third of sources in both the AGN and the SF samples and allow to draw conclusions on the properties of radio-selected sources with and without a FIR counterpart on much more solid grounds. Also, note that, due to the adopted selection criteria and thanks to the depth of the VLA-COSMOS survey, the AGN samples is complete with respect to radio selection at all redshifts , i.e. the considered sample includes all radio-emitting AGN selected at 1.4 GHz in the COSMOS field and endowed with a redshift determination . 272 sources classified as AGN and 901 sources classified as star-forming galaxies also show up in the Herschel maps.
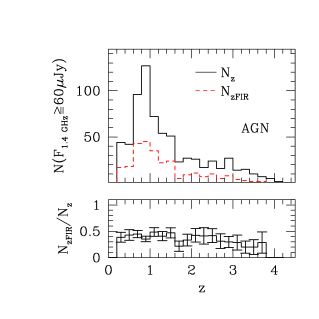
The redshift distribution of radio-selected AGN is presented in Figure 1. The solid histogram shows the distribution of all AGN, independent of their FIR emission, while the dashed (red) histogram represents that of those AGN which also appear in the Herschel maps. The bottom panel highlights the ratio between these two quantities. Errorbars correspond to 1 Poissonian estimates. As already seen in Magliocchetti et al. (2014), also in the present case we have that the redshift distribution of radio-selected AGN presents a marked peak at a redshift . However, the better statistics of the present data allow to identify a prominent tail which extends up to and which in Magliocchetti et al. (2014) only showed up as a secondary peak centred around . There is no functional difference between the distribution of the parent AGN population and that which corresponds to AGN with a FIR counterpart. One is the scaled version of the other, and the ratio between these two quantities is roughly constant and equal to the value of throughout the whole redshift range probed by our data.
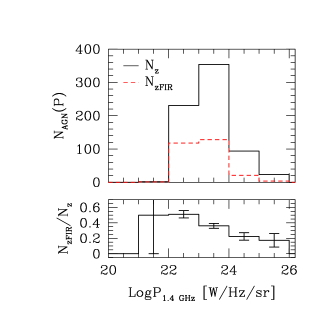
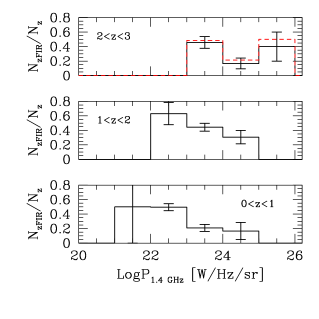
Some more information on the sources under exam can be provided by investigations of the distribution of their radio luminosities, both in the presence and in absence of FIR emission. This is shown in Figure 2, whereby the left-hand plot shows the distribution of sources at all redshifts, while the one on the right-hand side that of sources divided into redshift intervals. The left-hand plot of Figure 2 clearly shows that the global distribution of radio-selected AGN (solid, black line) has a marked peak in the radio luminosity interval [W Hz-1 sr-1]. Beyond that value, there is a sharp drop in the number of AGN of higher luminosities. A very similar drop is also observed in the distribution of radio-selected AGN which are also associated with FIR emission (red, dashed line). However, the distribution of these sources at lower radio powers does not feature the same sharp peak in the range [W Hz-1 sr-1]. The net result of these two trends is that the fraction of radio-selected AGN which also emit at FIR wavelengths (shown in the bottom panel of the left-hand plot) is a strong function of radio luminosity. There is a clear trend which indicates that the number of FIR emitters monotonically decreases with increasing radio luminosity. This decrement is rather significant as the fraction of FIR emitters goes from % of the total radio-AGN population at luminosities [W Hz-1 sr-1] down to % for luminosities [W Hz-1 sr-1]. However, interestingly enough, the right-hand plot of Figure 2 clearly shows that this marked decrement is only true in the relatively low () redshift universe, and gradually loses its importance when we move from local to more distant sources. Indeed, at higher redshifts we find that the fraction of FIR emitters is independent of radio luminosity, i.e. that all high-redshift radio-selected AGN have the same chances of being associated with FIR emission, independent of their radio luminosity. This result confirms those of Magliocchetti et al. (2016), while it partially contradicts that of Magliocchetti et al. (2014) who still found a dependence on radio luminosity also at the highest redshifts, as this was masked by relatively large uncertainties. In this respect, it is worth mentioning that the value of found in this work for the fraction of FIR emitters at is determined by the relatively shallow Herschel observations on the COSMOS field. Indeed, in the case of deeper observations like those on the two GOODS fields and on the Lockman Hole, one finds that such a percentage reaches the value of % (Magliocchetti et al. 2016).
Another interesting feature that can be appreciated in the right-hand plot of Figure 2 is that the chances for an AGN of fixed radio luminosity to be a FIR emitter sensibly increase when moving from the lowest to the highest redshifts probed by our analysis. So, for instance, a source with P [W Hz-1 sr-1] will only have
a % probability of being a FIR emitter at , while this percentage rises to % in the redshift range , up to % for and a source with P [W Hz-1 sr-1] will have
a % probability of being a FIR emitter both at (zero objects out of one) and (zero objects out of 11), while the percentage rises to % (four objects out of ten) at .
This trend, already highlighted by the work of Magliocchetti et al. (2014) and confirmed here on the more solid grounds provided by an almost complete optical identification of all radio-selected AGN, implies that the probability for a radio-selected AGN to be active in the FIR is both a function of radio power and redshift, whereby powerful sources are more likely to emit at FIR wavelengths at higher redshifts.
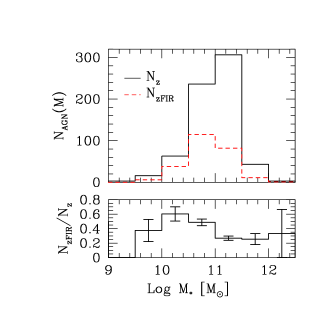
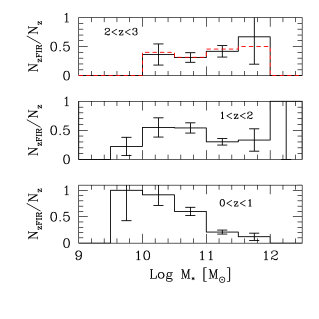
Most of the above radio-selected AGN (696 out of 704) are also endowed with a mass estimate from the Laigle et al. (2016) catalogue111Note that the masses computed in Laigle et al. (2016) do not include an AGN component in the SED-fitting procedure and are calculated at the photometric redshift values. Both factors could in principle affect their estimates. Further work needs to be developed in order to address this point more properly.. Figure 3 presents the distribution of such sources as a function of stellar mass. As it was in the previous case, the left-hand plot presents the distribution of masses at all redshifts, while that on the right-hand side illustrates the trends in different redshift intervals. Radio-selected AGN are on average associated with galaxies with a large stellar mass content. From the left-hand plot of Figure 3 it is clear that more than 90% of the sources has stellar masses M M⊙ and more than 50% of them is further associated with galaxies of masses M M⊙. Those radio-selected AGN which are also FIR emitters instead present on average slightly lower values for the masses: their distribution (highlighted by the red, dashed line in Figure 3) peaks between M⊙ and M⊙, rather than in the range M⊙ observed in the distribution of the whole radio AGN population. The net effect of these two different behaviours is that the fraction of radio-selected AGN associated with FIR emission (represented in the bottom panel of the plot on the left-hand side of Figure 3) remains roughly constant and equal to the value of % in the relatively low-mass, M M⊙, regime, while it drastically drops to the value of about 20-30% for masses higher than the previous value. This implies that FIR emission in radio-selected AGN is preferentially associated with low-mass objects. However, when do we witness the onset of this trend? The answer to this question can be found in the right-hand plot of Figure 3 which clearly shows that FIR emitters almost entirely appear in relatively low-mass sources only in the local, universe. This phenomenon then loses much of its importance for redshifts and entirely disappears for , whereby one finds that all radio-selected AGN have the same chances of also being FIR emitters independent of the stellar mass associated with their host galaxy.
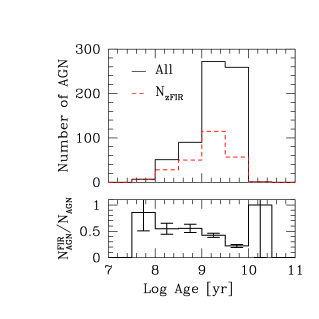
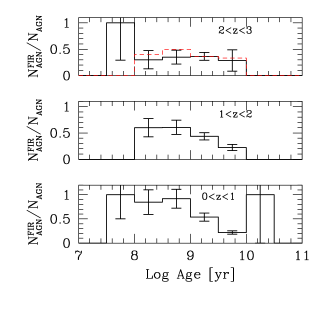
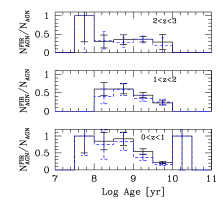
A trend which is very similar to what observed in the distributions of both radio luminosities and stellar masses of radio-selected AGN is also found in the distribution of the ages of their hosts, which again come from the work of Laigle et al. (2016). Indeed, in the left-hand panel of Figure 4 it is possible to appreciate the systematic younger ages of FIR emitters (again represented with the red, dashed line) with respect to the total AGN population: the relative fraction of FIR emitters decreases for ages beyond yr, and very few of such sources are found for yr. But again, as shown in the right-hand panel of Figure 4, this trend is mostly true in the local, , universe, while it starts losing its importance at higher redshifts and by there are no appreciable differences between the ages of radio-AGN which are also FIR emitters and those of the whole radio-AGN population.
As a caveat, we stress that the results presented in the top right-hand panels of Figures 2, 3 and 4 were obtained for sources up to . However, we note that the McAlpine et al. (2013) data on which our selection method is based only extends to . To make sure our results are not biased by an incorrect extrapolation to higher redshifts, we have then re-calculated all the previous quantities for sources in the redshift range . These are represented in the top right-hand panels of Figures 2, 3 and 4 by the dashed histograms. As it is possible to appreciate, the distributions in the two and intervals are virtually identical. This, together with the fact that very little evolution is observed in the AGN luminosity function of McAlpine et al. (2013) in the whole redshift range, gives us confidence that the extrapolation performed to select radio-emitting AGN for is a sensible one.
Also, we made sure that contamination from star-forming galaxies to the AGN sample in the proximity of did not affect our results and conclusions. To this aim, we have recalculated all the quantities presented in Figures 2, 3 and 4 for a smaller AGN subset obtained by considering only those 444 sources with . The choice for such a new luminosity threshold ensures that the possible fraction of contaminants is now drastically reduced to a very negligible quantity at all redshifts (cfr the Appendix). While, by construction, this selection reduces the number of low-luminosity AGN and therefore of high redshift sources, no other difference is observed in any of the distributions presented in this Section. Therefore, we can safely conclude that possible contamination of the AGN sample at the lowest radio luminosities due to the presence of unremoved star-forming galaxies is not expected to affect any of our conclusions which can be summarised as: FIR emitters differentiate from the whole population of radio-selected AGN only in the local, , universe. At higher redshifts there is no difference between the properties of FIR-active and FIR-inactive sources and these two classes are indistinguishable one from the other.
4 FIR properties
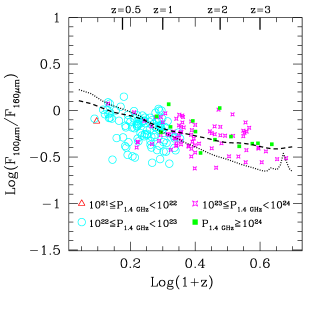
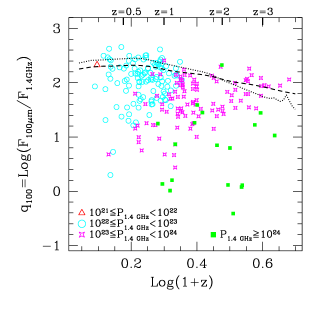
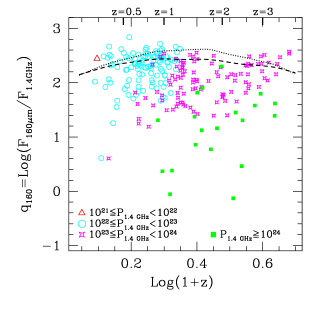
Magliocchetti et al. (2014) and (2016) have shown that FIR emission from the hosts of radio-active AGN is entirely to be attributed to star-forming processes within the galaxy itself. This is also true in the present case. In fact, as Figure 5 clearly illustrates, except for a very few outliers, the FIR colours of radio-selected AGN of all luminosities and at all redshifts all lie on the curves identified by the spectral energy distributions (SED) of two standard star-forming galaxies: M82 (dashed line) and Arp220 (dotted line). Despite this finding, in the majority of cases the flux ratios and of these sources indicate an excess of radio activity with respect to that produced by ’pure’ star-forming processes, most likely to be attributed to the presence of a central, radio-emitting, AGN. This is seen in both panels of Figure 6 which illustrate the distribution of the quantities q100 (left-hand plot) and q160 (right-hand plot) as a function of redshift for radio-selected AGN of different radio luminosities, once again compared with the SEDs obtained for M82 and Arp220.
Some interesting insights on the mechanisms which regulate star-formation in radio-selected AGN can be obtained from a comparison of the FIR properties of this class of objects with those exhibited by the population of star-forming galaxies, where once again this latter class has been selected from the Bondi et al. (2008) catalogue by following the method highlighted in §3. To this aim, we have calculated the bolometric luminosities LFIR of both populations by integrating over the whole 8m-1000m range chosen templates of star-forming galaxies which best fitted the FIR data and subsequently extrapolated their star formation rates (SFR) according to the standard relation (Kennicut 1998, which holds for a Salpeter IMF and for stellar masses in the range M⊙): SFR [M⊙ yr-1]= LFIR/L⊙.
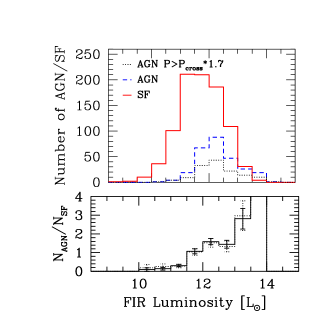
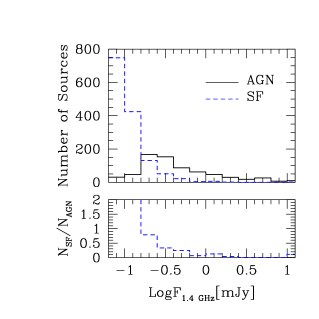
The distribution of LFIR for both classes of sources is presented in Figure 7, whereby star-forming galaxies are represented by the solid red histogram, while the blue dashed one is for AGN. First of all, our data clearly show that radio-active AGN are extremely luminous sources. Their distribution peaks at around 1012.5 L⊙ and presents a tail of sources as bright as L⊙. Also, radio-selected AGN are on average brighter than star-forming galaxies selected from the same radio sample. Indeed, these latter objects present a distribution which peaks at lower, L L⊙, luminosities and there are practically no sources with LFIR beyond L⊙. This is better seen in the bottom panel of Figure 7 which shows the relative weight of the two populations of radio-selected sources as a function of FIR luminosity. The fraction of AGN drastically increases for L L⊙, and they become the dominant population in sources brighter than L⊙. We note that such a finding is robust with respect to possible contaminations of the AGN sample. In fact, if we concentrate on a smaller subset obtained by only considering radio-selected AGN with luminosities brighter than , we obtain the very same trend (cfr dotted histogram in the bottom panel of Figure 7), despite having only used roughly half of the available sources.
The above result implies that the presence of a radio-active AGN within a galaxy not only does not inhibit its star-formation activity but, on the contrary, that such an activity is probably favoured by the very same presence of the central AGN. In other words, what we are witnessing is the likely presence of positive feedback, possibly due to the winds produced by the radio-active AGN which boost star-formation within its host. This issue will be better discussed in §5.
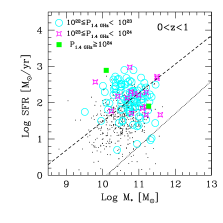
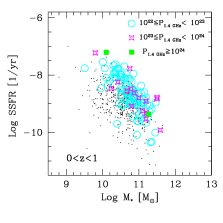
Some more differences between the two populations of radio-selected AGN and star-forming galaxies can be appreciated by investigating the distributions of their SFR and Specific Star Formation Rates (SSFR, defined as SFR over stellar mass) as a function of stellar mass. This is done in Figures 8 and 9, where the three panels within each Figure refer to different redshift ranges. In both Figures, star-forming galaxies of all radio luminosities are represented as black dots, while FIR-emitting AGN are colour coded according to their radio power. In order to guide the eye, the dashed and dotted lines in Figure 8 respectively indicate the relation obtained for main sequence galaxies at by Rodighiero et al. (2011) and that derived for local galaxies by Brinchmann et al. (2004) and Peng et al. (2010). What is clearly visible from both Figures is that, independent of their radio power, FIR-active AGN and star-forming galaxies are indistinguishable from each other at all redshifts beyond . Indeed, they present the very same distribution of stellar masses, star-forming rates and consequently of specific star-forming rates. In the local universe though this similarity breaks down and the two populations exhibit different properties: AGN tend to be more massive and, most of all, more FIR-bright than star-forming galaxies. The star-formation rates of this latter population can be as low as and do not extend further than M⊙/yr. On the other hand, irrespective of their radio luminosity, FIR-emitting AGN are basically only found above SFRs M⊙/yr and can present SFRs as high as M⊙/yr. Indeed, radio-selected star-forming galaxies and AGN at occupy two well defined portions of the SSFR-Mass plane (cfr left-hand panel of Figure 9), with very little superposition between the two populations.
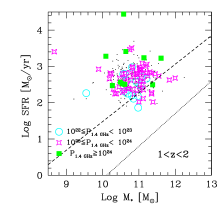
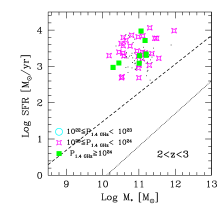
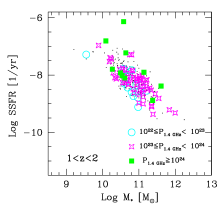
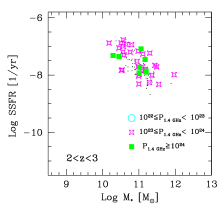
These results are in agreement and extend the findings of the former sections which indicate that for redshifts above there is very little or even no difference between radio-selected AGN and the sub-population of those which are also active at FIR wavelengths. Here we have seen that, at the same high redshifts, there is also no difference between FIR-active, radio-selected AGN and FIR-active, radio-selected star-forming galaxies. In all cases, differences only appear in the local universe: radio-active AGN progressively start becoming FIR-quiet, the more as the higher are their radio luminosities and the mass and age of their hosts, so that FIR activity remains preferentially locked in galaxies which are smaller and younger than the average parent population (cfr §3). At the same time, AGN are found associated with hosts of masses which are also higher than those characterising star-forming galaxies, and the few AGN which still emit at FIR wavelengths in the local universe on average exhibit much higher FIR luminosities (and consequently star-forming rates) than sources undergoing a pure process of stellar formation (cfr left-hand panels of Figures 8 and 9).
5 Radio-selected AGN of different nature
| NTOT | % | NFIR | % | ||
|---|---|---|---|---|---|
| Parent sample | 704 | - | 272 | - | |
| MIR detected | 141 | 20.0% | 83 | 30.5% | |
| X-ray detected | 182 | 25.8% | 81 | 29.8% |
Galaxies in the COSMOS catalogue provided by Laigle et al. (2016) are also flagged according to whether they present signatures of AGN activity in their spectra or SEDs. This is then also true for the radio-selected AGN considered in the present work. We therefore looked for flags in order to determine whether our sources were also identified as AGN in the X-ray or MIR bands. We stress that we had to limit our analysis only to these two sub-populations as, unlike the products of X-ray and MIR selection, optically-identified AGN do not belong to a homogeneous sample, therefore no statistical information could be drawn from these objects.
X-ray information comes from the Chandra COSMOS-Legacy Survey (Civano et al. 2016; Marchesi et al. 2016) which includes X-ray sources down to a flux limit erg s-1 cm-2 in the 0.5-2 KeV band. MIR selection is instead based on the power-law behaviour in the Mid-Infrared/Spitzer-IRAC bands of the SEDs of the considered sources (Donley et al. 2012; Chang et al. 2016 in preparation).
The results of our cross-match are summarised in Table 1. Between 20% and 26% of radio-emitting AGN are also identified as AGN respectively in the MIR or X-ray band. This figure rises up to 30% in the case of MIR AGN which are also detected at FIR wavelengths, while it basically stays constant in the case of X-ray-emitting AGN. These findings imply a mild preference for radio-selected AGN which also emit in the MIR to appear in sources associated with stellar production, while X-ray emission of AGN origin seems to be roughly independent of the FIR activity of its host galaxy.
With the above information at hand, we can investigate the very nature of radio-active AGN and determine whether there is any substantial difference between those that are only active at radio wavelengths and those which also emit in other parts of the spectrum.
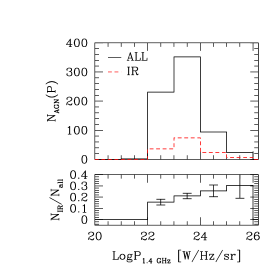
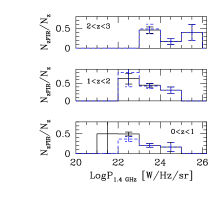
First of all, as shown in Figure 10 and with the possible exception of the highest luminosity regime probed by our analysis, there is a hint that, while the chances for a radio-active AGN to also be an X-ray emitter seem to be independent of its radio luminosity, this is not true for AGN which instead also emit in the MIR band, as the probability for MIR emission seems to be monotonically enhanced in radio-selected AGN of higher and higher radio luminosity.
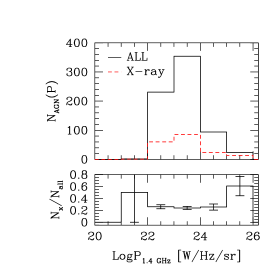
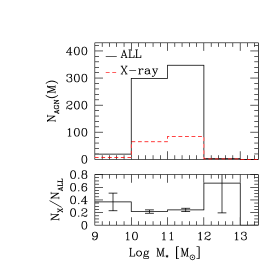
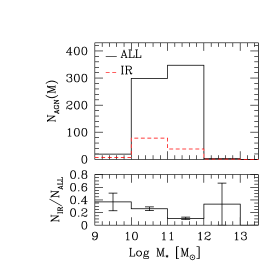
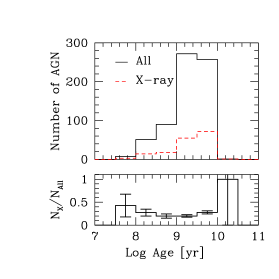
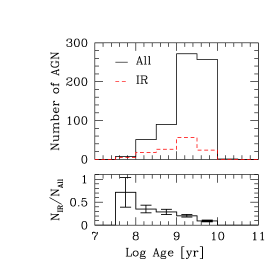
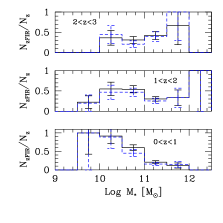
A similar behaviour is also observed in the distribution of the stellar masses of the hosts of radio-selected AGN (cfr Figure 11). In fact, even in this case we observe a substantial consistency of the relative fraction of X-ray emitters with stellar mass, while there is a clear trend for radio-active AGN which also emit in the MIR to preferentially reside in galaxies of smaller mass. At the same time, radio-selected AGN which are also X-ray emitters show the same distribution of ages as the parent radio-AGN population, while those radio-AGN which also emit in the MIR are found to be associated with systematically younger galaxies (cfr Figure 12).
The above comparisons highlight an interesting fact: the sub-population of radio-selected AGN which also emit in the X-ray constitutes a class of sources which is indistinguishable from its parent population in terms of radio luminosity and also of stellar masses and ages of their host galaxies. There is neither a preferential level of radio activity of the central black hole nor a preferential sub-galaxy environment which can determine whether the radio-active AGN will also emit in the X-ray band or not. On the contrary, MIR emission of AGN origin in radio-selected AGN seems to be favoured in sources which are radio-bright and hosted by galaxies which are relatively small and young.
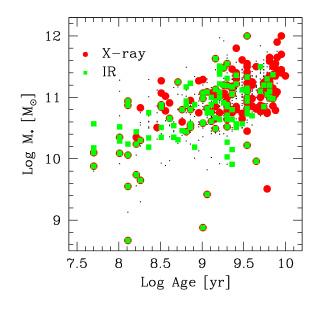
This effect is better visible in Figure 13 which shows the distribution of stellar masses and ages for the hosts of radio-selected AGN which are also active in the MIR (green squares) and X-ray (red circles) bands: AGN which are also active in the X-ray are systematically more massive and older than the other class of sources. We can therefore envisage an evolutionary track for radio-active AGN which associates MIR emission of AGN origin mainly with the early stages of the life-time of the radio source, when the host galaxy was young and fewer stars were already in place. Note that this also agrees with our finding (cfr Table 1) of an enhanced fraction of MIR emitters in radio-selected AGN which cohabit with intense episodes of stellar formation. On the other hand, X-ray emission in radio-selected AGN seems to be mainly associated with a later stage of the evolution of these sources, whereby their hosts have built most of their stellar mass and are on average relatively old. This is also true for radio-selected AGN which only show emission at radio wavelengths, as these two latter classes of sources seem to be indistinguishable from each other.
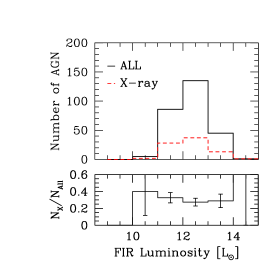
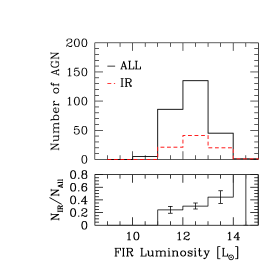
Amongst the pieces of information that can be gathered from Table 1, we also find that the majority of radio-active AGN which also emit in the MIR band is associated with FIR activity. Indeed, 83 out of 141 sources (corresponding to 59% of the subsample) are detected in the COSMOS-Herschel maps, while only 44% of radio-AGN with emission in the X-ray are instead found to be associated with ongoing star-formation within the host galaxy. This finding further confirms the conclusions previously reached: MIR emission is mainly favoured in hosts which are younger than those hosting AGN which are only active in the radio or in the radio+X-ray bands. Indeed, as clearly shown in Figure 14 which reports the distributions of FIR luminosities for these two sub-classes of AGN as compared with the distribution observed for the whole population of radio-selected AGN which show up in the Herschel maps, while the fraction of X-ray AGN stays constant for increasing FIR luminosities, this is found to monotonically increase in the case of AGN which also emit in the MIR band.
6 conclusions
By making use of the recent catalogue of redshifts produced by Laigle et al. (2016) for galaxies belonging to the COSMOS field, we have performed a thorough analysis of the population of 1.4 GHz-selected galaxies on the same COSMOS area and on their Far-Infrared properties. This can be considered as a completion of the work presented in Magliocchetti et al. (2014).
About 90% of the sources from the VLA-COSMOS survey (Bondi et al. 2008) are found to have a counterpart in the Laigle et al. (2016) catalogue. These objects have then been sub-divided into radio-active AGN and radio-emitting star-forming galaxies solely on the basis of their radio luminosity. Out of 2123 radio sources endowed with a redshift estimate, 704 (corresponding to % of the parent population) are AGN and the remaining star-forming galaxies. By then looking for FIR counterparts on the Herschel-PEP (Lutz et al. 2011) maps, we found that 272 of such radio-emitting AGN are also FIR emitters. The redshift distribution of the sub-class of FIR emitters mirrors that of the whole parent population of radio-active AGN and features a prominent peak at and a broad tail which extends up to .
The main conclusions that can be drawn from our analysis can be summarised as follows:
-
1.
FIR emitters amongst radio-active AGN are preferentially found at low, LogP [W Hz-1 sr-1], radio luminosities. However, this is only true for . At higher redshifts, the fraction of FIR emitters of higher radio luminosities increases and by there is no dependence of such fraction on radio luminosity.
-
2.
Similarly, in agreement with the results of Magliocchetti et al. (2014), FIR emitters are found preferentially associated with galaxies of low, M M⊙, stellar masses only in the local universe. At higher redshifts such an effect loses its importance, and by galaxies of all stellar masses have the same chances of hosting a FIR-active, radio-selected AGN.
-
3.
Also the distributions of the ages of the hosts of FIR-active and FIR-quiet AGN are indistinguishable from each other at redshifts . More locally, these two classes of sources evolve differently and by FIR-quiet sources are found preferentially associated with older galaxies.
-
4.
As it was in Magliocchetti et al. (2014) and (2016), we find also in this case that FIR emission is entirely to be attributed to intense episodes of star-formation ongoing within the host galaxy. In this work we have shown that these episodes are so intense that the FIR luminosities of radio-selected AGN are on average higher than those of star-forming galaxies selected from the same radio sample in a consistent way. Furthermore, the distributions of stellar masses and star formation rates for these two classes of sources clearly show that FIR-active radio-selected AGN are on average not only more FIR-bright, but also more massive than star-forming galaxies. However, once again, this is only true in the local, , universe. At higher redshifts the hosts of FIR-bright radio-selected AGN and star-forming galaxies are indistinguishable from each other.
The picture which therefore emerges from our analysis is that of a substantial similitude amongst galaxies which host a radio-active AGN, independent of whether the AGN phenomenon is associated with concomitant star-formation within the host, and also of a similitude between the hosts of radio-selected AGN and those of radio-selected star-forming galaxies. However, this is only true at high, , redshifts. In the more local universe these similitudes break down and likewise star-forming galaxies, also radio-selected AGN associated with FIR emission preferentially inhabit hosts which are smaller and younger than those characterising the whole radio-active AGN parent population. Furthermore, such galaxies are preferentially occupied by AGN of relatively low radio luminosities.
Lastly, we have investigated the properties of radio-selected AGN which also show signatures for AGN emission at other wavelengths. We find that about 26% of the radio-AGN belonging to our sample also emit in the X-ray, while % are also active in the MIR band. Both these percentages rise to % in the case of radio-selected AGN which are also associated with star-formation within the host galaxy.
Our results indicate that while the sub-class of X-ray emitting AGN does not exhibit any sensible difference with respect to the whole radio-selected AGN population, the same is not true for those radio-emitting AGN which also show signatures for AGN activity in the MIR waveband. In fact, we find that this latter class of sources preferentially inhabits galaxies which are on average younger, less massive and more active at FIR wavelengths than the parent radio-AGN population.
We can therefore envisage an evolutionary track for radio-active AGN which associates MIR emission mainly with the early stages of the life-time of the radio source, when the host galaxy was young and not many stars were already in place. On the other hand, X-ray emission in radio-selected AGN seems to be mainly associated with a later stage of the evolution of these sources, whereby their hosts are relatively old and have already built most of their stellar mass. This is also true for radio-selected AGN which only show emission at radio wavelengths, as these two latter classes of sources seem to be indistinguishable from each other.
AGN selected at all wavelengths (radio, X-ray and MIR) should represent objects caught in a short-lived, transition phase, with likely still on-going star formation, and possibly associated with outflowing winds. Interestingly, in three out of four cases in which ionised outflows have been clearly detected through spatially resolved near infrared follow-ups of luminous X-ray or MIR-selected AGN in the COSMOS field (Perna et al. 2015a,b; Brusa et al. 2016), the sources are also revealed as radio-active AGN, and are indeed part of the sample presented in this work. This observational result therefore fits a scenario where radiative-driven winds, produced when the black hole is accreting at its maximum, induce shocks in the host galaxy, accelerating relativistic particles which can then emit in the radio band (e.g. Zubovas & King 2012).
7 Appendix

This Appendix is devoted to the discussion of the level of contamination of the AGN sample considered in the present work and will be divided into to parts:
1) contamination due to the population of star-forming galaxies and 2) contamination due to AGN which owe their radio emission to star-forming activity rather
than to the AGN itself.
1) Contamination from star-forming galaxies.
One possible source of contamination is that due to the un-removed presence of star-forming galaxies of radio luminosities higher than within the AGN sample. In order to assess the importance of such an effect, we have estimated the fraction of star-forming galaxies within our sample of radio-selected sources according to the radio luminosity function of McAlpine et al. (2013). Results at the various redshifts are presented in Figure 15, where the vertical dashed lines represent the values of as defined in §3. As it is possible to notice, in all cases star-forming galaxies tend to disappear very rapidly beyond . In more detail, in the local universe ( and panels) the fraction of star-forming galaxies is % at , while at this is already as low as %. At redshifts instead we find % at and % at , while in the more distant, , universe we have that the fraction of contaminants is about 10% at , and between 2% and 4% at .
The above results clearly show that star-forming galaxies constitute a negligible fraction of the sample of radio-selected AGN already at radio luminosities which are twice as bright as the chosen threshold. In order to assess the robustness of the results presented throughout this paper, we have then performed once again our analysis by only including sources with (444 sources instead of 704, cfr §3). As an example, the results for what concerns the distribution of AGN which are also active in the FIR bands as a function of radio luminosity (left-hand panel), stellar mass of the host (middle panel) and age of the host (right-hand panel) are presented in Figure 16, whereby the solid histograms reproduce the results already presented in §3 (Figures 2, 3 and 4), while the dashed ones what is obtained if we only concentrate on sources brighter than twice the luminosity threshold . As it is clear from the Figure, there is no appreciable difference between the distributions of these two samples. In other words, the eventual presence of un-removed star-forming galaxies in the proximity of does not affect these or any other behavior or conclusion of the present work and also of the previous ones belonging to the same series (Magliocchetti et al. 2014; Magliocchetti et al. 2016).
2) Contamination from radio-quiet AGN.
Another source of concern is represented by the possibility of contamination of our sample due to radio-quiet AGN which emit in the radio waveband only thanks to star-forming activity within the host galaxy. This issue was already discussed in Magliocchetti et al. (2014) who concluded that chances for such a contamination were extremely low. To further extend this point, we have computed the radio flux distribution for the two populations of radio-emitting AGN and star-forming galaxies as obtained by applying the method described in §3. This is shown in Figure 17, which clearly indicates that radio-selected AGN start appearing in the COSMOS sample at fluxes mJy and become the dominant population above mJy.
This result is in perfect agreement not only with all those found in the literature, but also with the recent ones presented by Padovani et al. (2015), which are based on the selection method of Bonzini et al. (2015) and with those presented in Smolcic et al. (2017). Indeed, in agreement with our findings,
Figure 1 of Padovani et al. (2015, but also cfr Figures 12 and 13 of Smolcic et al. 2017) clearly shows that radio-emitting AGN (or what Padovani et al. 2015 call ”radio-loud AGN” and Smolcic et al. 2017 call ”radio-excess” sources; names vary but the concept is the same: radio-detected AGN which owe their emission to accretion processes rather than to star-formation within the host galaxy) beyond mJy are between 10 and 20 times more numerous than the other classes of sources. Figure 1 of Padovani et al. (2015) also shows (in agreement with e.g. the results of White et al. 2015)
that beyond mJy the contribution to the total number counts of the population of radio-quiet AGN is also negligible.
This means that the chances that our AGN sample is contaminated by AGN which owe their emission to star-forming processes rather than accretion are negligible.
In this respect, we would also like to point out the very recent results presented in Magliocchetti
et al. (2017), which show that the clustering properties of radio-selected AGN within
the COSMOS area (i.e. basically the same sample presented in this paper) are in full
agreement with all those found in the literature (e.g. Magliocchetti et al. 2004; Brand et al. 2005; Wake et al. 2008; Fine et al. 2011; Linsday et al. 2014; Lindsay et al. 2014b; Retana-Montenegro & Roettgering 2017).
This would not be possible if some different population had sensibly contaminated the sample,
since the clustering lengths of radio-quiet AGN (e.g. Porciani, Magliocchetti & Norberg 2004; Retana-Montenegro & Roettgering 2017) and star-forming galaxies (e.g. Norberg et al. 2002; Magliocchetti & Porciani 2003; Zehavi et al. 2005) are much smaller than those normally measured for radio-loud AGN and contamination would have
brought the measured clustering signal below that which is typical of the radio-loud AGN population.
Acknowledgements MM and MB wish to thank the DFG Cluster of Excellence ’Origin and Structure of the Universe’ (www.universe-cluster.de) for partial support during the completion of this work. We also wish to thank the referee for his/her constructive comments which helped improving the paper.
Based on data products from observations made with ESO Telescopes at the La Silla Paranal Observatory under ESO programme ID 179.A-2005 and on data products produced by TERAPIX and the Cambridge Astronomy Survey Unit on behalf of the UltraVISTA consortium.
References
- [appleton2004] Appleton P.N. et al., 2004, ApJS, 154, 147
- [Brand2005] Brand K., Rawlings S., Hill G.J., Tufts J.R., 2005, MNRAS, 357, 1231
- [Brinchmann 2004] Brinchmann J., Charlot S., White S.D.M. Tremonti C., Kauffmann G., Heckman T., Brinkman J., 2004, MNRAS, 351, 1151
- [\citeauthoryearBondi12003] Bondi M. et al. 2003, A&A, 403, 857
- [\citeauthoryearBondi2008] Bondi M., Ciliegi P., Schinnerer E., Smolcic V., Jahke K., Carilli C., Zamorani G., 2008, ApJ, 681, 1135
- [Bonzini 2012] Bonzini M. et al., 2012, ApJS, 203, 15
- [Bonzini 2013] Bonzini M., Padovani P., Mainieri V., Kellermann K.I., Miller N., Rosati P., Tozzi P., Vattakunnel S., 2013, MNRAS, 436, 3759
- [Bonzini 2015] Bonzini M. et al., 2015, MNRAS, 453, 1079
- [Boyle 2007] Boyle B.J., Cornwell T.J., Middleberg E., Norris R.P., Appleton P.N., Smail I., 2007, MNRAS, 385, 1143
- [Brusa 2016] Brusa M. et al. 2016, A&A 588, A58
- [Bruzual2003] Bruzual G., Charlot S., 2003, MNRAS, 344, 1000
- [Capak2007] Capak P. et al. 2007, ApJS, 172, 99
- [\citeauthoryearCarillii2004] Carilli C.L., Furlanetto S., Briggs F., Jarvis M., Rawlings S., Falcke H., 2004, New Astronomy Reviews, Elsevier, Vol. 48, Issue 11-12, 1029
- [Civano2016] Civano F. et al., 2016, ApJ, 819, 62
- [De Breuck 2010] De Breuck C. et al., 2010, ApJ, 725, 36
- [Del Moro 2013] Del Moro A. et al., 2013, A&A, 549, A59
- [Donley2012] Donley J.L. et al., 2012, ApJ, 748, 142
- [Fanaroff 1974] Fanaroff B.L., Riley J.M., 1974, MNRAS, 167, 31
- [fine2011] Fine S., Shanks T., Nikoloudakis N., Sawangwit U., 2011, MNRAS, 418, 2251
- [Garn2009] Garn T., Green D.A., Riley J.M. Alezander P., 2009, MNRAS, 397, 1101
- [\citeauthoryearIlbert2012] Ilbert O., et al., 2013, A&A, 2013, 556, A55
- [Johnston2007] Johnston S. et al., 2007, PASA, 24, 174
- [Jonas2009] Jonas J.L., 2009, IEEE Proc. 97, 1522
- [Kennicut1998] Kennicut R.C. Jr, 1998, ARA&A, 36, 189 Laigle C. et al., 2016, to appear in ApJ, arXiv:1604.02350
- [Leip 2010] Leipski C., Antonucci R., Ogle P., Whysong D., 2009, 701, 891
- [Lind2014] Lindsay S.N. et al., 2014, MNRAS, 440, 1527
- [Lind12014b] Lindsay S.N., Jarvis M.J., McAlpine K., 2014b, MNRAS, 2322, 2332
- [Lutz2011] Lutz D. et al., 2011, A&A, 532, 90
- [Lutz12014] Lutz D. 2014, ARA&A, 52, 373
- [Maglio12002] Magliocchetti M. et al. (the 2dFGRS Team) 2002, MNRAS, 333, 100
- [Maglio20032003] Magliocchetti M., Porciani C., 2003, 346, 186
- [Maglio22004] Magliocchetti M. et al. (the 2dFGRS Team) 2004, MNRAS, 350, 1485
- [Maglio32008] Magliocchetti M., Andreani P., Zwaan M.A., 2008, MNRAS, 383, 479
- [Maglio2014] Magliocchetti M. et al. 2014, MNRAS, 442, 682
- [Maglio2016] Magliocchetti M., Lutz D., Santini P., Salvato M., Popesso P., Berta S., Pozzi F., 2016, MNRAS, 456, 431
- [Maglio172017] Magliocchetti M., Popesso P., Brusa M., Salvato M., Laigle C., McCracken H.J., Ilbert O., 2017, MNRAS, 464, 3271
- [Mao2011] Mao M.Y. et al., 2011, ApJ, 731, 79
- [Marchesi2016] Marchesi S. et al., 2016, ApJ, 817, 34
- [Mauch2007] Mauch T., Sadler E.M., 2007, MNRAS, 375, 931
- [McAlpine2012] McAlpine K., Jarvis M.J., Bonfield D.G., 2013, MNRAS, 436, 1084
- [McCracken2012] McCracken H.J., et al., 2012, A&A, 544, 156
- [Morrison 2010] Morrison G.E., Owen F.N., Dickinson M., Ivison R.J., Ibar E., 2010, ApJS, 188, 178
- [Norris 2011] Norris R.P. et al., 2011, ApJ, 736, 55
- [Norberg 2002] Norberg P. et al., 2002, MNRAS, 332, 827
- [Padovani 2015] Padovani P., Bonzini M., Kellermann K., Mainieri V., Miller N., Tozzi P., 2015, MNRAS, 452, 1263
- [Peng 2010] Peng Y.j. et al., 2010, ApJ, 721, 193
- [Perna2 2015a] Perna M. et al. 2015a, A&A 574, A82
- [Perna2 2015b] Perna M. et al. 2015b, A&A 583, A72
- [Pil 2010] Pilbratt G. et al., 2010, A&A, 518, L1
- [Pog 2010] Poglitsch A. et al., 2010, A&A, 518, L2
- [Porci2004] Porciani C., Magliocchetti M., Norberg P., 2004, 355, 1010
- [Pranda 2001] Prandoni I. , Gregorini L., Parma P., de Ruiter H.R., Vettolani G., Zanichelli A., Wieringa M.H., Ekers R.D., 2001, A&A, 369, 787
- [Retana 2017] Retana-Montenegro E., Roettgering H.J.A., 2017, A&A, 600, 97
- [Rodighiero 2011] Rodighiero G. et al. 2011, ApJ, 739, L40
- [salpeter 1955] Salpeter E. E., 1955, ApJ, 121, 161
- [\citeauthoryearSchin2004] Schinnerer E., et al., 2004, AJ, 128, 1974
- [\citeauthoryearSchin2007] Schinnerer E. et al.., 2007, ApJS, 172, 46
- [\citeauthoryearSchin2010] Schinnerer E. et al.., 2010, ApJS, 188, 384
- [Scoville2007] Scoville N. et al., 2007, ApJS, 172, 1
- [\citeauthoryearseymour2011] Seymour N. et al., 2011, MNRAS, 413, 1777
- [\citeauthoryearSimp2012] Simpson C. et al. 2012, MNRAS, 421, 3060
- [\citeauthoryearSmol2017] Smolcic V. et al., 2017, A&A, 602, A2
- [tan12007] Taniguchi Y et al., 2007, ApJS, 172, 9
- [Wake2008] Wake D.A., Croom S.M., Sadler E.M., Johnston H.M., 2008, MNRAS, 391, 1674
- [\citeauthoryearWhite2015] White S.V., Jarvis M.J., Haussler B., Maddox N., 2015, MNRAS, 448, 2665
- [\citeauthoryearZehavi2005] Zehavi I. et al. 2005, ApJ, 630, 1
- [\citeauthoryearzubovas2012] Zubovas K. & King A. 2012, ApJL, 745, L34