Effect of Prandtl number on heat transport enhancement in Rayleigh-Bénard convection under geometrical confinement
Abstract
We study, using direct numerical simulations, the effect of geometrical confinement on heat transport and flow structure in Rayleigh-Bénard convection in fluids with different Prandtl numbers. Our simulations span over two decades of Prandtl number , , with the Rayleigh number fixed at . The width-to-height aspect ratio spans between and while the length-to-height aspect ratio is fixed at one. We first find that for , geometrical confinement can lead to a significant enhancement in heat transport as characterized by the Nusselt number . For those cases, is maximal at a certain . It is found that exhibits a power-law relation with as , and the maximal relative enhancement generally increases with over the explored parameter range. As opposed to the situation of , confinement-induced enhancement in is not realized for smaller values of , such as and . The dependence of the heat transport enhancement can be understood in its relation to the coverage area of the thermal plumes over the thermal boundary layer (BL) where larger coverage is observed for larger due to a smaller thermal diffusivity. We further show that is closely related to the crossing of thermal and momentum BLs, and find that declines sharply when the thickness ratio of the thermal and momentum BLs exceeds a certain value of about one. In addition, through examining the temporally averaged flow fields and 2D mode decomposition, it is found that for smaller the large-scale circulation is robust against the geometrical confinement of the convection cell.
pacs:
47.27.T-,44.25.+f,47.27.DeI Introduction
Thermally-driven flows are ubiquitous phenomena in nature and industrial applications. Turbulent Rayleigh-Bénard (RB) convection in a fluid layer heated from below and cooled from above is the classical model for studying such phenomena. This model has been used to investigate important issues related to the heat transport and flow dynamics in a broad range of research fields, including astrophysics, geophysics and engineering (Busse, 1970; Wyngaard, 1992; Linden, 1999; Shishkina and Wagner, 2012; Bailon-Cuba et al., 2012). Over the past decades, extensive studies of RB convection have been conducted using experimental, numerical and theoretical approaches (Ahlers et al., 2009; Lohse and Xia, 2010; Chillà and Schumacher, 2012; Xia, 2013). In RB convection, the control parameters that govern the flow are the Rayleigh number and the Prandtl number . Besides, the geometry of the container also plays an important role, in particular, the diameter-to-height aspect ratio . The studies of RB convection usually concern about the global heat transport across the system and also the problem of heat flow optimization. It is particularly important in passive thermal management, which is sometimes indispensable in industrial and engineering applications. Various methods to passively enhance heat transport have been found in RB studies. For instance, for RB cells with rough surfaces (Shen et al., 1996; Du and Tong, 1998; Wei et al., 2014; Wagner and Shishkina, 2015; Xie and Xia, 2017) that the heat transport can be enhanced significantly as the roughness modifies the thermal boundary layers, leading to more frequent emission of the thermal plumes. Examples also include RB flows with polymer additives (Ahlers and Nikolaenko, 2010; Benzi et al., 2010; Wei et al., 2012; Benzi et al., 2012; Xie et al., 2015). Furthermore, the heat transport can also be enhanced by adding a stabilizing force in addition to thermal driving such that highly coherent thermal plumes are formed (Huang et al., 2013; Horn and Shishkina, 2014; Chong et al., 2015, 2017).
Large number of RB studies in the past decade (Grossmann and Lohse, 2003; Ching and Tam, 2006; Bailon-Cuba et al., 2010; van der Poel et al., 2012; Zhou et al., 2012; Huang et al., 2013; Wagner and Shishkina, 2013; Chong et al., 2015; Chong and Xia, 2016; Chong et al., 2017) have been devoted to the investigation of how the varying geometrical control parameter influence the heat transport and flow properties. They can be separated into two categories: One with the aspect ratio larger than one and the other with the aspect ratio smaller than one. The present paper focuses on the latter situation, i.e. RB under geometrical confinement. Huang et al. Huang et al. (2013) has found that for RB cell with at constant , the Nusselt number can increase on decreasing the width-to-height aspect ratio , while the flow strength is reduced monotonically at the same time. The numerical work by Chong et al. Chong et al. (2015) has further studied a broader range of parameters with , at . They have revealed that the confinement-induced heat transport enhancement only occurs over a particular range of for a given . For weakly confined geometry, is found to be insensitive to the decrease in until the cell width becomes smaller than the average spacing between the thermal plumes near the thermal boundary layers. In other words, there exists an onset aspect ratio for enhancement which is given by Chong et al. (2015). When is below the onset value, the so-called plume-controlled regime sets in. Within this regime thermal plumes condensate into giant or super plumes at the opposite boundary layers, which enables them to more efficiently cool down or heat up the corresponding plate. In this regime, increases continuously on decreasing until the severely-confined regime is entered Chong and Xia (2016). The boundary between the two regimes suggest an optimal aspect ratio at which is maximized and the dependency of on is given by . On the other hand, the study by Wagner & Shishkina Wagner and Shishkina (2013) revealed that the existence of the plume-controlled regime depends strongly on . For example, for with and , no significant enhancement in was found. All this calls for an in-depth study on the influence of on confinement-induced enhancement. Another issue to be studied is the flow dynamics, which depends strongly on the geometrical control parameters. For a convection cell of the aspect ratio around one, it is known that there exists a persistent large-scale circulation (LSC) of a single-roll flow pattern (Cioni et al., 1997; Brown et al., 2005; Sun et al., 2005a; Xi et al., 2006). However, LSC becomes horizontally adjacent multiple rolls for the aspect ratio much larger than one (Funfschilling et al., 2005; Sun et al., 2005b; Bailon-Cuba et al., 2010; Xia et al., 2008). Whereas LSC becomes unstable when the aspect ratio is reduced less than one as reflected by the increased flow reversals or cessations, for both 3D Xi and Xia (2008a, b) and quasi-2D configurations (Ni et al., 2015; Huang and Xia, 2016).
In this paper, we present a comprehensive direct numerical simulation (DNS) study of the effect of on heat transfer enhancement for RB convection under geometrical confinement. In addition to heat transport, we also analyze how influences the confinement-induced change in global flow structures. The rest of the paper is organized as follows. In Sec.II, we describe the numerical method and the simulation parameters. In Sec.III, we first present the dependency of global Nusselt number and Reynolds number on the aspect ratio for different . Further, an analysis on the local quantities, such as temperature fluctuation, velocity fluctuation, boundary layers thickness are presented. Then, we compare the global flow structures for different and qualitatively by temporally averaged flow fields and quantitatively by 2D mode decomposition. In Sec.IV, we summarize our findings.
II Numerical methods and simulation parameters
The velocity field u is described by the Navier–Stokes equation within the Oberbeck-Boussinesq approximation together with the incompressibility condition. The temperature field satisfies the advection-diffusion equation. The non-dimensional form of these equations is given by:
| (1) |
| (2) |
| (3) |
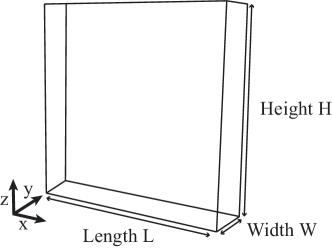
where the dimensionless control parameters are the Rayleigh number and the Prandtl number . Here , , denote the thermal expansion coefficient, kinematic viscosity and thermal diffusivity of the fluid and is the gravitational acceleration acting vertically. Also, denotes the temperature difference between top and bottom plate separated by cell height . The physical quantities are sought in dimensionless form with the cell height for length scale, and free-fall time for time scale, and the velocities are normalized by the free-fall velocity . The temperature are made dimensionless by with and being the dimensional temperature. The DNS are conducted in a box, presented in Fig. 1 together with the nomenclature and coordinates. For the domain boundaries, all walls are set to be no-slip and impermeable. The vertical walls are adiabatic while the top and bottom plates are isothermal with and after normalization.
The equations are solved by a fourth-order finite-volume method on staggered grids. The Göttingen group used the Goldfish code as in Wagner and Shishkina (2015); Shishkina and Wagner (2016), while the Hong Kong group used their well-tested extension (Kaczorowski and Xia, 2013; Kaczorowski et al., 2014) of the code (Kaczorowski et al., 2008). A requirement for obtaining reliable results in DNS studies is to resolve the Kolmogorov () and the Batchelor () length scales. The global estimation of both scales in dimensionless form are given by and . From these relations we can see that the smallest length scale to be resolved for is , whereas for , becomes the smallest scale. Also, sufficient resolution is needed inside the boundary layers as suggested by Shishkina et al. (Shishkina et al., 2010) and thus the non-uniform mesh with denser grid points in the boundary layer regions is adopted in our simulations. Based on the above requirements, vertical grid points were used for and vertical grid points for . The statistical data are collected after statistical steady state has been reached as judged by the convergence of global . Figure 2 shows examples of time series after reaching statistical steady state from where the oscillation about certain mean value is seen.
We present the simulations with cases in total. To study the effect of on change of heat transfer and flow dynamics brought by geometrical confinement, over two decades of () have been covered and all fixed at the same which is . The width-to-height aspect ratio has been varied from to while the length-to-height aspect ratio is fixed at . The details of all the cases including their meshes and check of resolution requirements are summarized in table LABEL:tab:sim.
III Results and discussion
III.1 Nusselt number and Reynolds number
We first examine how Nusselt number and Reynolds number vary with decreasing for fluid with different . The evaluation of is based on three different methods. The first one is to estimate global through the formula which represents the temporally averaged heat flux across a horizontal plane. By taking average of across every horizontal plane, we can obtain the first estimation of . Other ways to estimate make use of the exact relations and where and represent, respectively, the viscous and thermal dissipation rates averaged over time and the entire volume (Shraiman and Siggia, 1990; Grossmann and Lohse, 2000). We obtain the numerically measured by their mean value and the error of by their standard deviation. The evaluation of is based on the formula , where represents the root-mean-square value of velocities averaged over time and entire domain.
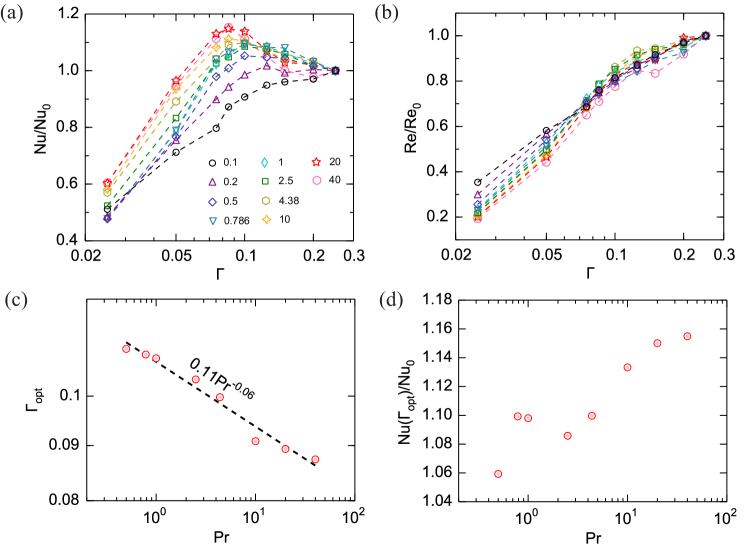
The result of normalized versus for a given is shown in figure 3 (a). It is seen that the system’s response to confinement has a strong dependence that can be classified as follows. The cases with belong to one group, for which a regime with significant enhancement of exists upon decreasing . The cases with , belong to the second group for which no significant enhancement is seen. We also find that the Reynolds number exhibits a large and monotonic decrease with , as shown in Fig. 3 (b). These results are in agreement with the previous finding that slower flow can indeed transport more heat (Huang et al., 2013). For the cases with enhanced heat transport, reaches a maximum value upon further confinement, after which heat transport efficiency declines sharply and the optimal aspect ratio can be defined through this trend.
In Chong et al. (2015) by example of it was shown that the optimal aspect ratio , which provides the maximal , exists for any . The present results suggest that the optimal also exists for any . This fact is very important for optimization of heat transport in practical applications.
Figure 3 (c) shows the dependence of on in a log-log plot. In order to estimate more accurately, quadratic fit has been made to the three points in the neighborhood of the peak position in figure 3 (a). The figure reveals that there is a power-law relationship among the two quantities, and the fitting of respective data yields . It is worthwhile to recall that the relationship between and has been found previously (Chong et al., 2015), where and follow a much stronger power-law relation: . In figure 3 (d) we further examine the maximum enhancement versus . The data is somewhat scattered, but a general trend is the growth with of the relative heat transport enhancement within the explored parameter range. Specifically, for the lowest value of () the enhancement is , while for the highest () studied the enhancement is .
III.2 Joint probability density function of velocity and temperature fluctuations
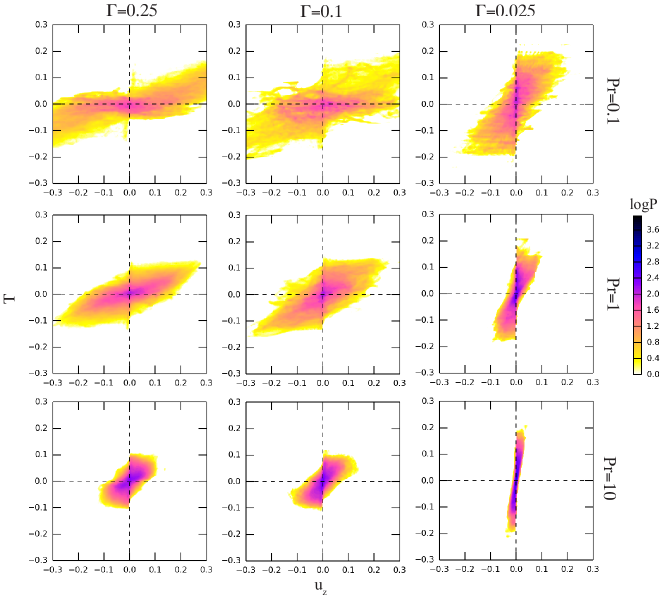
To gain further insights into how the bulk flow is modified by geometrical confinement, especially for fluid with different , we now focus on the local quantities. One of such local measurements revealing bulk flow properties is the joint probability density function between the temperature (vertical axis) and vertical velocity (horizontal axis) at mid-height of the cell, which is shown in Fig. 4. The figure can be interpreted from two perspectives; either at fixed with varying or at fixed with varying . First, along the column as increases, the shape of distribution function shrinks horizontally, meaning for larger the extreme events for velocity become less probable. This feature can be understood as the fluid flow becomes less turbulent for larger . Second, along the row with fixed but decreasing , the shape change of distribution functions lead us to identify two competing effects. On one hand geometrical confinement slows down the bulk flow due to stronger drag from the sidewalls, and hence it is less probable for large velocity to occur. On the other hand, confinement leads to the formation of highly coherent plumes (Huang et al., 2013) and thus the temperature distribution is elongated since hot (cold) plumes become hotter (colder) when they reach the mid-height. However, the bulk properties observed here cannot explain why enhancement has not been realized for and . As can be seen increasing plume coherency in the bulk has also been realized for but in such case, there is no heat transport enhancement globally. This observation suggests that instead of bulk property, other quantities may also play important roles on heat transport enhancement, for example the local properties at the edge of BL.
III.3 Physical quantities in thermal boundary layers
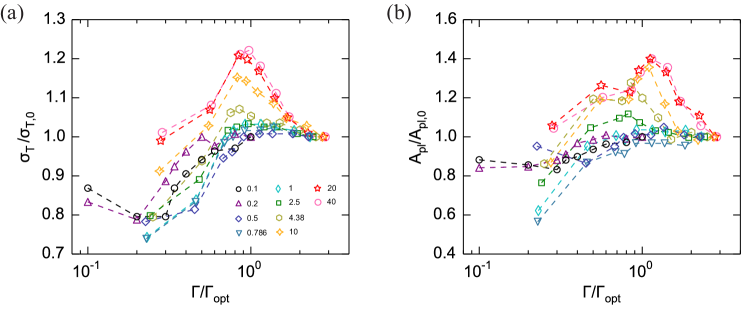
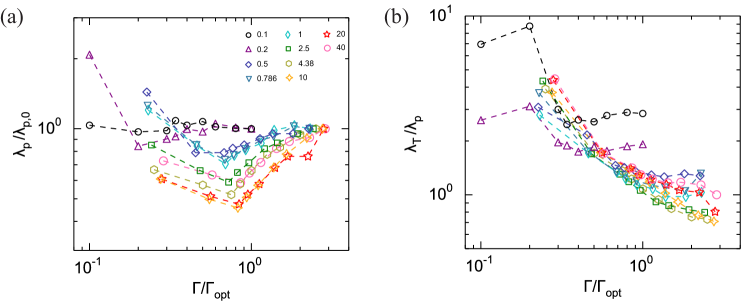
Figure 5 (a) shows temperature standard deviation evaluated at the edge of thermal BL versus /. We normalize in this way to better illustrate how the quantities concerned vary as the optimal point is approached. Here we estimate the thickness of the temperature BL based on the vertical temperature standard deviation profiles from which the location of maximum value is regarded as the thickness. The local quantities taken from the thermal BL indeed allow us to observe the differences caused by . For large cases, we clearly see that increases as is reduced towards . Also worthy of noting is that the trend is more pronounced for the few largest values of . It may be understood by recognizing that larger corresponds to smaller thermal diffusivity and so the plumes are able to better preserve their heat content when traversing to the opposite end. In case of too large thermal diffusivity, i.e. cases of and , the plume’s heat content loss to ambient fluid is most severe. Indeed, we do not observe appreciable increase of at thermal BL for those cases.
Besides temperature standard deviation at the edge of thermal BL, plume coverage is also important for heat transport enhancement by confinement as shown in (Chong et al., 2015). The estimation of plume coverage requires the extraction of cold plumes over the hot bottom BL and is defined as the area satisfying , and the rms is the value for at a given . The empirical parameter is chosen to be 0.5. We have tested different choices of and found that our main conclusions do not depend on the particular choice of its value. Figure 5 (b) shows the normalized coverage of cold plumes over the edge of the (hot) bottom thermal BL versus rescaled aspect ratio . For large cases, it shows clearly that, as is approached, the plume coverage is increased significantly. This suggests that the bottom (top) BL is cooled down (heat up) more efficiently, which also results in a thinner BL. Again, such increase in plume coverage is largely absent for very low , i.e., and . Thus the properties of both and plume coverage at the edge of the thermal BL can explain the behavior of dependence of in response to confinement.
III.4 Crossing of momentum and temperature boundary layers
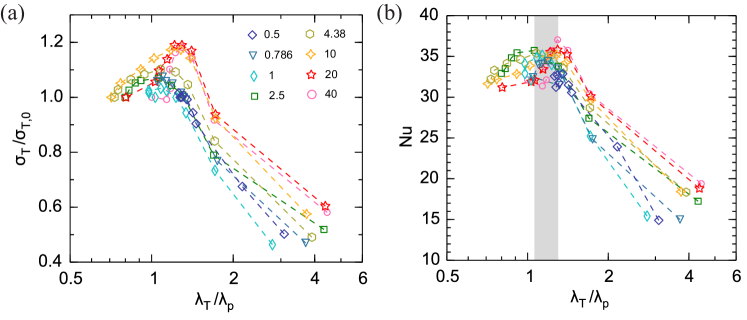
In a recent study it has been shown that the relative thickness of thermal and momentum BLs plays a major role on optimal transport (Chong et al., 2017). To understand the -dependent optimal point found in this work, we follow the same idea. Using the proposal made by Chong et al. the thickness of momentum BL may be defined by the first peak of profile (Chong et al., 2017). The edge of momentum BL through this definition indicates the location with strongest suction of fluid element. Figure 6 (a) shows the normalized momentum BL thickness versus rescaled aspect ratio for different . First, for , we observe that the momentum BL becomes thinner as is reduced towards . The amount of decline in thickness increases with . Specially, a decrease is seen for and a decrease for . In contrast, such a decrease is absent for the cases of and . We next examine the ratio of the thicknesses of the thermal and momentum BLs, , versus , which is presented in Fig. 6 (b). It is found that the ratio of BLs thicknesses generally increases with decreasing for but again, not for and . At a certain around one, the thermal and momentum BLs have comparable thickness such that the location of the maximum normal stress coincides with that of maximum temperature fluctuation. This BLs crossing leads to the strongest coupling of normal stress and temperature fluctuation which is a favorable condition for plume emission (Chong et al., 2017). However when the confinement becomes too severe, the momentum BL will be nested deeply inside the thermal one. Previous works have shown that temperature fluctuation decreases sharply within thermal BL (Belmonte et al., 1994; Lui and Xia, 1998). Therefore for momentum BL much thinner than the thermal BL, the suction of fluid will occur at positions lacking thermal instability and thus is not favorable to plume emission and heat transport. To provide evidence on such coupling, we have examined the normalized temperature standard deviation at the edge of momentum BL versus thickness ratio in figure 7 (a). When the momentum BL becomes thinner and approaching the thickness of thermal BL, the increase of at the edge of momentum BL has been observed. However, when the thickness ratio becomes much larger than one, drops sharply. As the figure suggests, BL crossing entails the strongest coupling between the normal stress and temperature standard deviation that is crucial to heat transport. To further demonstrate this, we plot against the thickness ratio in figure 7 (b). It is seen that the optimal transport occurs for thickness ratio around one, namely between and (the shaded strip), and it again justifies that the BL crossing is intimately related to the optimal point.
III.5 Global flow structures
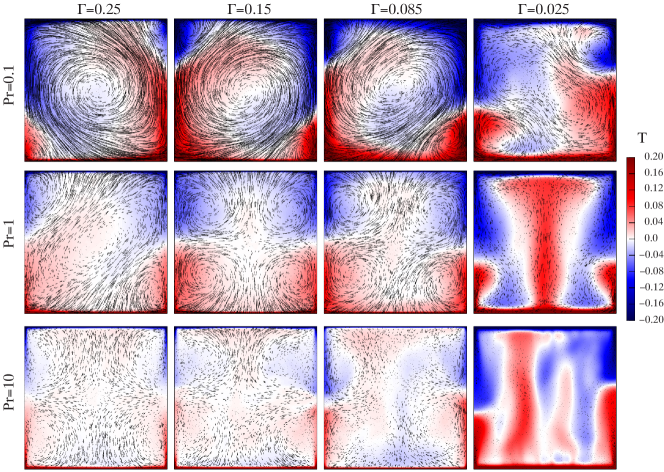
We now examine the changes in flow pattern brought by confinement for fluid with different . Figure 8 displays temporally-averaged mean velocity fields along x-z plane at mid-width together with temperature fields. We illustrate the properties of the mean flow field using four different (, , and ) and three different (, and ). We first consider the case of and . It demonstrates a typical flow pattern in RB flow where there exists a well-defined large-scale circulation (LSC) with two counter-rotating corner rolls. For such a case, plumes most likely detach near sidewalls therefore hot and cold regions form on either side and the mean temperature field provides such a footmark. Due to the existence of corner rolls, plumes no longer impinge the opposite plates head on but rather at an angle as they are being steered. As decreases to and further to , besides the reduced flow speed, the shape change of LSC is observed. As the figure suggests, the size of the LSC shrinks while the two corner rolls grow under confinement. With further confinement to , the shape of LSC distorts largely and impingement of plumes becomes head on.
When is increased to , the variation of flow pattern under confinement exhibits a different behavior. For at this , the LSC still persists but larger corner rolls are seen as compared to the cases with . However, when is further reduced to , the mean field displays a four-roll pattern as opposed to a single-roll flow structure. Some earlier studies had revealed that a time-averaged four-roll pattern can be brought about by the superposition of two flow fields with opposite flow directions (Sun et al., 2005c; Kaczorowski et al., 2014). The change of flow pattern indicates that the LSC becomes less stable and therefore flow reversals occur more frequently. Under further confinement to , the four-roll flow pattern still persists until reaches where the flow is dominated by vertical motion such that columnar structures appear in the temperature field. For , single-roll structure has already broken down to four-roll at . It demonstrates that the LSC becomes more unstable for larger . With further confinement to , it again exhibits the formation of columnar plumes and vertically aligned flow structures.
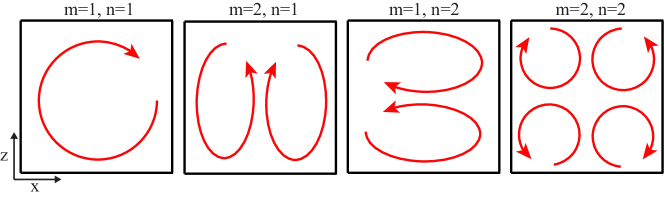
A more quantitative approach to study flow pattern and the strength of LSC is via the so-called 2D mode decomposition method (Petschel et al., 2011; Chandra and Verma, 2011; Wagner and Shishkina, 2013). We remark that this 2D technique is suitable here because our configurations are quasi-2D and the circulations are along the x-z plane. We apply the decomposition algorithm to a set of vertical cross-sections from instantaneous flow fields taken at mid-width, with the planar velocity field (, ) being projections into the Fourier modes given as follows
| (4) |
| (5) |
where the first four modes are often considered (Chandra and Verma, 2011; Wagner and Shishkina, 2013), i.e. . To give impression on those modes, we have drawn their flow pattern accordingly in figure 9. As suggested in (Wagner and Shishkina, 2013), the projection is done component-wise on individual snapshots such that the time series of and are obtained. Then a value representing the mode contribution can be evaluated by .
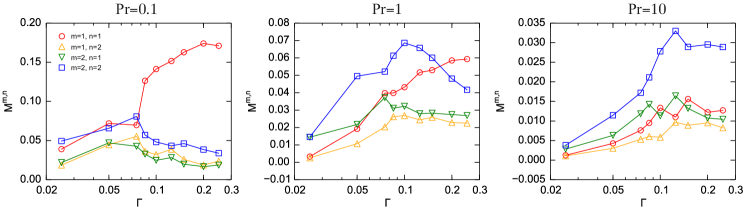
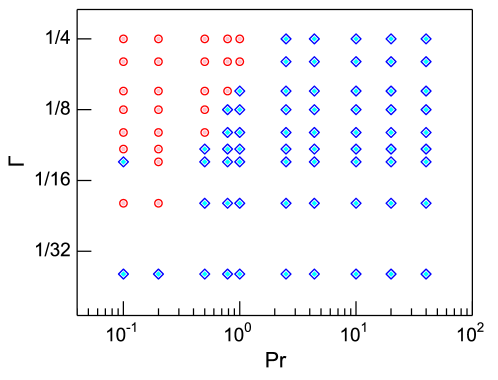
In Fig. 10 we compare the contributions of each mode (for ) as a function of for different . Similar to the mean field, we have chosen , and for demonstration. First we consider at . The value of , which represents the single-roll structure, is at least times larger than that of other modes. Upon decreasing , the first mode becomes less dominant over other modes but is still the largest one. When reaches about , declines sharply and becomes comparable to that of , which represents the four-roll structure. From the discussion in the previous section, this is an indication that the LSC is being suppressed by confinement. When confinement is increased further to , the magnitudes of and remain comparable. For , is still the mode with largest magnitude at but its value is only times larger than that of others. The most prominent feature here is that the mode overtakes the mode below . Our quantitative result again demonstrates that the LSC is less stable for larger . The mode dominates until where becomes comparable to which could indicate the formation of vertically aligned flow structures. For , the mode is dominant over the full range of explored except at which magnitudes of and are comparable. This method enables us to quantify the strength of LSC and judge the presence of LSC by considering whether is the largest mode among others. Figure 11 gives the phase diagram illustrating when to expect the existence of LSC in the parameter space.
IV Conclusions
To summarize, we have studied the role played by the Prandtl number in geometrical confinement in terms of its effect on heat transport and flow structures, through DNS with , and fixed at . With regard to global convective heat transport, it is found that the existence, and the amount, of heat transport enhancement brought about by confinement depends strongly on . For , significant heat transport enhancement has been observed but not for and . We can define an optimal aspect ratio at which is maximized for cases with enhancement. The -dependence of is found to follow a power-law relationship, . With regard to the amount of enhancement, the maximum enhancement generally increases with over the explored parameter range, ranging from to as increased from to (for ; as the maximum enhancement also depends on ). Through the joint probability density function between vertical velocity and temperature standard deviations at mid-height, we can identify two competing effects due to confinement. On one hand, confinement reduces the flow strength; on the other hand, plumes become more coherent as revealed by the temperature distribution function. However, besides these bulk properties, local quantities including plume coverage and temperature standard deviation at the edge of thermal BL seem to play more important roles in determining the global heat transport. It helps us to understand why larger produces larger enhancement and why no enhancement observed for smaller values of , such as and . To explain , we have examined the relative thickness of thermal and momentum BL . It has been suggested in (Chong et al., 2017) that the BL thickness ratio closing to unity actually corresponds to the situation with strongest coupling between normal stress, i.e. suction of fluid, and the temperature fluctuations. This optimal coupling between the two quantities leads to the optimal transport. Our results with different at support this physical picture and again justify that optimal transport occurs when is around one. We have in addition studied the global flow structure by examining the temporally averaged flow fields and through a 2D mode decomposition. A consequence of the geometrical confinement is the weakening of LSC, which is manifested by the fact that the single-roll flow structure is replaced by a four-roll structure in the time-averaged flow field. It is also supported by results from the 2D mode decomposition that mode no longer dominates. We further show that LSC persists over a wider range of for smaller . A phase diagram for the LSC existence is shown in figure 11.
This work was conducted under the Cooperation Agreement between the Max Planck Society and the Chinese University of Hong Kong. It was supported by the Hong Kong Research Grants Council under the Project No. CUHK404513 and CUHK1430115, and a NSFCRGC Joint Research Grant N_CUHK43715; and through a Hong Kong PhD Fellowship. OS and SW thank German Research Foundation (DFG) for the support under the grants Sh 405/3 and Sh 405/4 – Heisenberg Fellowship. The authors are also grateful for the support of computational resources by the Leibniz-Rechenzentrum Munich under the project pr84pu.
References
- Busse (1970) F. H. Busse, “Differential rotation in steller convection zones,” Astrophys. J. 1590, 629–639 (1970).
- Wyngaard (1992) J. C. Wyngaard, “Atmospheric turbulence,” Annu. Rev. Fluid Mech 24, 205–234 (1992).
- Linden (1999) P. F. Linden, “The fluid mechanics of natural ventilation,” Annu. Rev. Fluid Mech. 31, 201–238 (1999).
- Shishkina and Wagner (2012) O. Shishkina and C. Wagner, “A numerical study of turbulent mixed convection in an enclosure with heated rectangular elements,” J. of Turb. 13, N22 (2012).
- Bailon-Cuba et al. (2012) J. Bailon-Cuba, O. Shishkina, C. Wagner, and J. Schumacher, “Low-dimensional model of turbulent mixed convection in a complex domain,” Phys. Fluids 24, 107101 (2012).
- Ahlers et al. (2009) G. Ahlers, S. Grossmann, and D. Lohse, “Heat transfer & large-scale dynamics in turbulent Rayleigh-Bénard convection,” Rev. Mod. Phys. 81, 503–537 (2009).
- Lohse and Xia (2010) D. Lohse and K.-Q. Xia, “Small-scale properties of turbulent Rayleigh-Bénard convection,” Annu. Rev. Fluid Mech. 42, 335–364 (2010).
- Chillà and Schumacher (2012) F. Chillà and J. Schumacher, “New perspectives in turbulent Rayleigh-Bénard convection,” Eur. Phys. J. E 35, 58 (2012).
- Xia (2013) K.-Q. Xia, “Current trends and future directions in turbulent thermal convection,” Theor. Appl. Mech. Lett. 3, 052001 (2013).
- Shen et al. (1996) Y. Shen, P. Tong, and K.-Q. Xia, “Turbulent convection over rough surfaces,” Phys. Rev. Lett. 76, 908 (1996).
- Du and Tong (1998) Y.-B. Du and P. Tong, “Enhanced heat transport in turbulent convection over a rough surface,” Phys. Rev. Lett. 81, 987 (1998).
- Wei et al. (2014) P. Wei, T.-S. Chan, R. Ni, X.-Z. Zhao, and K. Q. Xia, “Heat transport properties of plates with smooth and rough surfaces in turbulent thermal convection,” J. Fluid Mech. 740, 28–46 (2014).
- Wagner and Shishkina (2015) S. Wagner and O. Shishkina, “Heat flux enhancement by regular surface roughness in turbulent thermal convection,” J. Fluid Mech. 763, 109–135 (2015).
- Xie and Xia (2017) Y.-C. Xie and K.-Q. Xia, “Turbulent thermal convection over rough plates with varying roughness geometries,” J. Fluid Mech. 825, 573–599 (2017).
- Ahlers and Nikolaenko (2010) G. Ahlers and A. Nikolaenko, “Effect of a polymer additive on heat transport in turbulent Rayleigh-Bénard convection,” Phys. Rev. Lett. 104, 034503 (2010).
- Benzi et al. (2010) R. Benzi, E. S. C. Ching, and E. De Angelis, “Effect of polymer additives on heat transport in turbulent thermal convection,” Phys. Rev. Lett. 104, 024502 (2010).
- Wei et al. (2012) P. Wei, R. Ni, and K.-Q. Xia, “Enhanced and reduced heat transport in turbulent thermal convection with polymer additives,” Phys. Rev. E 86, 016325 (2012).
- Benzi et al. (2012) R. Benzi, E. S. C. Ching, and V. W. S. Chu, “Heat transport by laminar boundary layer flow with polymers,” J. of Fluid Mech. 696, 330–344 (2012).
- Xie et al. (2015) Y.-C. Xie, S.-D. Huang, D. Funfschilling, X.-M. Li, R. Ni, and K.-Q. Xia, “Effects of polymer additives in the bulk of turbulent thermal convection,” J. Fluid Mech. 784, R3 (2015).
- Huang et al. (2013) S.-D. Huang, M. Kaczorowski, R. Ni, and K.-Q. Xia, “Confinement-induced heat-transport enhancement in turbulent thermal convection,” Phys. Rev. Lett. 111, 104501 (2013).
- Horn and Shishkina (2014) S. Horn and O. Shishkina, “Rotating non-Oberbeck–Boussinesq Rayleigh-Bénard convection in water,” Phys. Fluids 26, 055111 (2014).
- Chong et al. (2015) K. L. Chong, S. D. Huang, M. Kaczorowski, and K. Q. Xia, “Condensation of coherent structures in turbulent flows,” Phys. Rev. Lett. 115, 264503 (2015).
- Chong et al. (2017) K. L. Chong, Y. Yang, S.-D. Huang, J.-Q. Zhong, R. J. A. M. Stevens, R. Verzicco, D. Lohse, and K.-Q. Xia, “Confined Rayleigh-Bénard, rotating Rayleigh-Bénard, and double diffusive convection: A unifying view on turbulent transport enhancement through coherent structure manipulation,” Phys. Rev. Lett. 119, 064501 (2017).
- Grossmann and Lohse (2003) S. Grossmann and D. Lohse, “On geometry effects in Rayleigh-Bénard convection,” J. Fluid Mech. 486, 105–114 (2003).
- Ching and Tam (2006) E. S. C. Ching and W. S. Tam, “Aspect-ratio dependence of heat transport by turbulent Rayleigh-Bénard convection,” J. Turbul. , N72 (2006).
- Bailon-Cuba et al. (2010) J. Bailon-Cuba, M. S. Emran, and J. Schumacher, “Aspect ratio dependence of heat transfer and large-scale flow in turbulent convection,” J. Fluid Mech. 655, 152–173 (2010).
- van der Poel et al. (2012) E. P. van der Poel, R. J. A. M. Stevens, K. Sugiyama, and D. Lohse, “Flow states in two-dimensional Rayleigh-Bénard convection as a function of aspect-ratio and Rayleigh number,” Phys. Fluids 24, 085104 (2012).
- Zhou et al. (2012) Q. Zhou, B.-F. Liu, C.-M. Li, and B.-C. Zhong, “Aspect ratio dependence of heat transport by turbulent Rayleigh-Bénard convection in rectangular cells,” J. Fluid Mech. 710, 260–276 (2012).
- Wagner and Shishkina (2013) S. Wagner and O. Shishkina, “Aspect-ratio dependency of Rayleigh-Bénard convection in box-shaped containers,” Phys. Fluids 25, 1–16 (2013).
- Chong and Xia (2016) K. L. Chong and K. Q. Xia, “Exploring the severly confined regime in Rayleigh-Bénard convection,” J. Fluid Mech. 805, R4 (2016).
- Cioni et al. (1997) S. Cioni, S. Ciliberto, and J. Sommeria, “Strongly turbulent Rayleigh-Bénard convection in mercury: comparison with results at moderate Prandtl number,” J. Fluid Mech. 335, 111–140 (1997).
- Brown et al. (2005) E. Brown, A. Nikolaenko, and G. Ahlers, “Reorientation of the large-scale circulation in turbulent Rayleigh-Bénard convection,” Phys. Rev. Lett. 95, 084503 (2005).
- Sun et al. (2005a) C. Sun, H.-D. Xi, and K.-Q. Xia, “Azimuthal symmetry, flowdynamics, and heat transport in turbulent thermal convection in a cylinder with an aspect ratio of 0.5,” Phys. Rev. Lett. 95, 074502 (2005a).
- Xi et al. (2006) H.-D. Xi, Q. Zhou, and K.-Q. Xia, “Azimuthal motion of the mean wind in turbulent thermal convection,” Phys. Rev. E 73, 056312 (2006).
- Funfschilling et al. (2005) D. Funfschilling, E. Brown, A. Nikolaenko, and G. Ahlers, “Heat transport by turbulent Rayleigh-Bénard convection in cylindrical cells with aspect ratio one and larger,” J. Fluid Mech. 536, 145–154 (2005).
- Sun et al. (2005b) C. Sun, L.-Y. Ren, H. Song, and K.-Q. Xia, “Heat transport by turbulent Rayleigh-Bénard convection in cylindrical cells of widely varying aspect ratios,” J. Fluid Mech. 542, 165–174 (2005b).
- Xia et al. (2008) K.-Q. Xia, C. Sun, and Y.-H. Cheung, “Large scale velocity structures in turbulent thermal convection with widely varying aspect ratio,” in Proceedings of the 14th International Symposium on Applications of Laser Techniques to Fluid Mechanics (2008).
- Xi and Xia (2008a) H.-D. Xi and K.-Q. Xia, “Flow mode transitions in turbulent thermal convection,” Phys. Fluids 20, 055104 (2008a).
- Xi and Xia (2008b) H.-D. Xi and K.-Q. Xia, “Azimuthal motion, reorientation, cessation, and reversal of the large-scale circulation in turbulent thermal convection: a comparative study in aspect ratio one and one-half geometries,” Phys. Rev. E 78, 036326 (2008b).
- Ni et al. (2015) R. Ni, S.-D. Huang, and K.-Q. Xia, “Reversals of the large-scale circulation in quasi-2D Rayleigh-Bénard convection,” J. Fluid Mech. 778, R5 (2015).
- Huang and Xia (2016) S.-D. Huang and K.-Q. Xia, “Effects of geometric confinement in quai-2-D turbulent Rayleigh-Bénard convection,” J. Fluid Mech. 794, 639–654 (2016).
- Shishkina and Wagner (2016) O. Shishkina and S. Wagner, “Prandtl-number dependence of heat transport in laminar horizontal convection,” Phys. Rev. Lett. 116, 024302 (2016).
- Kaczorowski and Xia (2013) M. Kaczorowski and K.-Q. Xia, “Turbulent flow in the bulk of Rayleigh-Bénard convection:small-scale properties in a cubic cell,” J. Fluid Mech. 722, 596–617 (2013).
- Kaczorowski et al. (2014) M. Kaczorowski, K.-L. Chong, and K.-Q. Xia, “Turbulent flow in the bulk of Rayleigh-Bénard convection:aspect-ratio dependence of the small-scale properties,” J. Fluid Mech. 747, 73–102 (2014).
- Kaczorowski et al. (2008) M. Kaczorowski, A. Shishkin, O. Shishkina, and C Wagner, “Development of a numerical procedure for direction simulations of turbulent convection in a closed rectangular cell,” New Results in Numerical and Experimental Fluid Mech. VI 96, 381–388 (2008).
- Shishkina et al. (2010) O. Shishkina, R. J. A. M Stevens, S. Grossmann, and D. Lohse, “Boundary layer structure in turbulent thermal convection and its consequences for the required numerical resolution,” New J. Phys. 12, 075022 (2010).
- Shraiman and Siggia (1990) B. I. Shraiman and E. D. Siggia, “Heat transport in high-Rayleigh-number convection,” Phys. Rev. A 42, 3650–3653 (1990).
- Grossmann and Lohse (2000) S. Grossmann and D. Lohse, “Scaling in thermal convection: a unifying theory,” J. Fluid Mech. 407, 27–56 (2000).
- Belmonte et al. (1994) A. Belmonte, A. Tilgner, and A. Libchaber, “Temperature and velocity boundary layers in turbulent convection,” Phys. Rev. E 50, 269 (1994).
- Lui and Xia (1998) S.-L. Lui and K.-Q. Xia, “Spatial structure of the thermal boundary layer in turbulent convection,” Phys. Rev. E 57, 5494–5503 (1998).
- Sun et al. (2005c) C. Sun, K.-Q. Xia, and P. Tong, “Three-dimensional flow structures and dynamics of turbulent thermal convection in a cylindrical cell,” Phys. Rev. E 72, 026302 (2005c).
- Petschel et al. (2011) K. Petschel, M. Wilczek, M. Breuer, R. Friedrich, and U. Hansen, “Statistical analysis of global wind dynamics in vigorous rayleigh-bénard convection,” Phys. Rev. E 84, 026309 (2011).
- Chandra and Verma (2011) M. Chandra and M. K. Verma, “Dynamics and symmetries of flow reversals in turbulent convection,” Phys. Rev. E 83, 067303 (2011).
| 0.1 | 0.025 | 768x768x28 | 0.77 | 0.24 | 40/2 | 20/1 | 200 | 13.360.01 |
| 0.050 | 768x768x42 | 0.84 | 0.27 | 30/3 | 15/1 | 184 | 18.620.06 | |
| 0.075 | 768x768x64 | 0.87 | 0.27 | 27/3 | 13/1 | 184 | 20.830.10 | |
| 0.085 | 768x768x68 | 0.89 | 0.28 | 25/3 | 12/1 | 156 | 22.800.12 | |
| 0.100 | 768x768x84 | 0.90 | 0.28 | 24/3 | 12/2 | 144 | 23.720.14 | |
| 0.125 | 768x768x100 | 0.91 | 0.29 | 23/3 | 11/2 | 178 | 24.810.19 | |
| 0.150 | 768x768x128 | 0.91 | 0.29 | 23/3 | 11/2 | 178 | 25.110.21 | |
| 0.200 | 768x768x168 | 0.91 | 0.29 | 22/3 | 11/2 | 158 | 25.370.26 | |
| 0.250 | 768x768x200 | 0.92 | 0.29 | 22/3 | 11/2 | 141 | 26.140.35 | |
| 0.2 | 0.025 | 560x560x18 | 0.75 | 0.34 | 28/2 | 17/1 | 200 | 13.780.02 |
| 0.050 | 560x560x32 | 0.85 | 0.38 | 19/3 | 12/2 | 320 | 21.410.04 | |
| 0.075 | 560x560x46 | 0.89 | 0.40 | 16/3 | 10/2 | 320 | 25.490.10 | |
| 0.085 | 560x560x52 | 0.90 | 0.40 | 16/3 | 9/2 | 320 | 26.740.12 | |
| 0.100 | 560x560x60 | 0.91 | 0.41 | 15/4 | 9/2 | 320 | 27.950.14 | |
| 0.125 | 560x560x74 | 0.92 | 0.41 | 15/4 | 9/2 | 160 | 28.860.17 | |
| 0.150 | 560x560x88 | 0.91 | 0.41 | 15/4 | 9/2 | 320 | 28.150.20 | |
| 0.200 | 560x560x116 | 0.91 | 0.41 | 15/4 | 9/2 | 480 | 28.470.22 | |
| 0.250 | 560x560x144 | 0.91 | 0.41 | 15/4 | 9/2 | 160 | 28.350.31 | |
| 0.5 | 0.025 | 384x512x48 | 0.71 | 0.50 | 29/3 | 24/2 | 674 | 14.900.04 |
| 0.050 | 384x512x48 | 0.81 | 0.57 | 20/3 | 16/3 | 1349 | 23.920.05 | |
| 0.075 | 384x512x74 | 0.86 | 0.61 | 16/4 | 13/3 | 750 | 30.570.06 | |
| 0.085 | 384x512x78 | 0.87 | 0.61 | 8/4 | 6/3 | 210 | 31.890.08 | |
| 0.100 | 384x512x98 | 0.88 | 0.62 | 15/4 | 12/3 | 880 | 32.870.07 | |
| 0.125 | 384x512x100 | 0.87 | 0.62 | 15/4 | 12/3 | 564 | 32.700.09 | |
| 0.150 | 384x512x128 | 0.87 | 0.62 | 15/4 | 12/3 | 681 | 32.580.07 | |
| 0.200 | 384x512x160 | 0.87 | 0.61 | 15/4 | 12/3 | 588 | 31.750.06 | |
| 0.250 | 384x512x200 | 0.86 | 0.61 | 16/4 | 13/3 | 473 | 31.220.05 | |
| 0.786 | 0.025 | 384x512x48 | 0.57 | 0.50 | 29/3 | 27/2 | 672 | 15.000.03 |
| 0.050 | 384x512x48 | 0.65 | 0.58 | 19/3 | 18/3 | 1336 | 24.830.02 | |
| 0.075 | 384x512x74 | 0.70 | 0.62 | 15/4 | 14/4 | 739 | 32.740.03 | |
| 0.085 | 384x512x78 | 0.70 | 0.62 | 8/4 | 7/4 | 210 | 33.390.04 | |
| 0.100 | 384x512x98 | 0.71 | 0.63 | 14/4 | 13/4 | 750 | 34.420.06 | |
| 0.125 | 384x512x100 | 0.70 | 0.62 | 15/4 | 13/4 | 749 | 34.090.06 | |
| 0.150 | 384x512x128 | 0.70 | 0.62 | 15/4 | 13/4 | 700 | 33.990.06 | |
| 0.200 | 384x512x160 | 0.70 | 0.62 | 15/4 | 14/4 | 611 | 32.440.03 | |
| 0.250 | 320x320x96 | 0.83 | 0.73 | 8/4 | 7/3 | 520 | 31.470.06 | |
| 1 | 0.025 | 384x512x48 | 0.51 | 0.51 | 28/3 | 28/3 | 786 | 15.420.03 |
| 0.050 | 384x512x48 | 0.58 | 0.58 | 19/3 | 19/3 | 934 | 25.230.05 | |
| 0.075 | 384x512x74 | 0.62 | 0.62 | 15/4 | 15/4 | 996 | 32.880.04 | |
| 0.085 | 384x512x78 | 0.63 | 0.63 | 8/4 | 7/4 | 420 | 34.410.08 | |
| 0.100 | 384x512x98 | 0.63 | 0.63 | 14/4 | 14/4 | 972 | 35.150.06 | |
| 0.125 | 384x512x100 | 0.63 | 0.63 | 14/4 | 14/4 | 817 | 34.830.04 | |
| 0.150 | 384x512x128 | 0.62 | 0.62 | 15/4 | 14/4 | 748 | 34.100.05 | |
| 0.200 | 384x512x160 | 0.62 | 0.62 | 15/4 | 15/4 | 707 | 32.900.05 | |
| 0.250 | 384x512x200 | 0.62 | 0.62 | 15/4 | 15/4 | 837 | 32.110.05 | |
| 2.5 | 0.025 | 384x512x48 | 0.33 | 0.52 | 26/3 | 33/4 | 1126 | 17.240.01 |
| 0.050 | 384x512x48 | 0.37 | 0.59 | 18/3 | 23/5 | 2000 | 27.420.04 | |
| 0.075 | 384x512x74 | 0.39 | 0.62 | 15/4 | 19/5 | 989 | 33.790.03 | |
| 0.085 | 384x512x78 | 0.40 | 0.63 | 7/4 | 9/5 | 420 | 35.510.11 | |
| 0.100 | 384x512x98 | 0.40 | 0.63 | 14/4 | 18/5 | 1086 | 35.730.04 | |
| 0.125 | 384x512x100 | 0.40 | 0.63 | 14/4 | 18/5 | 1009 | 35.440.03 | |
| 0.150 | 384x512x128 | 0.40 | 0.63 | 14/4 | 18/5 | 829 | 34.830.04 | |
| 0.200 | 384x512x160 | 0.39 | 0.62 | 15/4 | 19/5 | 669 | 33.500.04 | |
| 0.250 | 384x512x200 | 0.39 | 0.62 | 15/4 | 19/5 | 538 | 32.920.04 | |
| 4.38 | 0.025 | 256x256x16 | 0.38 | 0.80 | 11/3 | 16/5 | 300 | 18.350.01 |
| 0.050 | 256x256x20 | 0.43 | 0.90 | 7/4 | 11/6 | 400 | 28.700.08 | |
| 0.075 | 256x256x28 | 0.45 | 0.93 | 9/4 | 13/6 | 500 | 33.510.08 | |
| 0.085 | 256x256x28 | 0.45 | 0.93 | 6/4 | 9/7 | 300 | 35.140.11 | |
| 0.100 | 256x256x36 | 0.45 | 0.95 | 6/4 | 9/7 | 640 | 35.410.11 | |
| 0.125 | 256x256x38 | 0.45 | 0.94 | 6/4 | 9/7 | 370 | 34.630.18 | |
| 0.150 | 256x256x68 | 0.45 | 0.94 | 9/4 | 13/6 | 350 | 34.130.07 | |
| 0.200 | 256x256x68 | 0.45 | 0.93 | 6/4 | 9/6 | 350 | 33.300.08 | |
| 0.250 | 256x256x72 | 0.44 | 0.92 | 7/4 | 10/6 | 380 | 32.200.09 | |
| 10 | 0.025 | 256x256x8 | 0.17 | 0.53 | 20/3 | 36/6 | 413 | 18.410.11 |
| 0.050 | 256x256x16 | 0.19 | 0.60 | 10/4 | 17/8 | 600 | 29.620.07 | |
| 0.075 | 256x256x24 | 0.20 | 0.63 | 9/4 | 16/9 | 510 | 34.260.08 | |
| 0.085 | 256x256x24 | 0.20 | 0.63 | 6/4 | 11/9 | 508 | 35.200.12 | |
| 0.100 | 256x256x26 | 0.20 | 0.63 | 8/4 | 14/9 | 375 | 34.980.10 | |
| 0.125 | 256x256x26 | 0.20 | 0.63 | 9/4 | 16/8 | 180 | 33.880.04 | |
| 0.150 | 256x256x42 | 0.20 | 0.62 | 9/4 | 16/8 | 345 | 32.850.06 | |
| 0.200 | 256x256x60 | 0.19 | 0.62 | 9/4 | 16/8 | 270 | 32.190.08 | |
| 0.250 | 256x256x64 | 0.19 | 0.61 | 9/4 | 16/8 | 560 | 31.650.10 | |
| 20 | 0.025 | 256x256x8 | 0.18 | 0.81 | 12/3 | 27/8 | 490 | 18.820.11 |
| 0.050 | 256x256x16 | 0.20 | 0.91 | 10/4 | 21/10 | 945 | 30.100.04 | |
| 0.075 | 256x256x24 | 0.21 | 0.95 | 9/4 | 18/11 | 751 | 35.250.13 | |
| 0.085 | 256x256x24 | 0.21 | 0.95 | 6/4 | 13/11 | 509 | 35.810.12 | |
| 0.100 | 256x256x26 | 0.21 | 0.95 | 7/4 | 16/11 | 375 | 35.530.15 | |
| 0.125 | 256x256x34 | 0.21 | 0.93 | 9/4 | 19/11 | 687 | 33.430.05 | |
| 0.150 | 256x256x42 | 0.21 | 0.92 | 9/4 | 20/10 | 728 | 32.090.04 | |
| 0.200 | 256x256x60 | 0.21 | 0.92 | 9/4 | 20/10 | 378 | 31.890.02 | |
| 0.250 | 256x256x64 | 0.21 | 0.92 | 9/4 | 19/10 | 300 | 31.190.10 | |
| 40 | 0.025 | 256x256x8 | 0.13 | 0.81 | 12/3 | 32/10 | 875 | 19.400.14 |
| 0.050 | 256x256x16 | 0.14 | 0.91 | 10/4 | 24/13 | 560 | 30.440.05 | |
| 0.075 | 256x256x24 | 0.15 | 0.95 | 9/4 | 22/14 | 952 | 35.750.05 | |
| 0.085 | 256x256x24 | 0.15 | 0.95 | 6/4 | 16/14 | 270 | 37.040.05 | |
| 0.100 | 256x256x26 | 0.15 | 0.95 | 7/4 | 20/14 | 1000 | 35.700.05 | |
| 0.125 | 256x256x34 | 0.15 | 0.94 | 9/4 | 23/13 | 700 | 33.710.02 | |
| 0.150 | 256x256x42 | 0.15 | 0.93 | 9/4 | 23/13 | 322 | 32.120.06 | |
| 0.200 | 256x256x60 | 0.15 | 0.92 | 9/4 | 24/13 | 504 | 31.370.04 | |
| 0.250 | 256x256x64 | 0.15 | 0.92 | 9/4 | 22/13 | 280 | 32.110.16 |