NuSTAR hard x-ray data and Gemini 3D spectra reveal powerful AGN and outflow histories in two low-redshift Lyman- blobs
Abstract
We have shown that Lyman- blobs (LABs) may still exist even at , about 7 billion years later than most other LABs known (Schirmer et al., 2016). Their luminous Ly and [O iii] emitters at offer new insights into the ionization mechanism. This paper focuses on the two X-ray brightest LABs at , SDSS J0113+0106 (J0113) and SDSS J11550147 (J1155), comparable in size and luminosity to ‘B1’, one of the best-studied LABs at 2. Our NuSTAR hard X-ray (3–30 keV) observations reveal powerful active galactic nuclei (AGN) with – erg s-1. J0113 also faded by a factor of between 2014 and 2016, emphasizing that variable AGN may cause apparent ionization deficits in LABs. Joint spectral analyses including Chandra data constrain column densities of cm-2 (J0113) and cm-2 (J1155). J0113 is likely buried in a torus with a narrow ionization cone, but ionizing radiation is also leaking in other directions as revealed by our Gemini/GMOS 3D spectroscopy. The latter shows a bipolar outflow over kpc, with a peculiar velocity profile that is best explained by AGN flickering. X-ray analysis of J1155 reveals a weakly absorbed AGN that may ionize over a wide solid angle, consistent with our 3D spectra. Extinction corrected [O iii] log-luminosities are high, . The velocity dispersions are low, – km s-1, even at the AGN positions. We argue that this is a combination of high extinction hiding the turbulent gas, and previous outflows that have cleared the escape paths for their successors.
Subject headings:
galaxies: active – galaxies: individual (SDSS J011341.11+010608.5, SDSS J115544.59014739.9) – X-rays: galaxiesI. INTRODUCTION
Lyman- blobs (LABs) are extended ( 20–200 kpc) nebulae with luminosities of erg s-1. They are commonly found at redshifts in overdense regions and proto-clusters (Matsuda et al., 2011; Erb et al., 2011), and have been associated with a broad range of galaxies hosting active galactic nuclei (AGN), star-burst sub-mm galaxies, and passively evolving red galaxies (e.g. Francis et al., 2001; Matsuda et al., 2004; Geach et al., 2009; Bridge et al., 2013). LABs are landmarks of massive galaxy formation (Geach et al., 2005; Matsuda et al., 2006; Prescott et al., 2008), and this understanding would greatly benefit from studying the physical conditions and ionizing sources in LABs.
This, however, is difficult for several reasons. First, Ly photons scatter resonantly in space and frequency (Meinköhn & Richling, 2002; Verhamme et al., 2006; Kollmeier et al., 2010), and non-resonant diagnostic lines such as [O iii] and H must be used to study the physical conditions in the gas. Second, any emission lines in high- LABs are faint because of severe cosmological surface brightness dimming (). Third, the lines may not be observable from the ground if their redshifted emission falls into the near-infrared atmospheric absorption bands. Fourth, the fraction of Ly photons that manage to escape is controlled by dust, neutral hydrogen, metallicity, and outflows (Ciardullo et al., 2014; Henry et al., 2015; Rivera-Thorsen et al., 2015; Yang et al., 2016), a process that is still poorly understood.
Many LABs lack evidence of ionizing continuum sources that would explain their high Ly luminosities. Three main ideas have been put forward to solve this mystery:
First, the ionizing sources are spatially distributed, i.e., Ly is created by other processes, such as shock heating by starburst driven superwinds (e.g. Taniguchi & Shioya, 2000), or gravitational cooling radiation of neutral hydrogen (‘cold accretion’, Haiman et al., 2000; Fardal et al., 2001; Nilsson et al., 2006; Rosdahl & Blaizot, 2012).
Second, the ionizing sources are hidden, in particular obscured powerful AGN (Basu-Zych & Scharf, 2004; Geach et al., 2009; Overzier et al., 2013; Prescott et al., 2015). It is difficult to distinguish between buried AGN and cold accretion (Prescott et al., 2015), and between cold accretion and scattering (Laursen & Sommer-Larsen, 2007; Trebitsch et al., 2016), because the same data can be interpreted differently. Also, Steidel et al. (2000) and Schirmer et al. (2016) caution against postulating the presence of obscured AGN when evidence for other mechanisms is absent.
Third, the ionizing sources (AGN) are variable, and thus not detectable at all times (Schirmer et al., 2016). Accordingly, during their quasar phases, the AGN fill the LABs with Ly photons; the latter are trapped because of resonant scattering and released only gradually. The observable Ly light curve is thus a very damped response to the AGN’s ionizing light curve (Roy et al., 2010; Xu et al., 2011). Effectively, the Ly and X-ray light curves are decorrelated. High Ly luminosities therefore do not require currently powerful AGN (Schirmer et al., 2016), because AGN spend most of the time in a low accretion state (Novak et al., 2011). This may explain many of the non-detections of AGN that were originally attributed to heavy obscuration.
The existence of LABs at low redshift would provide exciting targets because of high fluxes and the full availability of optical diagnostic emission lines. Previous searches for LABs at – using GALEX grism spectroscopy were unsuccessful (Keel et al., 2009; Wold et al., 2014), apart from one detection by Barger et al. (2012) of a less luminous LAB ( erg s-1) at . These were first strong indications that LABs must rapidly disappear from the Universe between and (see Figure 6 in Schirmer et al., 2016). Overzier et al. (2013) have predicted that a small number of low- LABs should still exist in low-density environments, mostly powered by AGN because cold accretion streams would have ceased. Indeed, in Schirmer et al. (2016) we have reported the discovery of rare, luminous LABs at by cross-correlating the most powerful [O iii] emitters of Schirmer et al. (2013) with archival GALEX far-UV images. Hubble Space Telescope (HST) far-UV images and spectra have been scheduled (PI: Schirmer, proposal ID #14749) to ultimately verify the Ly luminosities.
As predicted in Section 4.2 of Overzier et al. (2013), Schirmer et al. (2013) confirmed that these low- LABs are indeed powered by AGN from their high [O iii]/H line ratios. If a duty cycle of a luminous AGN phase is short as predicted by Novak et al. (2011), the majority of these AGN is likely to be weak. This idea corresponds to the third one raised previously. Hence, for the examination, we have analyzed the Chandra data, and found that the soft ( keV) X-ray luminosities are lower than expected (Schirmer et al., 2016). This apparently favors our hypothesis. However, due to the soft energy band and the poor photon statistics, the discussion highly depends on the assumed absorption correction. The AGN could simply be heavily obscured ( cm-2) rather than intrinsically weak. This has motivated us to conduct further X-ray observations at high energies to constrain the column densities and the current luminosities.
| Name | Observatory | ID | Date | Exp. | ||||
|---|---|---|---|---|---|---|---|---|
| (1) | (2) | (3) | (4) | (5) | (6) | (7) | (8) | (9) |
| SDSS J011341.11+010608.5 (catalog ) | 18.42129 | 1.10237 | 0.281 | 1.45 | NuSTAR | 60201054002 | 2016 July 01 | 21 |
| Chandra | 16102 | 2014 Jun 02 | 15 | |||||
| Swift | 00081905001 | 2016 Jun 30 | 1.6 | |||||
| Gemini/GMOS | GS-2016B-DD-4 | 2016 Nov 06 | 4.8 | |||||
| SDSS J115544.59014739.9 (catalog ) | 178.93580 | -1.79443 | 0.306 | 1.60 | NuSTAR | 60201055002 | 2016 Jun 07 | 20 |
| Chandra | 3140 | 2002 Dec 02 | 30 | |||||
| Swift | 00081906001 | 2016 Jun 05 | 1.9 | |||||
| Gemini/GMOS | GS-2014B-Q-63 | 2015 Mar 31 | 5.4 |
Note. — Columns: (1) Galaxy name. (2)-(3) Right Ascension and Declination in units of degree. (4) Redshift. (5) Luminosity distance in units of Gpc based on each redshift. (6) Observatory (7)-(9) Details for each observation (Obs. ID, Obs. date, and total exposure time in units of ksec).
NuSTAR is the most sensitive observatory to hard X-rays ( keV), which are less affected by obscuration. Strong constraints on the luminosity can be obtained even for Compton-thick AGN ( cm-2). Soft X-ray spectra of such AGN may be dominated by scattered and/or reflected components, and thus a joint spectral analysis of soft and hard X-ray data is required to accurately determine obscuration and luminosities. Using a pilot NuSTAR program, we observed the two Chandra brightest (and least likely faded) sources of Schirmer et al. (2016), SDSS J011341.11+010608.5 and SDSS J115544.59014739.9 (hereafter J0113 and J1155).
This paper is organized as follows. Section II presents an overview of our NuSTAR, Chandra, Swift, and Gemini observations. Details about the simultaneous analysis of the good quality NuSTAR and Chandra spectra and its results are found in Section III. Results from the optical 3D spectra are presented in Section IV. In Section V, we discuss the structures of the AGN, and the morphologies and kinematics of the extended emission line regions. We summarize and conclude in Section VI. Throughout this paper, we assume a CDM cosmology with km s-1 Mpc-1, and . Unless otherwise noted, all errors concerning the X-ray data are quoted at the 90% confidence level for a single parameter of interest; errors for the optical data are 67% confidence level.
II. OBSERVATIONS AND DATA REDUCTION
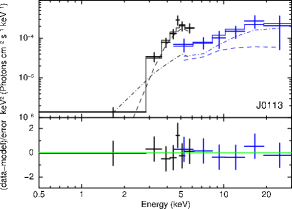
Table 1 summarizes the basic information of the two LABs and the details on their NuSTAR (Harrison et al., 2013), Chandra, and Swift observations. The NuSTAR observations were conducted in cycle 2 as a Guest Observatory program (PI: Schirmer), followed by the Swift observations with short exposures ( 1–2 ksec) as a service program. Also, Chandra observed J0113 (PI: Schirmer) and J1155 (PI: Coppi) in 2014 and 2002, respectively. We use the Swift/X-ray telescope (XRT; Gehrels et al., 2005) data reprocessed through the online tools provided by the UK Swift Science Data Centre (Evans et al., 2009)111http://www.swift.ac.uk/user_objects/. Due to the low signal-to-noise ratio of the Swift spectra (see Section II.3), we perform the detailed analysis only for the NuSTAR and Chandra spectra (Figure 1). XSPEC version 12.9.0.n (Award, 1996) is used for the spectral fitting.
The 3D Gemini/GMOS spectra are from a larger campaign targeting all 17 objects of Schirmer et al. (2016); details are given below.
II.1. NuSTAR Observations
NuSTAR carries two independent focal plane modules (FPMA and FPMB), sensitive in the 3–80 keV range. We reprocess the
event files using the standard nupipeline script as described in the “NuSTAR Analysis Quickstart Guide”
222http://www.srl.caltech.edu/NuSTAR_Public/NuSTAROperationSite
/SAA_Filtering/SAA_Filter.php
.
Our targets are faint ( cts s-1), and periods of high background (such as passages through or near the South Atlantic Anomaly (SAA)) must be excluded. Typical background rates observed with NuSTAR are 1 cts s-1, integrated over the focal plane (Forster et al., 2014). Times of high background can be identified by simultaneously increased count rates in the detectors as well as in the shields that surround the focal planes. Using the telemetry reports made by the NuSTAR team, we first check the total event rates during all orbital passages of our observations. In the J1155 observation, the event rate increases around the standard SAA area (above 30 cts s-1). We run nupipeline with the option saamode=optimized to reject times with high count rates in both the shields and detectors. High count rates may occasionally occur in the so-called tentacle region (Forster et al., 2014) near the SAA, and we exclude these times for J1155 by setting tentacle=yes. Background rates during the observation of J0113 are stable and low (saamode=none and tentacle=no).
The full width at half maximum (FWHM) of the NuSTAR point spread function is 20′′. The source spectra are extracted from circular regions with a radius of centered on the centroid of the counts. The background spectra are extracted from identical apertures, located in an off-source region on the same detector. To increase the signal-to-noise ratios, the FPMA and FPMB spectra are combined without renormalization due to lack of statistical power in the count rates using the addascaspec command in FTOOLS. J0113 and J1155 are significantly detected in the 3–30 keV band with a signal-to-noise ratio of 8 and 20, respectively.
II.2. Chandra Observations
The Chandra/ACIS data provide the soft energy band (0.5–10 keV) for the spectral analysis. The raw data are reprocessed by using the chandra_repro pipeline included in the Chandra Interactive Analysis of Observations (CIAO) software (version 4.8) and referring to the latest CALDB at the time (version 4.7.2). The typical angular resolution of Chandra/ACIS is . Our targets are barely resolved in the Chandra data, and no offsets are observed between the X-ray and [O iii] peak emission (see Schirmer et al., 2016, for details). The source spectra were extracted from a circular region with radius, centered on the Chandra detections. The background spectra are taken from similar off-source regions. Background correction is minimal, as the source count rates are times higher. Consequently, we detect J0113 and J1155 at the 11 and 23 levels, respectively, in the 0.5–10 keV band.
II.3. Swift Observations
We analyze the Swift/XRT spectra covering the soft energy band (0.3–10 keV). We find the low detection significances of 2.3 and 3.6 for J0113 and J1155, respectively. It is likely due to the low exposure and effective area. Thus, these spectra are ignored in the detailed broadband X-ray spectral analysis. Here, we only constrain the observed fluxes to confirm the consistency with those estimated from the NuSTAR spectra. The powerlaw model is fitted based on the -statistics appropriate to low-counts spectra instead of the chi-squared method. The 2–10 keV fluxes are found to be erg cm-2 s-1for J0113 and erg cm-2 s-1for J1155. They are in well agreement with those from the NuSTAR spectra (see Section III and Table 2).
II.4. Gemini/GMOS Observations
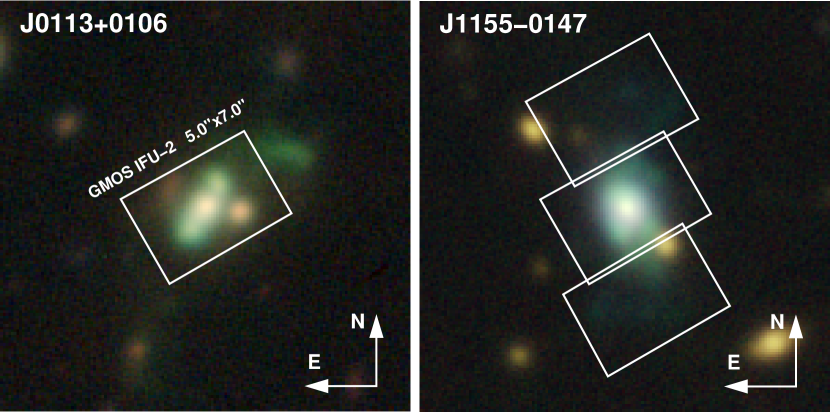
The 3D spectra were obtained using GMOS at the Gemini-South telescope in Chile, using the IFU-2 configuration. The 5070 field of view is sampled with 02 fibers, and corresponds to kpc at .
J0113 was observed on 2016 November 06 UT (Gemini program ID GS-2016B-DD-4) using s integrations in excellent seeing conditions (03–04); the physical resolution corresponds to 1.5 kpc at . The pointing was centered on the nucleus and contains the bulk of the flux including the two superbubbles (see Figure 2, left panel). The [O iii]5008 line was compromised by a bad detector column that had developed around the time of the observations. The [O iii]5008 line luminosity and principal velocity structures could be reconstructed from the weaker [O iii]4960 line because of the fixed [O iii]5008/4960 line ratio of 2.984 (Storey & Zeippen, 2000) and the good S/N ratio.
J1155 was observed on 2015 March 31 (GS-2014B-Q-63). Due to its large physical extent, three adjacent pointings were obtained with the IFU-2 (Figure 2, right panel), exposed for s each, in 07–08 seeing conditions. The physical resolution is 3.5 kpc.
The spectra were processed using Python/IRAF scripts333Equivalent to the example available from the Gemini data reduction forum:
drforum.gemini.edu/topic/gmos-ifu-data-reduction-example-2/
developed for GMOS IFU data. A detailed description of the reduction can be found in Davies et al. (2015) for SDSS J22400927, a low redshift LAB in our sample for which we have performed extensive emission line diagnostics.
The ionized gas kinematics were derived using the [O iii] emission lines. For J1155 both the [O iii]4960 and [O iii]5008 lines were used. For J0113, the brighter [O iii]5008 line from half the IFU field of view was projected on a bad detector column and lost, and therefore only the weaker line was used. For each spaxel, a constant continuum value was subtracted, and then each emission line was fit with a single Gaussian. If both lines were fit, then we used their fixed line ratio and required the same velocity and velocity dispersion.
III. Broadband X-ray Spectral Analysis
Using XSPEC, we simultaneously fit the Chandra and NuSTAR spectra, which cover the 0.5–10 keV and 3–30 keV bands, respectively. The Chandra and NuSTAR spectra are binned so that each bin contains at least 15 cts and 100 cts, respectively, driven by the typical background rates. Bins are excluded from the spectral analysis if the source signal is below significance. The cross-normalization factor between the Chandra and NuSTAR spectra is set to one. We confirm that even if the factor is allowed to vary within a typical uncertainty of 10% (Harrison et al., 2013), the fitting results as well as the conclusion do not change significantly.
Following previous work by Kawamuro et al. (2016), who systematically analyzed broadband X-ray spectra of moderately obscured (/cm = 22–24) AGN, we adopt a base-line model,
| (1) |
in units of photons keV-1 cm-2 s-1. Here, is the cross-section of photoelectric absorption at energy . Our model uses a cutoff power-law for the absorbed primary X-ray emission, , where is the photon index. The cutoff energy, , is difficult to constrain from the data, and thus fixed to 300 keV, a typical value measured in nearby AGN (Dadina, 2008). The normalization of the primary emission between the Chandra and NuSTAR spectra are not tied to each other, due to the possible time variability between the two observations. An un-absorbed cutoff power-law model () is also incorporated as scattered emission, where is the scattered fraction. The last two terms, and , represent the reflection continuum from distant, cold matter (Urry & Padovani, 1995, “torus”), and the accompanying fluorescence iron K line at 6.4 keV, respectively. The torus’ reflection component is represented using the pexrav model (Magdziarz & Zdziarski, 1995), which calculates reflected emission in an optically thick slab with a solid angle irradiated by a point source. That is, 2 corresponds to the extreme case where the nucleus is covered by the reflector in all directions. Initially, the incident flux into the reflector is assumed to be the same as the primary power-law component of the NuSTAR spectra. The inclination angle to the reflector is fixed at 60∘. We confirm that even for 30∘ the best-fit parameters do not change significantly. We assume that the reflected and scattered components did not vary between the Chandra and NuSTAR observations. The scattering/reflecting matter could be spatially distributed and extend to the pc scale. This suggests that even if the incident emission from the nucleus varies, the scattered/reflected emission does not change drastically because such matter smears the variability. The K line is described using the delta function (zgauss with the line width of 0 eV in XSPEC). This is because the poor photon statistics and the low instrumental energy resolution do not permit an estimate. The galactic absorption, , is calculated using the nh command in FTOOLS (Kalberla et al., 2005), and is applied to the total base-line model.
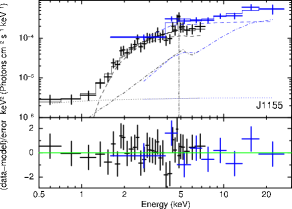
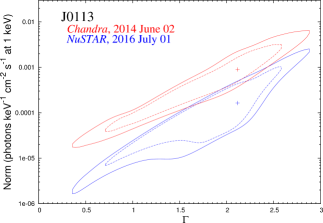
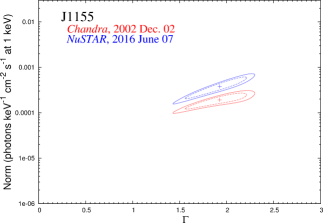
In the following subsections we describe the details of the spectral analysis. The unfolded spectra and best-fit models are shown in Figure 1. The best-fit parameters, observed fluxes, and primary power-law luminosities are listed in Table 2. To estimate luminosity errors, we make confidence contours between the normalization and photon index of the primary power-law component (Figure 3). Then, we derive the upper and lower boundaries by calculating all the possible luminosities along the contours at the 90% confidence level.
III.1. Notes on J0113
The base-line model fits the spectra with . The AGN in J0113 is heavily obscured with a hydrogen column density of cm-2, and we find . The K line and the scattered emission are insignificant, and their upper limits are constrained to be photons cm-2 s-1 ( erg cm-2 s-1) and %, respectively. The reflection strength is estimated to be . If we assume that the incident flux into the reflecting and scattering material is based on the primary X-ray emission in the Chandra spectrum (instead of NuSTAR), then and %. Due to the poor statistics, the best-fit parameters in both cases are consistent with each other.
From the confidence contours in Figure 3, the intrinsic luminosities during the Chandra and NuSTAR observations are and , respectively (90% confidence errors on the luminosities). This AGN has likely faded by one order of magnitude in two years.
III.2. Notes on J1155
The base-line model reproduces the spectra well with . We find and cm-2. The K line is detected at the 90 % confidence level with photons cm-2 s-1, or erg cm-2 s-1. This supports the existence of a torus. Although the spectra do not require the reflection continuum (pexrav) significantly as , this continuum emission should be taken into consideration to explain the K line in a self-consistent way. The scattered emission is significantly detected below 1 keV, and the scattering fraction is %. This falls within a typical range of obscured Seyfert galaxies (0.1–10 %; e.g., Kawamuro et al., 2016). Note that and with respect to the primary emission in the Chandra spectrum are and %, consistent with those derived above within uncertainties. Analogously to J0113, we find and for the epochs of the Chandra and NuSTAR observations, respectively. This AGN has brightened slightly between 2002 and 2016.
| (1) | Name | J0113 | J1155 |
|---|---|---|---|
| (2) | () | ||
| (3) | () | ||
| (4) | |||
| (5) | |||
| (6) | |||
| (7) | |||
| (8) | |||
| (9) | |||
| (10) | () | ||
| (11) | () | ||
| (12) | |||
| (13) | |||
| (14) | |||
| (15) | NuSTAR cts (src/bg) | ||
| (16) | Chandra cts (src/bg) |
Note. — Columns: (1) Galaxy name. (2) Galactic absorption in units of cm-2. (3) Intrinsic absorption in units of cm-2. (4) Photon index of the power-law component. (5)–(6) Photon fluxes in units of photons keV-1 cm-2 s-1 at 1 keV of the primary power-law component in the Chandra and NuSTAR spectra, (7) Scattered fraction in units of %. (8) Total photon flux in the zgauss model in units of total photons cm-2 s-1. (9) Reflection strength defined as in the pexrav model. (10)–(11) Observed fluxes in the 2–10 keV band in units of erg cm-2 s-1. (12)–(13) Intrinsic (primary power-law component) luminosities at the galaxy rest frame in the 2–10 keV band. (14) Reduced chi-squared over degrees of freedom. (15)–(16) Source and background counts in the NuSTAR 3–30 keV and Chandra 0.5–10 keV bands.
IV. Analysis of the optical 3D spectra
IV.1. J0113: [O iii] and H luminosities
J0113 extends over , featuring two prominent superbubbles at a projected distance of 5 kpc on either side of the nucleus. The bubbles have a diameter of 5–8 kpc, each. A further outflow is found 24 kpc (North-West) from the nucleus and measures 14 kpc. Judging from its -band brightness and the [O iii] equivalent line width of the central region, this outflow contributes –% to the total [O iii] luminosity, which we disregard in the further analysis. For more details see Figure 2 in this paper, and Appendix A4 in Schirmer et al. (2016).
The total [O iii]5008 flux in the IFU-2 data is erg cm-2 s-1, equivalent to an observed (reddened) luminosity of erg s-1. The archival spectrum from the Sloan Digital Sky Survey (SDSS) has a mean global H/H line ratio (Balmer decrement) of 4.4, indicative of significant dust extinction. Using a standard dust extinction curve (Cardelli et al., 1989; Osterbrock & Ferland, 2006), an intrinsic H/H line ratio of 3.0, we find for the dereddened luminosity. Likewise, we measure a corrected H line luminosity of . The 1 errors include the uncertainty of the flux calibration and allow for a relative uncertainty of 10% in the intrinsic H/H line ratio; the latter is subject to metallicity and hardness of the ionizing spectrum (Gaskell & Ferland, 1984). Possible variations of the internal dust extinction remained unaccounted for because we do not have resolved H maps at hand (for examples see Schirmer et al., 2013; Davies et al., 2015).
![[Uncaptioned image]](/html/1709.07018/assets/x6.png) Figure 4.—
Gas velocity (left), velocity dispersion (center) and line flux (right) for J0113
(top) and J1155 (bottom).
The line flux is also overplotted by the black contours
in the velocity and dispersion panels. J0113 is dominated by a bipolar outflow,
and a central cloud of rotating gas. The outflow axis and the rotation axis are
aligned. J1155 has a very concentrated line flux and drives a narrow outflow over
20 kpc, with constant radial velocity. The masking corresponds to approximately a
S/N cut of 5. Our IFU data are comparatively shallow; the gas in J0113 extends
well beyond the plot frame, and the gas in J1155 fills the frame.
Figure 4.—
Gas velocity (left), velocity dispersion (center) and line flux (right) for J0113
(top) and J1155 (bottom).
The line flux is also overplotted by the black contours
in the velocity and dispersion panels. J0113 is dominated by a bipolar outflow,
and a central cloud of rotating gas. The outflow axis and the rotation axis are
aligned. J1155 has a very concentrated line flux and drives a narrow outflow over
20 kpc, with constant radial velocity. The masking corresponds to approximately a
S/N cut of 5. Our IFU data are comparatively shallow; the gas in J0113 extends
well beyond the plot frame, and the gas in J1155 fills the frame.
IV.2. J0113: Gas kinematics
The kinematic maps in Figure 4 reveal a bipolar outflow. Relative radial velocities increase linearly from the nucleus to about 120 km s-1 at the position of both superbubbles at 5 kpc distance. The Northern superbubble is blue-shifted, and the Southern bubble redshifted. Velocities then continue to increase in the same fashion beyond the bubbles, exceeding 200 km s-1 at 10 kpc from the nucleus, where the S/N becomes too low for our analysis. The outflow does not appear to encounter significant mechanical resistance from the interstellar medium, and its motion is not yet governed by gravitation. The measured radial velocity is fairly low, suggesting that most of the motion happens perpendicular to our line-of-sight.
Another feature is that the gas South-West (North-East) of the nucleus is redshifted (blueshifted). This velocity gradient is perpendicular to the outflow and with a lower amplitude of about 70 km s-1. There is no indication of an outflow in this direction, and we interpret this as rotational motion of the central cloud of ionized gas.
The velocity dispersion is low (Figure 4, upper middle), and it is remarkable that the nucleus is not detectable in this map. We note a band of increased dispersion, – km s-1, that appears to gird the nucleus and the bipolar outflow near its equatorial plane. In the two superbubbles and beyond, the dispersion drops to km s-1, lower than in other outflow systems. We discuss these properties in Sections V.2.3 and V.2.4.
IV.3. J1155: [O iii] and H luminosities
J1155 has the highest X-ray flux in our sample. The optical nebula in the broadband images of Schirmer et al. (2016) extend over or more than 60 kpc, and fragments into numerous smaller clouds of 3–7 kpc diameter scattered around a very bright center measuring 5 kpc in diameter. For more details see Figure 2 in this paper, and Appendix A6 in Schirmer et al. (2016).
We have no spectrum yet of J1155 that includes the H line, and therefore we cannot determine a dereddened [O iii] luminosity. The observed total line flux including calibration errors is erg cm-2 s-1, corresponding to . If the Balmer decrement was a moderate 3.5, then and . If the Balmer decrement was as high as for J0113, then . For the rest of this paper we adopt the more conservative, lower luminosities associated with less extinction.
IV.4. J1155: Gas kinematics
J1155 has a very complex kinematic structure and [O iii] morphology. The line emission is strongly concentrated in the center of the galaxy, and with low velocity dispersion. Ionized gas extends out to kpc in these shallow IFU data, creating a patchy appearance and complex velocity and velocity dispersion maps. Particularly interesting is a long stream of gas connected to one side of the nucleus, stretching over 20 kpc and receding with a constant radial velocity of km s-1. The width of the stream is barely resolved in the data (Figure 4, lower left); the velocity dispersion is increased further away from the nucleus. The remainder of the surrounding gas appears to be passively illuminated by the AGN.
Like J0113, the velocity dispersion in J1155 is fairly low, between – km s-1 across the entire analysis area of kpc. The nucleus is also not detectable (Figure 4, lower middle).
V. Discussion
V.1. X-ray properties
V.1.1 Constraint on X-ray luminosity
Chandra is sensitive to soft energy X-ray photons in the – keV restframe for objects at . Hence, it is difficult to put a strong constraint on the intrinsic luminosity when the source is highly obscured. To show this fact, we derive luminosity errors in the case of that only the Chandra spectrum is available. As an example, we consider the J0113 case. We apply the same method as described in Section III to the error calculation except for allowing the absorbing column density to change up to in the fitting to avoid extreme case. The resultant lower and upper boundaries of the primary power-law luminosity become dex and dex. These uncertainties are larger than obtained with the simultaneous fitting to the NuSTAR and Chandra spectra (0.6 dex and 0.5 dex) possibly because the absorption column density is not well determined. This shows that the additional NuSTAR spectrum plays an important role to constrain the luminosity.
V.1.2 Narrow iron-K line
The narrow K line at 6.4 keV may originate from the torus around the nucleus, and was detected significantly only for J1155. Its equivalent width with respect to the reflection continuum is EW eV (EW eV for J0113). Here, only an uncertainty of the iron line flux is incorporated into the error calculation because the lower limit of the reflection strength is not constrained. The EWs are consistent with a numerical calculation of the reflected emission for optically thick, cold matter (1–2 keV; Matt et al., 1991). On the other hand, the EWs of J0113 against the total continuum observed with Chandra and NuSTAR are eV and eV, whereas those of J1155 are 210 eV and 130 eV, respectively. All observed EWs are consistent with those found in typical obscured AGN (e.g., Brightman & Nandra, 2011; Kawamuro et al., 2016). We conclude that our low- LABs and typical Seyfert galaxies may have the same origin of the K line.
V.1.3 Scattering fraction
We observe significant scattered emission (%) for J1155, which implies that J1155 is not heavily buried in the dust or gas obscuration. In comparison, heavily buried AGN (as suggested from their strong reflected emission) show rather low scattering fractions of (e.g. Ueda et al., 2007; Eguchi et al., 2009). We conclude that the emission from the nucleus in J1155 is relatively unobscured, and that the AGN contributes over a large solid angle to the ionization of the LAB.
By contrast, we cannot find significant scattered emission in J0113 ( %), suggesting the presence of a buried AGN and also a smaller contribution to the ionization.
V.2. Properties from the optical 3D spectra
V.2.1 Comparison samples
How are the galaxy-scale outflows in this study different from other systems with similar properties? Our targets were selected from SDSS-DR8 (Aihara et al., 2011) solely based on their broad-band photometry (excess of -band flux due to redshifted, very high [O iii] emission at ). We also applied a lower threshold on their radius to select objects with extended outflows. Both our targets are radio-quiet and ionized by type-2 AGN (Schirmer et al., 2013).
We compare with the 16 radio-quiet type-2 AGN of Harrison et al. (2014), selected from SDSS because of their high spectroscopic [O iii]5008 flux. Harrison et al. (2014) also required the presence of a broad [O iii] component. Typical redshifts are . Our other comparison sample is that of Liu et al. (2013), who selected 11 type-2 AGN with galaxy-scale outflows (at ) in SDSS based on high [O iii] fluxes. Liu et al. (2013) complement their sample with 3 radio-loud AGN to study the impact of jets on the outflow systems. Like us, Harrison et al. (2014) and Liu et al. (2013) used Gemini/GMOS to obtain the 3D spectra, in comparable seeing conditions. The depth of the spectra are approximately similar to ours of J0113. Our data of J1155 is much shallower though, by about a factor in effective exposure time (short integrations; full moon, compared to dark sky conditions for the comparison data).
V.2.2 Ionized gas mass
We derived H logarithmic line luminosities of 42.9 and 42.5 for J0113 and J1155, respectively (Sections IV.1 and IV.3). Assuming the gas is purely photoionized, the gas mass associated with the H emission is estimated as
| (2) |
where is the emission per unit volume, the electron number density and the proton mass. Taking from Osterbrock & Ferland (2006) (their table 4.4; see also Storey & Sochi, 2015) for K and cm-3, we rewrite
| (3) |
Individual measurements of , derived from the [S ii]6719,33 line ratio, yield several 100 cm-3 in the inner regions of narrow-line regions (see e.g. Nesvadba et al., 2006; Davies et al., 2015). Using line ratios which are sensitive at higher densities, () cm-3 were found for the narrow (broad) lines of another luminous quasar (Holt et al., 2011). In the outskirts, densities drop below 100 cm-3, where the outflows have thinned and are difficult to detect (and where line ratio methods break down because the collision effects diminish). Our spectrum of J0113 does not include the [S ii] doublet; however, there is an SDSS spectrum taken with a 3′′ fiber centered on the nucleus, including the flux from the nucleus and most of the superbubbles. Fitting the [S ii] doublet with a simple double Gaussian with identical line widths, we derive a line ratio of 1.24, i.e., a mean cm-3. We expect the actual electron densities to deviate significantly from this number, because outflows are known to be clumpy (Nesvadba et al., 2006; Greene et al., 2011; Davies et al., 2015).
Using eq. (3), we find and for J0113 and J1155, respectively, for a fixed value of cm-3. This is near the upper end of the gas masses of – found by Harrison et al. (2014), using the same density normalization. The outflows of Liu et al. (2013) entrain higher masses, – (again for cm-3).
We note that Harrison et al. (2014) and Liu et al. (2013) have a numeric prefactor that is erroneously about a factor 4 too high compared to ours in eq. (3). This is caused by an incorrect calculation of the recombination coefficient in eq. (1) of Nesvadba et al. (2006) (N. Nesvadba, private communication). Taking this into account, the ionized gas masses of J0113 and J1155 are among the highest measured in type-2 AGN at .
V.2.3 Gas velocities
Assuming a typical, true outflow velocity of 1000 km s-1 for the [O iii] gas (Harrison et al., 2014), it would take the two superbubbles in J0113 at least years to reach their observed positions. However, a sustained high AGN output over such a long time is implausible, as single AGN duty cycles are expected to be comparatively short ( yr; e.g., Schawinski et al., 2010; Schawinski et al., 2015; Sun et al., 2017) and followed by longer low states.
What happens with such an outflow during the low states of the AGN? King et al. (2011) calculate the internal properties of outflows and their dynamics. They find that the thermal energy contained in an energy-driven outflow can support its expansion for periods 10 times longer than the actual quasar phase that launched the outflow. However, their numerical results do not show that the velocity in such a stream is increasing over kpc-scales from the nucleus, as we observe in J0113. In a more recent work, Zubovas & King (2016) study the evolution of outflows taking into account recurrent AGN duty cycles lasting years. In these calculations, the recurrent duty cycles manage to accelerate existing outflows after about years, and out to radii larger than 10 kpc. Zubovas & King (2016) also find that the AGN should switch off once sufficient energy has been injected to unbind all gas; this is not (yet) the case in J0113 as our X-ray observations still reveal a very powerful AGN (one that has albeit likely faded in the last two years). Other processes could also explain the apparent acceleration. J0113 is weakly detected in the radio VLA FIRST survey (1.18 mJy; Schirmer et al., 2013), suggesting that a former radio jet could have played a role in shaping the current velocity profile. However, the survey’s spatial resolution and depth (White et al., 1997) are insufficient for further conclusions. Alternatively, differential velocities in the stream could be at play (faster components reach further in the same amount of time). However, Liu et al. (2013) argue that in this case the velocity dispersion should increase as well with increasing distance, yet we observe a decrease in dispersion. We conclude that with the current data at hand, recurrent outflows are the best explanation for the peculiar velocity profile in the outflow of J0113.
Faucher-Giguère & Quataert (2012) have shown that an outflow preferentially breaks out from a denser disk or sphere along paths of least resistance. The hot buoyant gas would then inflate the bubbles, and bipolar systems should be produced eventually by many powerful AGN. J0113 seems prototypical in this respect; we condense our observational results in a simplistic graphical representation in Figure 5.
J1155, on the other hand, could not be more different. While we do trace a 20 kpc long linear feature of enhanced recession velocity (Figure 4, lower left), it is not particularly present in the line flux map (Figure 4, lower right). The [O iii] nebula fragments into numerous blobs at all azimuthal angles around the AGN, which do not appear to be connected to any currently active outflow, nor to any of the member galaxies of the small group that hosts J1155 in its center (see also Section V.2.4 and Figure 2). We think that J1155 represents a more advanced stage, where the ejected materials from various duty cycles have accumulated in the halo, but have not yet fully dispersed. Currently, J1155 experiences another powerful accretion event, as indicated by the very high central [OIII] surface brightness and its high X-ray luminosity.
V.2.4 Velocity dispersion
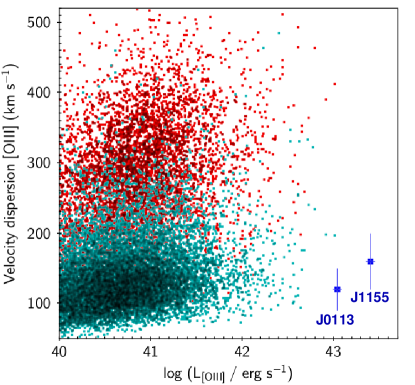
What comes to attention with our IFU data are the fairly low velocity dispersions in both systems, in particular for their nuclei (see Figure 4). Near the center of J0113 we observe – km s-1, and for the two superbubbles and beyond the dispersion drops to km s-1 and below. For J1155, we observe a mean dispersion of 160 km s-1. In Figure 6 we compare our targets against the type-2 sample of Mullaney et al. (2013). We recall that our data of J1155 are shallow, and therefore any broad components in the outskirts of this nebula would remain undetected; consequently, we would underestimate its line FWHM.
The low velocity dispersions show that the gas is little turbulent, in particular for J0113. There, it is flowing away from the AGN in a radial fashion, probably still pushed by recurrent duty cycles and its internal thermal energy. If powerful earlier outflows have “cleared” the escape path already, then the current stream would find less resistance and thus be less turbulent. Indeed, our imaging data show the presence of older outflows that must have traveled along the same paths.
Liu et al. (2013) find high (– km s-1) velocity dispersions in the inner – kpc of their sample, which in about half of the cases drop to – km s-1 at – kpc distance. Like us, they argue that recurrent outflows could have cleared the escape path. Additionally, Liu et al. (2013) explain that the narrow opening angle of the outflow (once it managed to break out) would leave less space for projected velocities, naturally decreasing the observed velocity dispersions. A noticeable difference between their and our data is that J0113 and J1155 have low velocity dispersions everywhere, even near the nucleus (our data of J0113 has a physical resolution of 1.5 kpc). Perhaps the more turbulent central components are simply hidden by dust. The enhanced Balmer decrement of 4.4 (integrated over 15 kpc by the SDSS fiber) shows that at least some part of the ionized gas must be severely affected by absorption, which goes in line with the high column density of cm-2(J0113).
J1155 also reveals a rather low velocity dispersion, about 160 km s-1 averaged over our IFU data. Hardly any of its numerous extended features appear to be connected to actively driven outflows. This material was probably ejected during several AGN bursts in the past, and is now passively ionized by the AGN. A notable environmental difference with respect to J0113 is that J1155 is not isolated, but located at the center of a small galaxy group with . Schirmer et al. (2016) speculated that the unusual morphology of this system could be due to interaction with infalling gas from an intragroup medium (undetected in X-rays). Alternatively, the surrounding inner material could have a lower filling factor, offering more escape paths for any buoyant hot gas. That would also be consistent with the lower absorbing X-ray column density.
V.3. Comparison with the high- LAB ‘B1’
One of the best-studied (and most luminous) LABs is SDSS J21434423 (also known as ‘B1’, ). Its Ly emission extends over kpc (Francis et al., 2001), and Palunas et al. (2004) report a Ly line flux of erg cm-2 s-1, or log. Overzier et al. (2013) measure a dereddened [O iii] luminosity of log–, subject to uncertain extinction correction. The optical nebula extends over kpc. The [O iii] line FWHM within 10 kpc of the nucleus is – km s-1, and drops to 200 km s-1 beyond 10 kpc (similar to many of the targets studied by Liu et al., 2013). The radial gas velocities in B1 are low, mostly within km s-1, and the [O iii] line flux is strongly concentrated. Any substantial bulk motions must happen perpendicular to the line of sight. Overzier et al. (2013) argue that B1 is powered by an AGN that is undetected in X-rays.
Apart from the high velocity dispersion, B1 seems quite similar to J1155. Both show a high concentration of the line flux, surrounded by a very extended ( kpc) disk of much lower surface brightness with somewhat patchy structure. The [O iii] luminosities are comparable, and J1155 is about twice as large (judging from our deep imaging data). Its Ly luminosity estimated from GALEX far-UV data (Schirmer et al., 2016) is the same as that of B1. The diameter of the Ly emission of J1155, and the accurate Ly luminosity, are subject of our currently active HST proposal. J0113 has similar luminosity and extent as J1155, but its estimated Ly luminosity is three times lower than that of B1.
We conclude that the recently discovered low- LABs match high- LABs in terms of luminosity and physical extent. Like B1, our targets host powerful AGN. At this point it is too early to speculate about the morphological similarities between B1 and J1155. While the formation of J0113 with its characteristic bipolar outflow and other signs of historic accretion events is quite clear cut (see Faucher-Giguère & Quataert, 2012; Zubovas & King, 2016), the formation and current state of J1155 remains unclear and requires further observations (in particular optical line diagnostics and deeper data).
V.4. [O iii] morphologies and AGN flickering
There is increasing evidence for AGN flickering (duty cycles lasting years, amplitudes of orders of magnitude), obtained by the identification of ionization echoes (e.g. Schawinski et al., 2010; Schirmer et al., 2016; Ichikawa et al., 2016; Keel et al., 2017), by means of statistical arguments and outflow rates (e.g. Schawinski et al., 2015; Sun et al., 2017), the transverse proximity effect in the Ly forest (Kirkman & Tytler, 2008, albeit on longer scales of years), and also on the theoretical side (e.g. Hopkins & Quataert, 2010; Novak et al., 2011; Sijacki et al., 2015; Zubovas & King, 2016).
The typical time scales of AGN flickering are on the same order as the light crossing times of galaxy-scale outflows extending over 10 kpc and more. The optical appearance of these extended narrow-line regions is invariable over a human life time given their kinematic time-scale of Myrs, and the limited physical resolution of current instrumentation. However, because of their large extent, these nebulae reflect the recent history of the AGN, and this affects how we interpret their observed morphologies.
First of all, the effective recombination time scale for the O++ ion is very short. Using the calculations of (Binette & Robinson, 1987),
| (4) |
Accordingly, the response of the [O iii] line to a change in ionizing radiation can be considered instantaneous for observations with a physical resolution of kpc. An outward propagating wave of ionizing radiation (or a shut-down thereof) would alter the nebulae’s surface brightness.
Secondly, we know from the Changing Look quasars (LaMassa et al., 2015; MacLeod et al., 2016; Runnoe et al., 2016) that AGN may change their line-of-sight obscurations on scales of years, affecting an ionization cone’s opening angle (e.g. due to intervening dust, structural changes in the torus in response to a change of bolometric luminosity). Spin precession of the SMBH accretion disk happens on scales of years (Lu & Zhou, 2005) and may cause illumination (ionization) patterns on a screen of gas extending over 10s of kpc.
Lastly, absence of line emission in some area does not imply absence of gas. These areas could be shielded from ionization by intervening dust. In turn, absence of line emission does not mean that there is no ionizing radiation; and AGN may well shine into empty volumes.
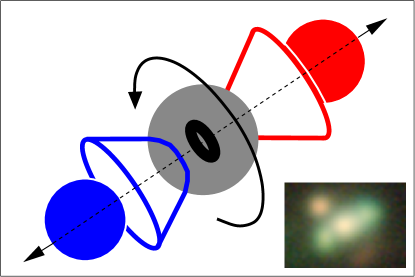
It is tempting to link the optical morphologies from our IFU data with the structural parameters of the central AGN derived from our X-ray analysis. Indeed, the consistencies are remarkable. From the X-ray data of J0113 we infer an AGN that is buried in a torus with a small opening angle. Accordingly, this AGN is able to photoionize gas within a relatively narrow ionization cone, only, matching the collimated bipolar outflow. However, the highest surface brightness of the line emission is located in the central – kpc (upper right in Figure 4), showing that ionizing radiation can leak into other directions, too. In J1155, we find a weakly obscured AGN capable of ionizing gas over a wide solid angle, consistent with the optical nebula ionized at all azimuthal angles. However, our sample is highly limited (two), and as we cautioned above, the observable nebular morphologies are subject to outflow histories, and variabilities in obscuration, luminosity, and illumination direction.
V.5. Using scaling relations to test for long-term variability
Two possible explanations for the ionization deficits in LABs are deeply buried AGN, and time variable (faded) AGN (see Section I). Our previous analysis of individual sources in Schirmer et al. (2016) was limited by poor knowledge of their X-ray obscurations. We could argue in favor of faded AGN for the sample as a whole, but not for individual sources. This limitation is overcome with hard X-ray ( 10 keV) data.
Currently, powerful ( erg s-1) and Compton-thin AGN exist in both J0113 and J1155 (Section III). To test for recent, long-term variability, we compare their X-ray luminosities against other proxies of AGN power that retain some memory of the AGNs’ past. These proxies are mid-infrared (MIR) emission from circum-nuclear dust, and [O iii] emission from the extended ionized gas. The built-in ‘response’ times of these ’echo screens’ are caused by light-travel time from the nucleus, their intrinsic physical properties, and also their orientation along the line-of-sight (a response from the parts located closer to us would arrive sooner at our telescopes). In the following, we check whether these proxies bear any signs for substantial variability in both AGN over the last years.
V.5.1 The mid-infrared X-ray relation
Numerous studies have established a tight correlation between the MIR and X-ray luminosities in X-ray selected AGN; radiation from the central engine heats the dusty torus, which subsequently emits thermal radiation. This correlation is independent of AGN classifications (type-1/2, Compton thickness; see e.g. Gandhi et al., 2009; Ichikawa et al., 2012, 2017; Asmus et al., 2011, 2015). Rapid and prolonged fading of AGN, however, would move an individual AGN off the MIR X-ray correlation. Hönig & Kishimoto (2011) simulated the MIR response of a dusty torus to a finite pulse from the AGN, as a function of the torus’ structural parameters. Ichikawa & Tazaki (2017) also estimated the typical cooling timescale of the dusty torus once the AGN is suddenly quenched and even considered the dust heating with the energy exchange by the gas. Accordingly, the thermal response of a torus may have decay times of 10–1000 years, depending on its thickness, and in addition to the time lag caused by the light travel time from the nucleus to the sublimation radius. We have presented observational data supporting such thermal echoes in Schirmer et al. (2016), pending confirmation by accurately measuring the X-ray obscurations.
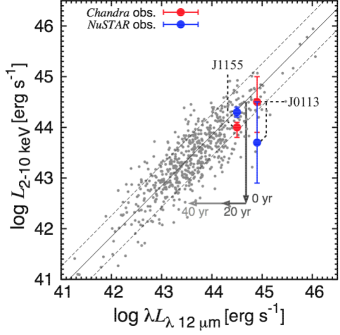
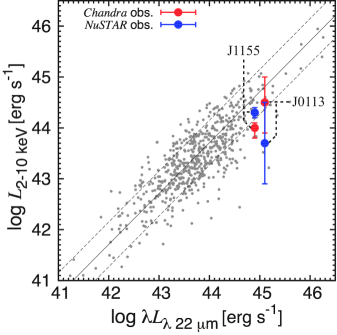
Figure 7 shows scatter plots of the absorption corrected 2–10 keV luminosity versus MIR (12 m and 22 m) luminosity for the hard X-ray selected AGN of Ichikawa et al. (2017, gray dots). This is one of the most complete samples to date for the hard X-ray selected AGN. To make the plots, we converted the 14–195 keV luminosities to the 2–10 keV band, using a photon index of (i.e., ). The data for J0113 and J1155 are also shown, using their WISE W3 and W4 band fluxes (Wright et al., 2010) to estimate the 12 m and 22 m luminosities, respectively. The data for J1155 put it within the scattering of the reference sample. The NuSTAR observations of J0113 taken in 2016, however, deviate by one order of magnitude from the best-fit correlation, whereas its Chandra data taken in 2014 are in much better agreement with the reference sample. This illustrates the effect of rapid X-ray fading on this plot. Because dusty tori typically have pc-scales and delayed intrinsic response times (Hönig & Kishimoto, 2011; Ichikawa & Tazaki, 2017), the MIR flux of J0113 is not expected to change much just yet (and we used the single WISE measurement from 2010). Sparse long-term MIR monitoring of J0113 is worth-while, in particular if the X-ray flux continues to fade.
Since both AGN are still within the general scatter, we cannot infer long-term time (– yr) variability from the MIR X-ray relation. Note that we initially proposed seven targets to be observed with NuSTAR, covering a large range of Chandra fluxes. Only J0113 and J1155 were approved, because they are by far the X-ray brightest, maximizing chances for appreciable NuSTAR count rates. Therefore, highly significant deviations from the MIR X-ray scaling relation are not expected for these two targets, but could be present for the X-ray fainter LABs in our sample.
For clarity, we illustrate the simplified time evolution (arrows) after AGN quenching in the left panel of Figure 7. For this, we adopt an instantaneous decline by two orders of magnitude, supported by observational and theoretical data alike (Schawinski et al., 2010; Novak et al., 2011; Schirmer et al., 2016). The X-ray luminosity before the quenching is set to , the maximum luminosity we observe for J0113 and J1155. The 12 m luminosity is estimated using the third equation in Table 3 of Ichikawa et al. (2017) for luminous AGN (). Applying eq. (21) by Marconi et al. (2004) we derive the bolometric corrections for the 2–10 keV band, and then use Figure 3 of Ichikawa & Tazaki (2017) to estimate the cooling times. Note that Ichikawa & Tazaki (2017) assume a sudden and complete AGN shut down, whereas in reality it could take the AGN much longer to move back onto the general MIR X-ray correlation (depending on the radial dependence of the dust density Hönig & Kishimoto, 2011).
V.5.2 Negligible effect from MIR emission lines
Particularly the W3 band, covering 7.5–17 m444http://www.astro.ucla.edu/~wright/WISE/passbands.html, contains several emission lines (e.g., polyclyclic aromatic hydrocarbon, [Si iv] 10.5 m and [Ne ii] 12.8 m) from the more extended ( 100 pc) star-forming and narrow-line regions than that of the torus ( 10 pc). These could contribute to the observed MIR flux, potentially diluting the expected MIR response from the dusty torus to a change in AGN luminosity. We can probe for this effect considering the X-ray MIR correlations obtained using low and high spatial resolution observations: If the emission lines are bright, then the observed MIR flux would increase systematically with lower resolution, as more emission line flux is included from a larger volume around the AGN. However, this trend is not found when comparing the high-resolution study of Asmus et al. (2015) with the low-resolution study of Ichikawa et al. (2017) (see Figure 3 of Ichikawa et al. 2017). We conclude that the emission lines do not alter the MIR fluxes significantly.
Even if the W3 band was highly contaminated, one could still use the W4 band ( 20–26 m), which is less affected. The [O iv] line at 25.89 m, which is a bright line in AGN spectra (Treyer et al., 2010), is lower than the X-ray / MIR luminosities by two orders of magnitude (e.g., Liu et al., 2014; Kawamuro et al., 2016). Unless the AGN and their kpc-scale surroundings in our low- LABs are very different from typical AGN, MIR emission lines are not expected to skew the MIR X-ray scaling relations.
V.6. The [O iii] X-ray relation
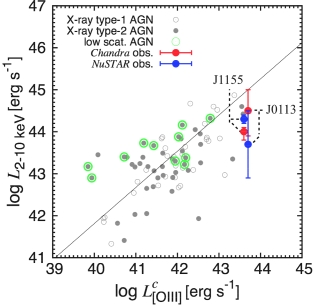
[O iii] emission is another proxy commonly used to infer AGN power (e.g., Mulchaey et al., 1994). A typical [O iii] nebular size observed in local Seyfert galaxies can reach several kpc (e.g., Schmitt et al., 2003; Bennert et al., 2006). In Figure 8, we compare our LABs with local AGN detected in the Swift/BAT 9-month catalog (Ueda et al., 2015). Both LABs have lower X-ray luminosities at a given [O iii] luminosity than predicted from the average properties of the Swift/BAT sample, yet not at a level that would distinguish them as fading. The apparently high [O iii] luminosity could simply be a fact of our selection (targetting optically over-luminous nebulae), and that our type of targets is not included in the commonly used SDSS AGN catalogs (the latter are incomplete concerning extreme sources, see Schirmer et al., 2013; Baron & Poznanski, 2017). Nonetheless, for J0113 we know that it has been fading for the last two years. In addition, Ueda et al. (2015) report a lower [O iii] to X-ray luminosity ratio on average for low scattering fraction AGN (%; green circles in Figure 8), to which J0113 belongs. J0113 is 10–50 times more luminous in [O iii] than other low scattering AGN. This could simply be a consequence of poor statistics at the high luminosity end, or a consequence of variability (the [O iii] X-ray relation decorrelates more easily than the MIR relation under AGN flickering due to the slower [O iii] response). We conclude that, for our particular two targets, the [O iii] X-ray relation does not bear conclusive evidence for AGN flickering.
VI. Summary
Using 20 ksec NuSTAR observations, we probed the hard X-ray emission of two recently discovered (Schirmer et al., 2016) low- LABs, J0113 and J1155. We detect them in the observed 3–30 keV band on the and level, respectively. Adding Chandra archival data, we performed a broadband X-ray spectral analysis of the 0.5–30 keV band. The spectra were well reproduced with a base-line model consisting of an absorbed cut-off power-law, reflection components from distant, cold matter, and scattered emission. This is the most detailed X-ray analysis of AGN in any LABs published to date. It also shows that with NuSTAR one can strongly constrain the primary X-ray luminosity.
For J1155, we find a moderate scattering fraction of %. This shows that the AGN is not deeply buried in a torus, whose existence is suggested by the detection of the iron-K line. The obscuration is moderate with cm. Hence, the AGN emission can indeed ionize the narrow line region that extends out to a radius of kpc, over a wide opening angle. AGN ionization of the gas is required by its high [O iii]/H line ratio (Schirmer et al., 2013).
Regarding J0113, the torus may be highly developed. It reduces the scattering gas as inferred from the undetected scattered emission (upper limit %) as well as from the high column density (cm). This is consistent with the collimated bipolar outflow seen in the optical [O iii] emission. However, the central – kpc also have high [O iii] surface brightness, showing that ionizing radiation can leak out in other directions as well.
Our optical 3D spectroscopy with Gemini/GMOS (and imaging data from our previous work by Schirmer et al., 2016) reveals two very different systems. For J0113 we find multiple evidence for recurrent powerful outflow events over several 10 million years. The prominent bipolar outflow in J0113 is accelerating, as gas velocities increase with distance from the nucleus. This behaviour is best explained by AGN flickering (Zubovas & King, 2016). J0113 is a prototypical example of the outflow formation process suggested by Faucher-Giguère & Quataert (2012), where hot buoyant gas breaks out along paths of least resistance, inflating kpc-scale superbubbles. The extended narrow-line region around J1155, on the other hand, reveals a very different morphology. It is more consistent with an advanced stage, where the remnants of multiple outflows are dispersing in the halo, passively illuminated/ionized by a current powerful accretion event. Deeper 3D spectra taken over a larger area, and covering more diagnostic emission lines, would allow us to better constrain the gas physics and formation histories of these two distinguished targets.
Common to both systems are low velocity dispersions of – km s-1. In particular, the AGN themselves are not detectable in the line width maps. In case of J0113, severe dust extinction could be hiding more turbulent gas closer to the nucleus. Also, previous outflows could have cleared the escape paths for the current streams, reducing mechanical resistance and thus turbulence.
In terms of [O iii] extent and luminosity, we find our low- LABs indistinguishable from high- LABs. J1155, in particular, resembles one of the best studied LABs (B1, see e.g., Francis et al., 2001; Palunas et al., 2004; Overzier et al., 2013) in many other respects, hosting a powerful AGN.
J0113 and J1155 fall within the intrinsic scatter of the MIR X-ray luminosity correlation, as well as within the [O iii]-to-X-ray relation of the hard X-ray selected AGN (Ichikawa et al., 2017). J0113 has faded by a factor 5 over two years of time between our Chandra and NuSTAR observations, but not enough to distinguish it with respect to the other AGN in these relations. It is worthwhile to monitor the MIR emission of J0113, roughly on a yearly basis, in particular if the X-ray luminosity continues fading. This would bear clues about the size and structure of its obscuring dusty torus, and the effect of long-term AGN variability on the intrinsic scatter of the MIR X-ray relation.
Our targets are among the most luminous [O iii] emitters in
the Universe, and at they are easy targets for follow-up studies.
References
- Aihara et al. (2011) Aihara, H., Allende Prieto, C., An, D., et al. 2011, ApJS, 193, 29
- Award (1996) Arnaud, K. A. 1996, in Astronomical Society of the Pacific Conference Series, Vol. 101, Astronomical Data Analysis Software and Systems V, ed. G. H. Jacoby & J. Barnes, 17
- Asmus et al. (2011) Asmus, D., Gandhi, P., Smette, A., Hönig, S. F., & Duschl, W. J. 2011, A&A, 536, A36
- Asmus et al. (2015) Asmus, D., Gandhi, P., Hönig, S. F., Smette, A., & Duschl, W. J. 2015, MNRAS, 454, 766
- Barger et al. (2012) Barger, A. J., Cowie, L. L., & Wold, I. G. B. 2012, ApJ, 749, 106
- Baron & Poznanski (2017) Baron, D., & Poznanski, D. 2017, MNRAS, 465, 4530
- Basu-Zych & Scharf (2004) Basu-Zych, A., & Scharf, C. 2004, ApJ, 615, L85
- Bennert et al. (2006) Bennert, N., Jungwiert, B., Komossa, S., Haas, M., & Chini, R. 2006, A&A, 459, 55
- Binette & Robinson (1987) Binette, L., & Robinson, A. 1987, A&A, 177, 11
- Bridge et al. (2013) Bridge, C. R., Blain, A., Borys, C. J. K., et al. 2013, ApJ, 769, 91
- Brightman & Nandra (2011) Brightman, M., & Nandra, K. 2011, MNRAS, 413, 1206
- Cardelli et al. (1989) Cardelli, J. A., Clayton, G. C., & Mathis, J. S. 1989, ApJ, 345, 245
- Ciardullo et al. (2014) Ciardullo, R., Zeimann, G. R., Gronwall, C., et al. 2014, ApJ, 796, 64
- Dadina (2008) Dadina, M. 2008, A&A, 485, 417
- Davies et al. (2015) Davies, R. L., Schirmer, M., & Turner, J. E. H. 2015, MNRAS, 449, 1731
- Eguchi et al. (2009) Eguchi, S., Ueda, Y., Terashima, Y., Mushotzky, R., & Tueller, J. 2009, ApJ, 696, 1657
- Erb et al. (2011) Erb, D. K., Bogosavljević, M., & Steidel, C. C. 2011, ApJ, 740, L31
- Evans et al. (2009) Evans, P. A., Beardmore, A. P., Page, K. L., et al. 2009, MNRAS, 397, 1177
- Fardal et al. (2001) Fardal, M. A., Katz, N., Gardner, J. P., et al. 2001, ApJ, 562, 605
- Faucher-Giguère & Quataert (2012) Faucher-Giguère, C.-A., & Quataert, E. 2012, MNRAS, 425, 605
- Forster et al. (2014) Forster, K., Harrison, F. A., Dodd, S. R., et al. 2014, Proc. SPIE, 9149, 91490R
- Francis et al. (2001) Francis, P. J., Williger, G. M., Collins, N. R., et al. 2001, ApJ, 554, 1001
- Gandhi et al. (2009) Gandhi, P., Horst, H., Smette, A., et al. 2009, A&A, 502, 457
- Gaskell & Ferland (1984) Gaskell, C. M., & Ferland, G. J. 1984, PASP, 96, 393
- Geach et al. (2005) Geach, J. E., Matsuda, Y., Smail, I., et al. 2005, MNRAS, 363, 1398
- Geach et al. (2009) Geach, J. E., Alexander, D. M., Lehmer, B. D., et al. 2009, ApJ, 700, 1
- Gehrels et al. (2005) Gehrels, N., Chincarini, G., Giommi, P., et al. 2005, ApJ, 621, 558
- Greene et al. (2011) Greene, J. E., Zakamska, N. L., Ho, L. C., & Barth, A. J. 2011, ApJ, 732, 9
- Haiman et al. (2000) Haiman, Z., Spaans, M., & Quataert, E. 2000, ApJ, 537, L5
- Harrison et al. (2013) Harrison, F. A., Craig, W. W., Christensen, F. E., et al. 2013, ApJ, 770, 103
- Harrison et al. (2014) Harrison, C. M., Alexander, D. M., Mullaney, J. R., & Swinbank, A. M. 2014, MNRAS, 441, 3306
- Henry et al. (2015) Henry, A., Scarlata, C., Martin, C. L., & Erb, D. 2015, ApJ, 809, 19
- Holt et al. (2011) Holt, J., Tadhunter, C. N., Morganti, R., & Emonts, B. H. C. 2011, MNRAS, 410, 1527
- Hönig & Kishimoto (2011) Hönig, S. F., & Kishimoto, M. 2011, A&A, 534, A121
- Hopkins & Quataert (2010) Hopkins, P. F. & Quataert, E. 2010, MNRAS, 407, 1529
- Ichikawa et al. (2012) Ichikawa, K., Ueda, Y., Terashima, Y., et al. 2012, ApJ, 754, 45
- Ichikawa et al. (2016) Ichikawa, K., Ueda, J., Shidatsu, M., Kawamuro, T., & Matsuoka, K. 2016, PASJ, 68, 9
- Ichikawa et al. (2017) Ichikawa, K., Ricci, C., Ueda, Y., et al. 2017, ApJ, 835, 74
- Ichikawa & Tazaki (2017) Ichikawa, K., & Tazaki, R. 2017, ApJ, 844, 21
- Kalberla et al. (2005) Kalberla, P. M. W., Burton, W. B., Hartmann, D., et al. 2005, A&A, 440, 775
- Kawamuro et al. (2016) Kawamuro, T., Ueda, Y., Tazaki, F., Ricci, C., & Terashima, Y. 2016, ApJS, 225, 14
- Keel et al. (2009) Keel, W. C., White, III, R. E., Chapman, S., & Windhorst, R. A. 2009, AJ, 138, 986
- Keel et al. (2017) Keel, W. C. , Lintott, C. J. , Maksym, W. P., Bennert, V. N., Chojnowski, S. D., Moiseev, A., Smirnova, A., Schawinski, K., Sartori, L. F., Urry, C. M., Pancoast, A., Schirmer, M., Scott, B., Showley, C., & Flatland, K. 2017, ApJ, 835, 256
- King et al. (2011) King, A. R., Zubovas, K., & Power, C. 2011, MNRAS, 415, L6
- Kirkman & Tytler (2008) Kirkman, D., & Tytler, D. 2008, MNRAS, 391, 1457
- Kollmeier et al. (2010) Kollmeier, J. A., Zheng, Z., Davé, R., et al. 2010, ApJ, 708, 1048
- LaMassa et al. (2015) LaMassa, S. M., Cales, S., Moran, E. C., et al. 2015, ApJ, 800, 144
- Laursen & Sommer-Larsen (2007) Laursen, P. & Sommer-Larsen, J. 2007, ApJ, 657, L69
- Liu et al. (2013) Liu, G., Zakamska, N. L., Greene, J. E., Nesvadba, N. P. H., & Liu, X. 2013, MNRAS, 436, 2576
- Liu et al. (2014) Liu, T., Wang, J.-X., Yang, H., Zhu, F.-F., & Zhou, Y.-Y. 2014, ApJ, 783, 106
- Lu & Zhou (2005) Lu, J.-F., & Zhou, B.-Y. 2005, ApJ, 635, L17
- MacLeod et al. (2016) MacLeod, C. L., Ross, N. P., Lawrence, A., et al. 2016, MNRAS, 457, 389
- Magdziarz & Zdziarski (1995) Magdziarz, P., & Zdziarski, A. A. 1995, MNRAS, 273, 837
- Marconi et al. (2004) Marconi, A., Risaliti, G., Gilli, R., et al. 2004, MNRAS, 351, 169
- Matsuda et al. (2004) Matsuda, Y., Yamada, T., Hayashino, T., et al. 2004, AJ, 128, 569
- Matsuda et al. (2006) Matsuda, Y., Yamada, T., Hayashino, T., Yamauchi, R., & Nakamura, Y. 2006, ApJ, 640, L123
- Matsuda et al. (2011) Matsuda, Y., Yamada, T., Hayashino, T., et al. 2011, MNRAS, 410, L13
- Matt et al. (1991) Matt, G., Perola, G. C., & Piro, L. 1991, A&A, 247, 25
- Meinköhn & Richling (2002) Meinköhn, E. & Richling, S. 2002, A&A, 392, 827
- Mulchaey et al. (1994) Mulchaey, J. S., Koratkar, A., Ward, M. J., et al. 1994, ApJ, 436, 586
- Mullaney et al. (2013) Mullaney, J. R., Alexander, D. M., Fine, S., et al. 2013, MNRAS, 433, 622
- Nesvadba et al. (2006) Nesvadba, N. P. H., Lehnert, M. D., Eisenhauer, F., et al. 2006, ApJ, 650, 693
- Nilsson et al. (2006) Nilsson, K. K., Fynbo, J. P. U., Møller, P., Sommer-Larsen, J., & Ledoux, C. 2006, A&A, 452, L23
- Novak et al. (2011) Novak, G. S., Ostriker, J. P., & Ciotti, L. 2011, ApJ, 737, 26
- Osterbrock & Ferland (2006) Osterbrock, D. E., & Ferland, G. J. 2006, Astrophysics of gaseous nebulae and active galactic nuclei, 2nd. ed. by D.E. Osterbrock and G.J. Ferland. Sausalito, CA: University Science Books, 2006
- Overzier et al. (2013) Overzier, R. A., Nesvadba, N. P. H., Dijkstra, M., et al. 2013, ApJ, 771, 89
- Palunas et al. (2004) Palunas, P., Teplitz, H. I., Francis, P. J., Williger, G. M., & Woodgate, B. E. 2004, ApJ, 602, 545
- Prescott et al. (2008) Prescott, M. K. M., Kashikawa, N., Dey, A., & Matsuda, Y. 2008, ApJ, 678, L77
- Prescott et al. (2015) Prescott, M. K. M., Momcheva, I., Brammer, G. B., Fynbo, J. P. U., & Møller, P. 2015, ApJ, 802, 32
- Rivera-Thorsen et al. (2015) Rivera-Thorsen, T. E., Hayes, M., Östlin, G., et al. 2015, ApJ, 805, 14
- Rosdahl & Blaizot (2012) Rosdahl, J. & Blaizot, J. 2012, MNRAS, 423, 344
- Roy et al. (2010) Roy, I., Shu, C.-W., & Fang, L.-Z. 2010, ApJ, 716, 604
- Runnoe et al. (2016) Runnoe, J. C., Cales, S., Ruan, J. J., et al. 2016, MNRAS, 455, 1691
- Schawinski et al. (2010) Schawinski, K., Evans, D. A., Virani, S., et al. 2010, ApJ, 724, L30
- Schawinski et al. (2015) Schawinski, K., Koss, M., Berney, S., & Sartori, L. F. 2015, MNRAS, 451, 2517
- Schirmer et al. (2013) Schirmer, M., Diaz, R., Holhjem, K., Levenson, N. A., & Winge, C. 2013, ApJ, 763, 60
- Schirmer et al. (2016) Schirmer, M., Malhotra, S., Levenson, N. A., et al. 2016, MNRAS, 463, 1554
- Schmitt et al. (2003) Schmitt, H. R., Donley, J. L., Antonucci, R. R. J., Hutchings, J. B., & Kinney, A. L. 2003, ApJS, 148, 327
- Sijacki et al. (2015) Sijacki, D., Vogelsberger, M., Genel, S., et al. 2015, MNRAS, 452, 575
- Steidel et al. (2000) Steidel, C. C., Adelberger, K. L., Shapley, A. E., et al. 2000, ApJ, 532, 170
- Storey & Zeippen (2000) Storey, P. J., & Zeippen, C. J. 2000, MNRAS, 312, 813
- Storey & Sochi (2015) Storey, P. J., & Sochi, T. 2015, MNRAS, 446, 1864
- Sun et al. (2017) Sun, A.-L., Greene, J. E., & Zakamska, N. L. 2017, ApJ, 835, 222
- Taniguchi & Shioya (2000) Taniguchi, Y., & Shioya, Y. 2000, ApJ, 532, L13
- Trebitsch et al. (2016) Trebitsch, M., Verhamme, A., Blaizot, J., & Rosdahl, J. 2016, A&A, 593, A122
- Treyer et al. (2010) Treyer, M., Schiminovich, D., Johnson, B. D., et al. 2010, ApJ, 719, 1191
- Ueda et al. (2007) Ueda, Y., Eguchi, S., Terashima, Y., et al. 2007, ApJ, 664, L79
- Ueda et al. (2015) Ueda, Y., Hashimoto, Y., Ichikawa, K., et al. 2015, ApJ, 815, 1
- Urry & Padovani (1995) Urry, C. M., & Padovani, P. 1995, PASP, 107, 803
- Verhamme et al. (2006) Verhamme, A., Schaerer, D., & Maselli, A. 2006, A&A, 460, 397
- White et al. (1997) White, R. L., Becker, R. H., Helfand, D. J., & Gregg, M. D. 1997, ApJ, 475, 479
- Wold et al. (2014) Wold, I. G. B., Barger, A. J., & Cowie, L. L. 2014, ApJ, 783, 119
- Wright et al. (2010) Wright, E. L., Eisenhardt, P. R. M., Mainzer, A. K., et al. 2010, AJ, 140, 1868
- Xu et al. (2011) Xu, W., Wu, X.-P., & Fang, L.-Z. 2011, MNRAS, 418, 853
- Yang et al. (2016) Yang, H., Malhotra, S., Gronke, M., et al. 2016, ApJ, 820, 130
- Zubovas & King (2016) Zubovas, K., & King, A. 2016, MNRAS, 462, 4055