New constraints on quasar broad absorption and emission line regions from gravitational microlensing
Abstract
Gravitational microlensing is a powerful tool allowing one to probe the structure of quasars on sub-parsec scale. We report recent results, focusing on the broad absorption and emission line regions. In particular microlensing reveals the intrinsic absorption hidden in the P Cygni-type line profiles observed in the broad absorption line quasar H1413+117, as well as the existence of an extended continuum source. In addition, polarization microlensing provides constraints on the scattering region. In the quasar Q2237+030, microlensing differently distorts the H and CIV broad emission line profiles, indicating that the low- and high-ionization broad emission lines must originate from regions with distinct kinematical properties. We also present simulations of the effect of microlensing on line profiles considering simple but representative models of the broad emission line region. Comparison of observations to simulations allows us to conclude that the H emitting region in Q2237+030 is best represented by a Keplerian disk.
\helveticabold1 Keywords:
quasars, broad emission lines, broad absorption lines, gravitational microlensing, polarization
2 Introduction
When the light from a distant quasar passes through the gravitational field of a galaxy, it is deflected and multiple magnified images of the source are observed. In addition, stars in the lensing galaxy can act as microlenses and produce an extra magnification of some images. The collective effect of these stars generates a complex magnification pattern in the source plane that takes the form of a caustic network. Microlensing magnification varies in time due to the relative motions of the source, lens and observer, on timescales of weeks to years. High magnification events occur when caustics are close to the line of sight (e.g., Schmidt and Wambsganss, 2010, for a review).
Gravitational lensing magnification strongly depends on the Einstein radius of the system, in the sense that only sources smaller than this radius can be significantly magnified. For a typical lensed system with a lensing galaxy at redshift and a source quasar at , the projected Einstein radius of an average 0.3 M⊙ star in the lensing galaxy is of the order of 10-3 pc, which is comparable to the size of the quasar continuum-emitting accretion disk. Microlensing thus mainly magnifies the continuum source. The more extended broad emission line region is either unaffected or only partly magnified. The much larger narrow line region is totally unaffected.
Therefore, microlensing differently magnifies the various components of the quasar spectrum. By comparing the spectra of two images of a lensed quasar, one affected by microlensing and the other not, one can separate the part of the spectrum which is microlensed, that is the part coming from the most compact source, from the part of the spectrum which is not affected by microlensing and originates from a more extended region. Information on the geometry and kinematics of the quasar inner regions can thus be obtained. This is illustrated in the following sections, focusing on the broad absorption and emission line regions (respectively, BALR and BELR).
3 Microlensing in the Broad Absorption Line quasar H1413+117
H1413+117, the cloverleaf, is a quadruply lensed broad absorption line (BAL) quasar in which a slowly varying microlensing effect lasting for 20 years magnifies the continuum of image D, leaving the emission lines essentially unchanged (Angonin et al., 1990; Hutsemékers, 1993; Anguita et al., 2008; Hutsemékers et al., 2010; Sluse et al., 2015; O’Dowd et al., 2015). Image A is not or weakly affected by microlensing, thus providing a reference spectrum. We can then separate the part of the line profiles that is microlensed from the part that is not microlensed using the macro-micro decomposition (MmD) method presented in Sluse et al. (2007) and Hutsemékers et al. (2010).
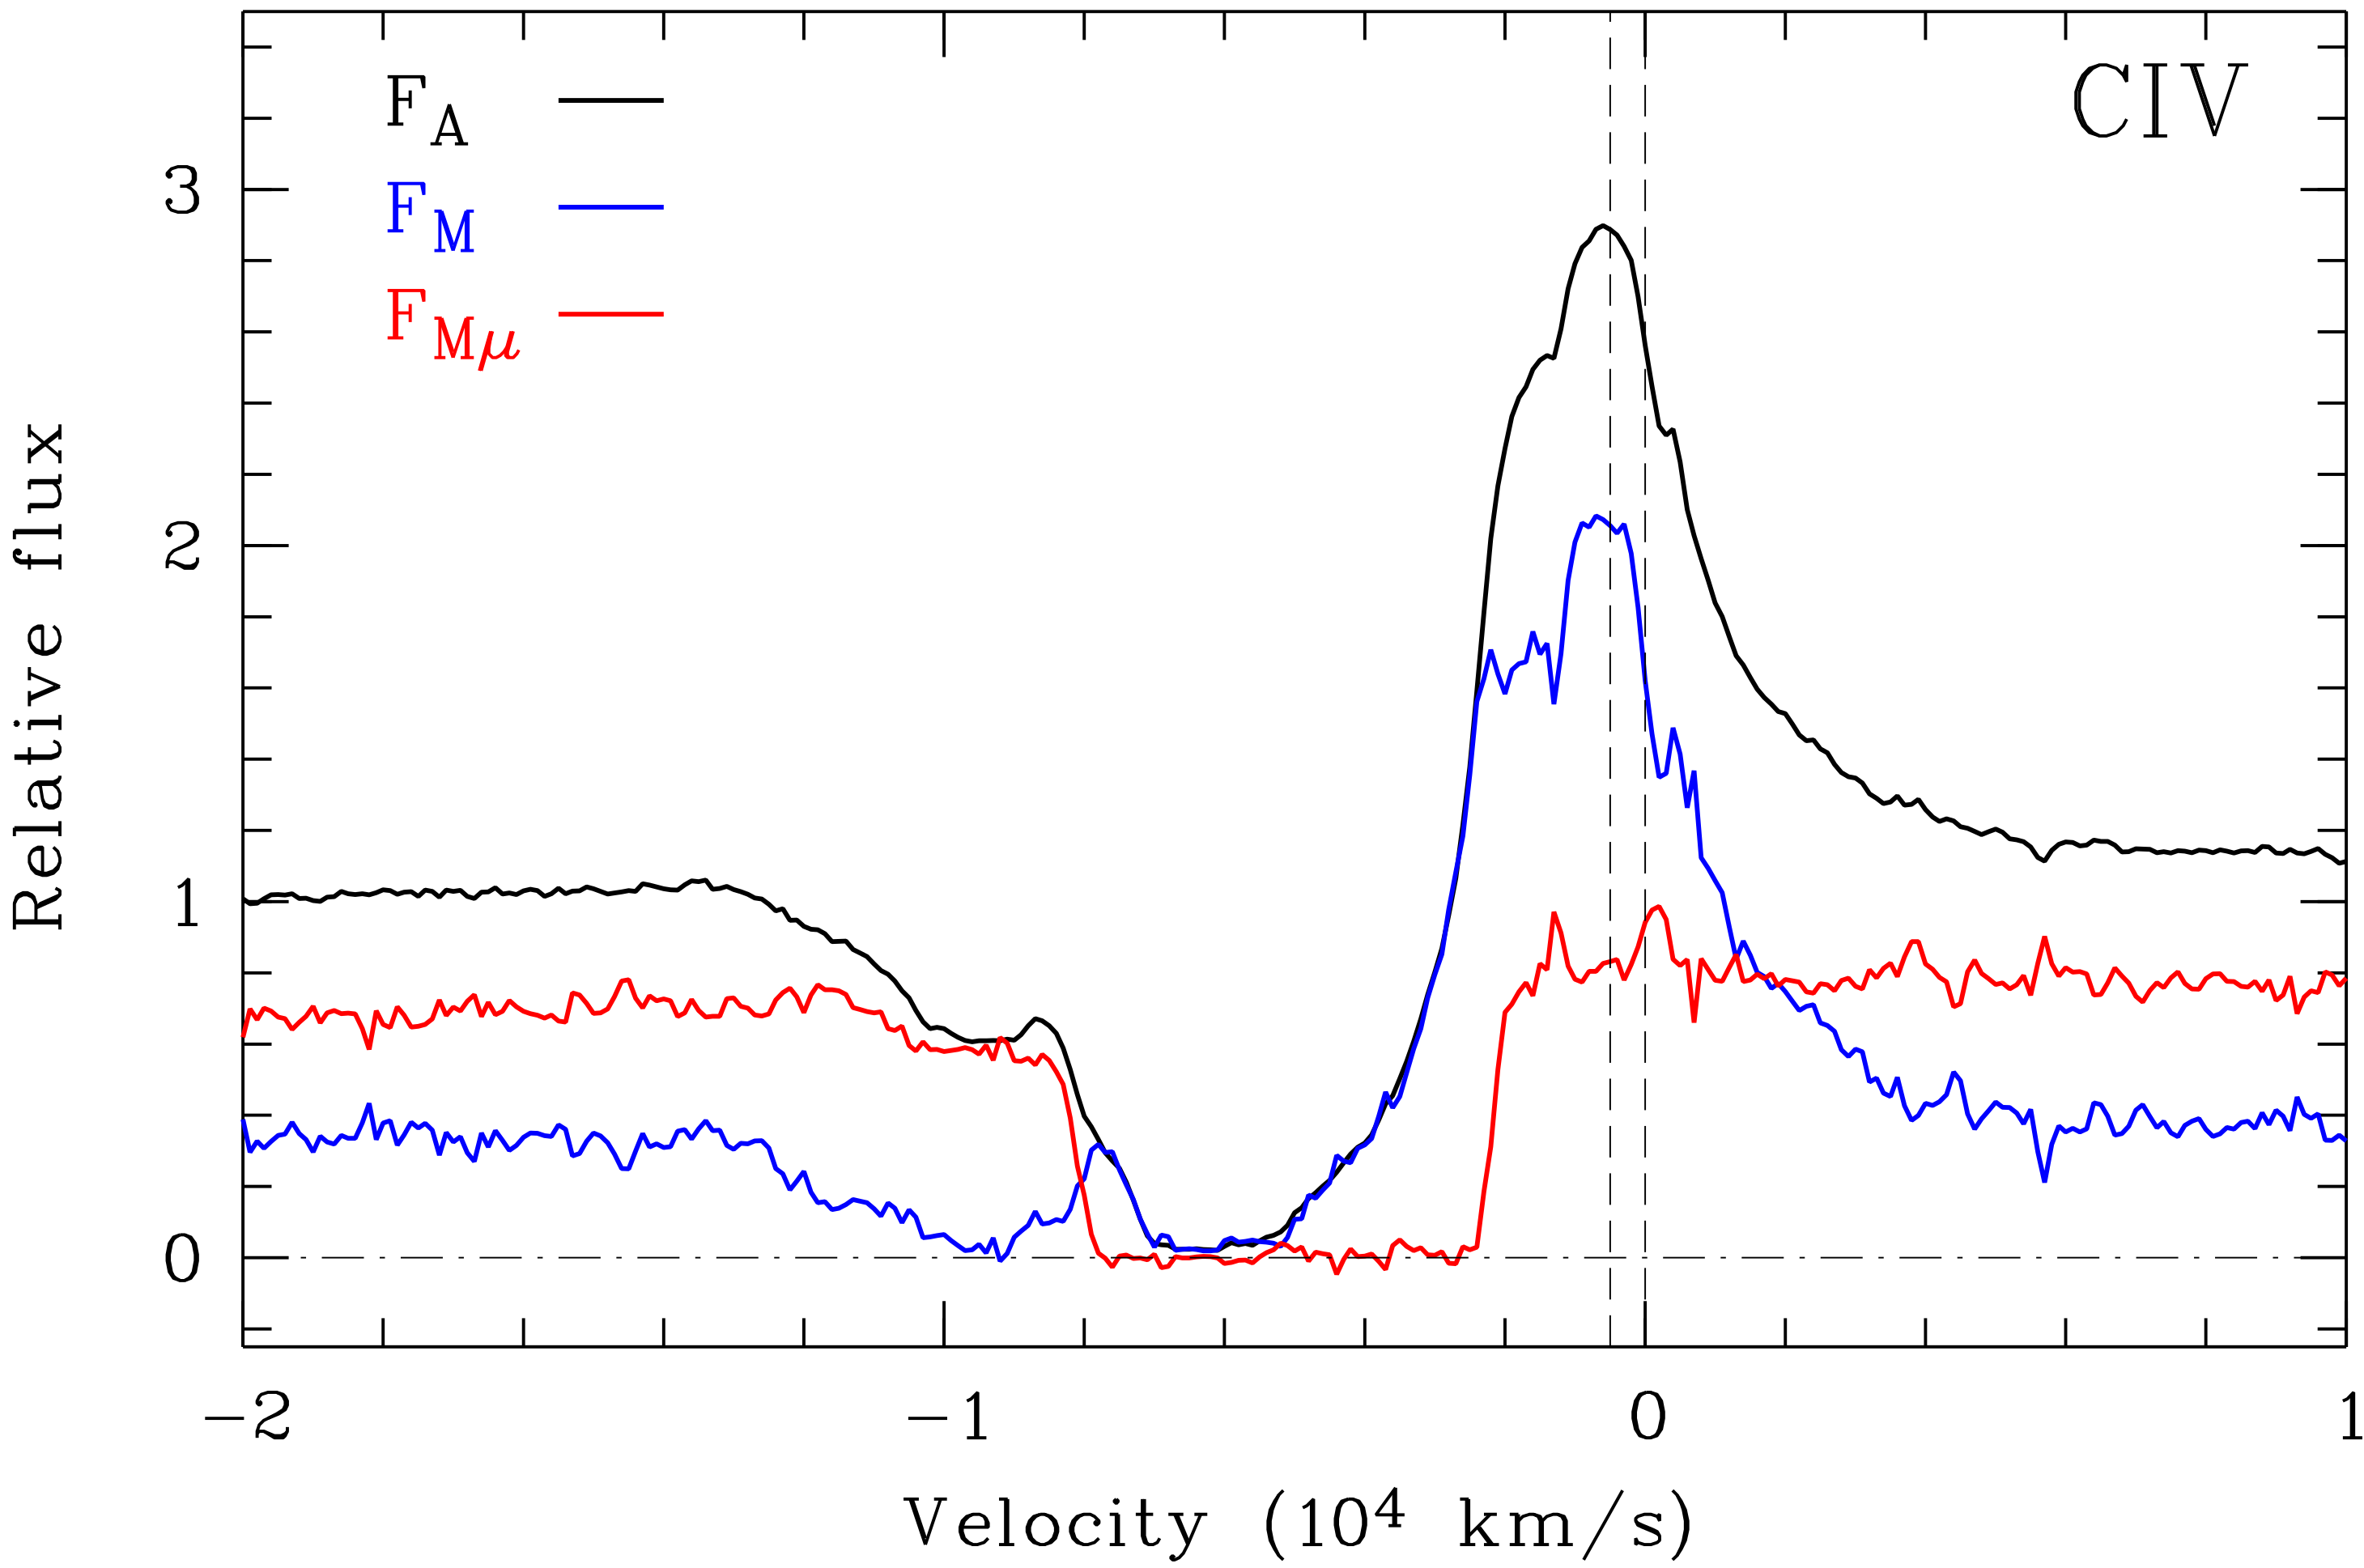
Fig. 1 illustrates the decomposition of the CIV 1549Å P Cygni-type line profile into its microlensed (FMμ) and non-microlensed (FM) components (see Hutsemékers et al., 2010; Sluse et al., 2015, for more details). FMμ comes from a compact region that essentially produces the absorbed continuum, while FM comes from a more extended region too large to be microlensed. From this spectral decomposition, it results that (1) the BAL profile consists of a completely black absorption (seen in FMμ) partially filled in by the broad emission line (seen in FM); (2) this absorption does not start at zero-velocity but at an onset velocity of 2000 km/s; (3) the broad emission line itself is re-absorbed (see FM) over a wavelength range narrower than the full absorption profile, revealing the existence of an additional, more extended BALR; (4) a part of the continuum (seen in FM) is not microlensed thus originating from a region larger than the source of the continuum seen in FMμ. These observations suggest a two-component outflow: one component is co-spatial with the BELR, while the other one, more distant, partially re-absorbs the emission from the BELR (Borguet and Hutsemékers, 2010). O’Dowd et al. (2015) found in addition an ionization dependence of the BAL onset velocity that they interpreted in the framework of a disk-wind model.
The light from H1413+117 is linearly polarized and Chae et al. (2001) found evidence for polarization microlensing. Hutsemékers et al. (2015) obtained spectropolarimetric observations of the different images that suggest that the continuum is scattered off two regions generating roughly orthogonal polarizations: a compact region located in the equatorial plane close to the accretion disk, which is microlensed, and an extended region located along the polar axis, which is not microlensed. This indicates that the non-microlensed extended continuum seen in FM (Fig. 1) could originate from scattering.
4 Microlensing of the broad emission line region in Q2237+030
4.1 Observed line profile distortions
Though larger than the source of continuum, the BELR can be partly magnified by microlensing, which results in line profile deformations. Such microlensing-induced line profile deformations have been observed in several lensed quasar spectra, exhibiting various symmetric and asymmetric distortions in both low- and high-ionization lines (Richards et al., 2004; Wayth et al., 2005; Sluse et al., 2007, 2011, 2012; O’Dowd et al., 2011; Guerras et al., 2013; Braibant et al., 2014, 2016; Goicoechea and Shalyapin, 2016; Motta et al., 2017). By selectively magnifying different subregions of the broad line region, gravitational microlensing can thus provide information on the size, geometry and kinematics of the BELR in quasars (Nemiroff, 1988; Schneider and Wambsganss, 1990). In particular, the size of the BELR has been estimated in a few objects and found compatible with reverberation mapping measurements (Wayth et al., 2005; Sluse et al., 2011; Guerras et al., 2013).
Making use of the MmD line profile disentangling technique, Braibant et al. (2014, 2016) have extracted the part of the emission line profiles that is affected by microlensing in two lensed quasars for which high quality data were available. Fig. 2 illustrates the FMμ FM decomposition of the CIV 1549Å and H broad emission line profiles for the quadruply lensed quasar Q2237+030, the Einstein Cross, at an epoch when microlensing was prominent in image A and negligible in image D. A clear difference in the distortions suffered by the CIV and H emission lines can be noticed. In CIV the effect is essentially symmetric, the wings of the line being more magnified than the core, while in H the effect is asymmetric, the red wing being more magnified than the blue wing. Since these observations were obtained at the same epoch, both the CIV and H emitting regions are magnified by the same caustic pattern. This indicates that the high- and low-ionization emission lines must originate from regions with distinct kinematical properties.
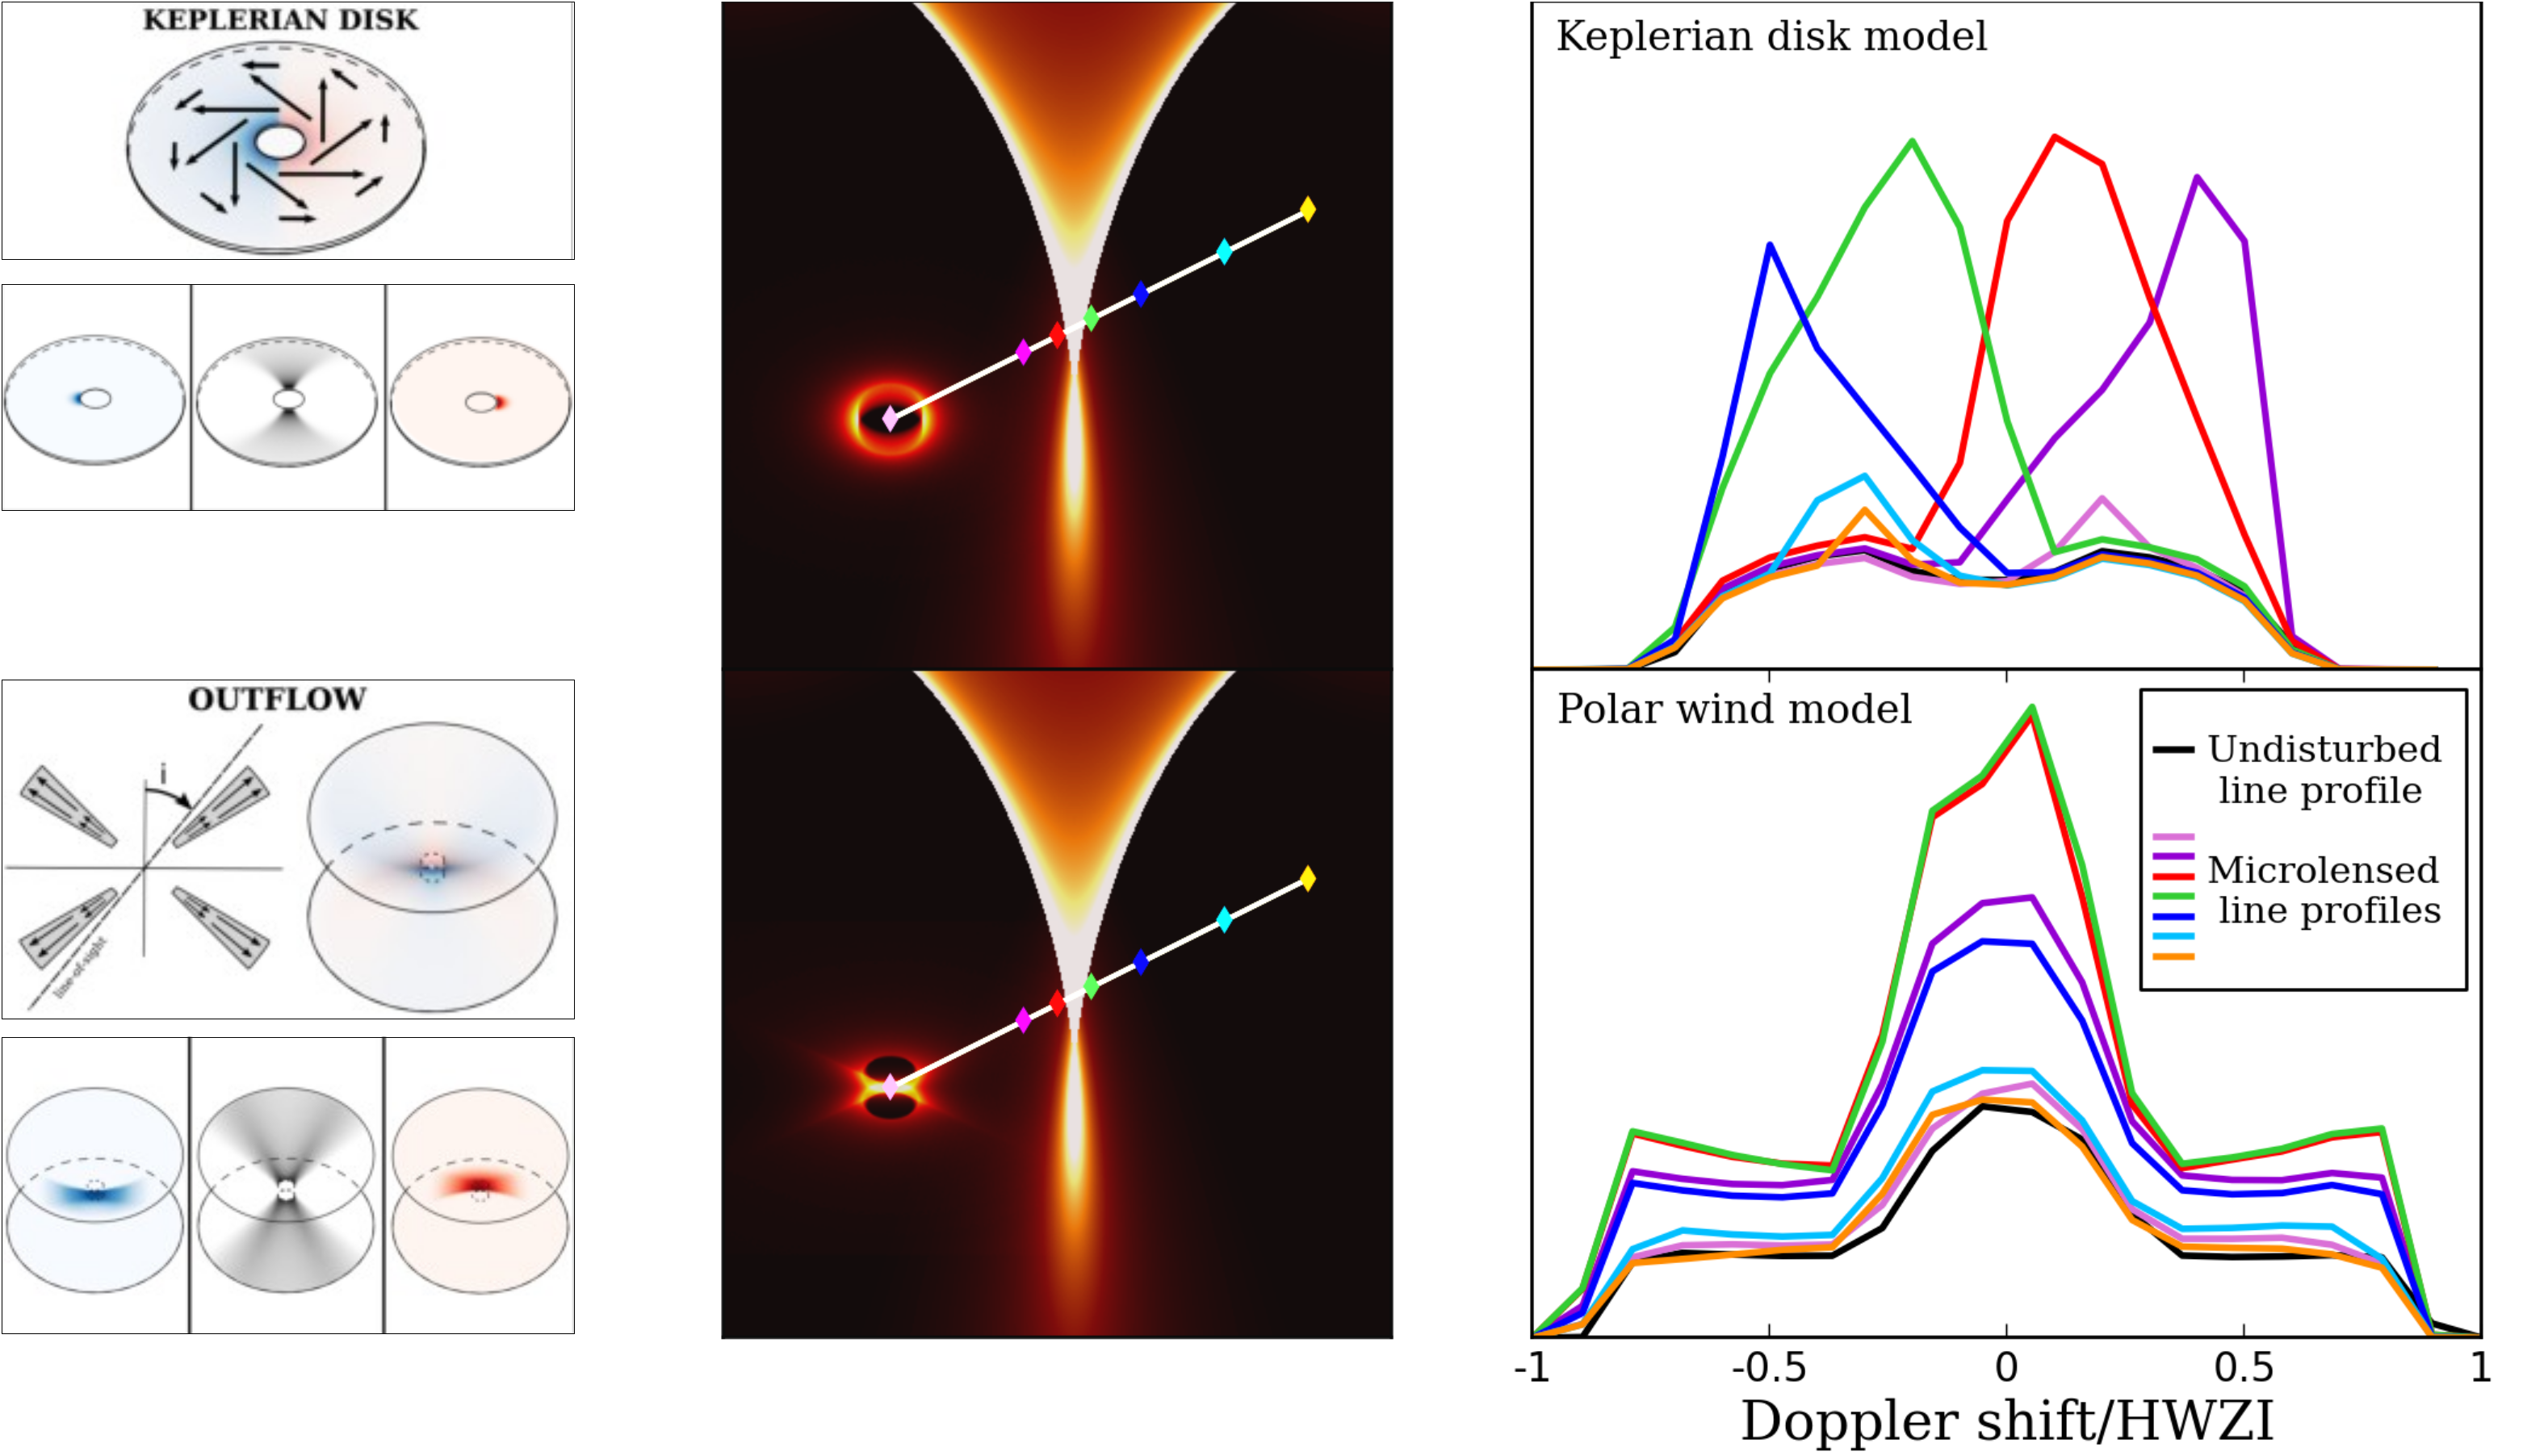
As illustrated in Fig. 3, the detection of a red/blue differential microlensing effect in the H line profile suggests that the low-ionization BELR is likely a Keplerian disk, while the wings/core distortion observed in the CIV line can be interpreted assuming a polar outflow model. However, the mapping between a wavelength range in the line profile and subregions of the BELR seen in projection is usually not unique and a confrontation of the observations to detailed modeling appeared necessary.
4.2 Simulations of line profile distortions
Possible effects of microlensing on broad emission lines have been theoretically investigated by several authors (Nemiroff, 1988; Schneider and Wambsganss, 1990; Hutsemékers et al., 1994; Popović et al., 2001; Abajas et al., 2002, 2007; Lewis and Ibata, 2004; O’Dowd et al., 2011; Simić and Popović, 2014) considering various BELR models and magnification patterns.
In Braibant et al. (2017), we extend those works focusing on wings/core and red/blue line profile distortions in order to constrain the BELR models. The effects of gravitational microlensing on the quasar broad emission line profiles and their underlying continuum have been simultaneously computed, considering simple, representative BELR, accretion disk, and magnifying caustic models. Keplerian disks as well as polar and equatorial outflow models of various sizes have been considered. The effect of microlensing has been quantified using four observables: , the total magnification of the broad emission line, , the magnification of the underlying continuum, as well as red/blue, , and wings/core, , indices that characterize the line profile distortions. Those quantities were designed to not depend on the exact profile of the broad emission lines, so that they can be directly compared to observations.
The simulations show that asymmetric distortions of broad line profiles like those reported in Braibant et al. (2014, 2016) can be reproduced, and attributed to the differential effect of microlensing on spatially and kinematically separated regions of the BELR. In particular, red/blue asymmetric distortions constitute a good discriminant between the polar outflow and other models. We then built diagrams that can serve as diagnostic tools to discriminate between the different BELR models making use of quantitative measurements of the four observables , , , . It appeared from the simulations that only strong microlensing effects can produce distinctive line profile distortions for a limited number of caustic configurations, i.e., distortions that allow us to put serious constraints on the various BELR models.
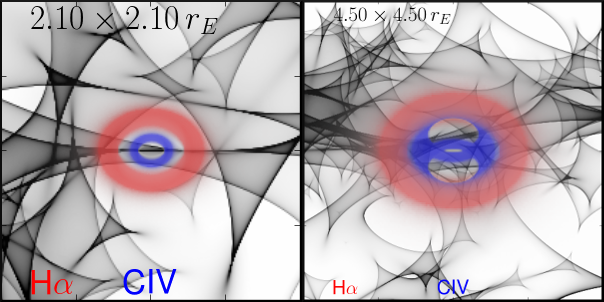
The four indices , , , were then measured for both the CIV and H emission lines observed in the lensed quasar Q2237+030, and compared to the values generated by the simulations (Braibant et al., in preparation). In the simulations, we assumed that the CIV and H BELRs, and the continuum-emitting accretion disk share the same inclination with respect to the line of sight and the same location on the caustic network. From this comparison it results that the H low-ionization BELR is best represented by a Keplerian disk while the CIV high-ionization BELR can be either a Keplerian disk or a polar wind. Examples of fitting models are illustrated in Fig. 4. In all cases the H BELR is roughly a factor 2 larger than the CIV BELR. Recent results from velocity-resolved reverberation mapping also suggest that the low-ionization BELR can be a Keplerian disk (Grier et al., 2017, and references therein).
5 Conclusions
These results demonstrate the potential of microlensing to probe the geometry and kinematics of the broad line regions and outflows in quasars. Constraints on the location of the scattering regions at the origin of the polarization can also be obtained. Simulations of line profile distortions show that only strong microlensing effects can produce line profile distortions allowing us to discriminate between various BELR models using single epoch data. To benefit from weaker microlensing effects, statistical analyses of larger data sets would be needed. In particular, a long-term spectrophotometric monitoring of the different images of lensed quasars would provide a real scan of their line emitting regions, with the possibility to constrain more complex models than those considered here. Microlensing can thus be a powerful and alternative approach to reverberation mapping, especially since it can be applied to high redshift quasars, with little dependence on their luminosity, and to the study of both the low- and high-ionization BLRs.
Conflict of Interest Statement
The authors declare that the research was conducted in the absence of any commercial or financial relationships that could be construed as a potential conflict of interest.
Author Contributions
DH and DS initiated the project. LB, DH, DS, and TA contributed to the observations, data reduction and analysis. LB, DH, DS and RG contributed to the BELR microlensing modeling. All authors contributed to the discussions. DH wrote the paper with contributions from DS. LB made the artwork in figure 3.
Acknowledgments
DH and LB acknowledge support of Belgian F.R.S.-FNRS. Support for TA is provided by project FONDECYT 11130630 and the Ministry of Economy, Development, and Tourism’s Millennium Science Initiative through grant IC120009, awarded to The Millennium Institute of Astrophysics, MAS.
References
- Abajas et al. (2007) Abajas, C., Mediavilla, E., Muñoz, J. A., Gómez-Álvarez, P., and Gil-Merino, R. (2007). Microlensing of a Biconical Broad-Line Region. ApJ 658, 748–762. 10.1086/511023
- Abajas et al. (2002) Abajas, C., Mediavilla, E., Muñoz, J. A., Popović, L. Č., and Oscoz, A. (2002). The Influence of Gravitational Microlensing on the Broad Emission Lines of Quasars. ApJ 576, 640–652. 10.1086/341793
- Angonin et al. (1990) Angonin, M.-C., Vanderriest, C., Remy, M., and Surdej, J. (1990). First spectroscopic evidence of microlensing on a BAL quasar? The case of H 1413 + 117. A&A 233, L5–L8
- Anguita et al. (2008) Anguita, T., Schmidt, R. W., Turner, E. L., Wambsganss, J., Webster, R. L., Loomis, K. A., et al. (2008). The multiple quasar Q2237+0305 under a microlensing caustic. A&A 480, 327–334. 10.1051/0004-6361:20078221
- Borguet and Hutsemékers (2010) Borguet, B. and Hutsemékers, D. (2010). A polar+equatorial wind model for broad absorption line quasars. I. Fitting the C IV BAL profiles. A&A 515, A22. 10.1051/0004-6361/200913255
- Braibant et al. (2016) Braibant, L., Hutsemékers, D., Sluse, D., and Anguita, T. (2016). The different origins of high- and low-ionization broad emission lines revealed by gravitational microlensing in the Einstein cross. A&A 592, A23. 10.1051/0004-6361/201628594
- Braibant et al. (2014) Braibant, L., Hutsemékers, D., Sluse, D., Anguita, T., and García-Vergara, C. J. (2014). Microlensing of the broad-line region in the quadruply imaged quasar HE0435-1223. A&A 565, L11. 10.1051/0004-6361/201423633
- Braibant et al. (2017) Braibant, L., Hutsemékers, D., Sluse, D., and Goosmann, R. (2017). Constraining the geometry and kinematics of the quasar broad emission line region using gravitational microlensing. I. Models and simulations. ArXiv e-prints , 1707.09159
- Chae et al. (2001) Chae, K.-H., Turnshek, D. A., Schulte-Ladbeck, R. E., Rao, S. M., and Lupie, O. L. (2001). Hubble Space Telescope Observations of the Gravitationally Lensed Cloverleaf Broad Absorption Line QSO H1413+1143: Imaging Polarimetry and Evidence for Microlensing of a Scattering Region. ApJ 561, 653–659. 10.1086/323318
- Goicoechea and Shalyapin (2016) Goicoechea, L. J. and Shalyapin, V. N. (2016). Gravitational lens system SDSS J1339+1310: microlensing factory and time delay. A&A 596, A77. 10.1051/0004-6361/201628790
- Grier et al. (2017) Grier, C. J., Pancoast, A., Barth, A. J., Fausnaugh, M. M., Brewer, B. J., Treu, T., et al. (2017). The Structure of the Broad-Line Region In Active Galactic Nuclei. II. Dynamical Modeling of Data from the AGN10 Reverberation Mapping Campaign. ArXiv e-prints , 1705.02346
- Guerras et al. (2013) Guerras, E., Mediavilla, E., Jimenez-Vicente, J., Kochanek, C. S., Muñoz, J. A., Falco, E., et al. (2013). Microlensing of Quasar Broad Emission Lines: Constraints on Broad Line Region Size. ApJ 764, 160. 10.1088/0004-637X/764/2/160
- Hutsemékers (1993) Hutsemékers, D. (1993). Selective gravitational microlensing and line profile variations in the BAL quasar H 1413+117. A&A 280, 435–442
- Hutsemékers et al. (2010) Hutsemékers, D., Borguet, B., Sluse, D., Riaud, P., and Anguita, T. (2010). Microlensing in H1413+117: disentangling line profile emission and absorption in a broad absorption line quasar. A&A 519, A103. 10.1051/0004-6361/200913247
- Hutsemékers et al. (2015) Hutsemékers, D., Sluse, D., Braibant, L., and Anguita, T. (2015). Polarization microlensing in the quadruply imaged broad absorption line quasar H1413+117. A&A 584, A61. 10.1051/0004-6361/201527243
- Hutsemékers et al. (1994) Hutsemékers, D., Surdej, J., and van Drom, E. (1994). The use of gravitational microlensing to scan the structure of BAL QSOs. Ap&SS 216, 361–365. 10.1007/BF00982519
- Lewis and Ibata (2004) Lewis, G. F. and Ibata, R. A. (2004). Gravitational microlensing of quasar broad-line regions at large optical depths. MNRAS 348, 24–33. 10.1111/j.1365-2966.2004.07349.x
- Motta et al. (2017) Motta, V., Mediavilla, E., Rojas, K., Falco, E. E., Jiménez-Vicente, J., and Muñoz, J. A. (2017). Probing the Broad-line Region and the Accretion Disk in the Lensed Quasars HE 0435-1223, WFI 2033-4723, and HE 2149-2745 Using Gravitational Microlensing. ApJ 835, 132. 10.3847/1538-4357/835/2/132
- Nemiroff (1988) Nemiroff, R. J. (1988). AGN broad emission line amplification from gravitational microlensing. ApJ 335, 593–605. 10.1086/166951
- O’Dowd et al. (2011) O’Dowd, M., Bate, N. F., Webster, R. L., Wayth, R., and Labrie, K. (2011). Differential microlensing measurements of quasar broad-line kinematics in Q2237+0305. MNRAS 415, 1985–1998. 10.1111/j.1365-2966.2010.18119.x
- O’Dowd et al. (2015) O’Dowd, M. J., Bate, N. F., Webster, R. L., Labrie, K., and Rogers, J. (2015). Microlensing Constraints on Broad Absorption and Emission Line Flows in the Quasar H1413+117. ApJ 813, 62. 10.1088/0004-637X/813/1/62
- Popović et al. (2001) Popović, L. Č., Mediavilla, E. G., and Muñoz, J. A. (2001). The influence of microlensing on spectral line shapes generated by a relativistic accretion disc. A&A 378, 295–301. 10.1051/0004-6361:20011169
- Richards et al. (2004) Richards, G. T., Keeton, C. R., Pindor, B., Hennawi, J. F., Hall, P. B., Turner, E. L., et al. (2004). Microlensing of the Broad Emission Line Region in the Quadruple Lens SDSS J1004+4112. ApJ 610, 679–685. 10.1086/421868
- Schmidt and Wambsganss (2010) Schmidt, R. W. and Wambsganss, J. (2010). Quasar microlensing. General Relativity and Gravitation 42, 2127–2150. 10.1007/s10714-010-0956-x
- Schneider and Wambsganss (1990) Schneider, P. and Wambsganss, J. (1990). Are the broad emission lines of quasars affected by gravitational microlensing? A&A 237, 42–53
- Simić and Popović (2014) Simić, S. and Popović, L. Č. (2014). Broad spectral line and continuum variabilities in QSO spectra induced by microlensing of diffusive massive substructure. Advances in Space Research 54, 1439–1447. 10.1016/j.asr.2013.11.016
- Sluse et al. (2007) Sluse, D., Claeskens, J.-F., Hutsemékers, D., and Surdej, J. (2007). Multi-wavelength study of the gravitational lens system RXS J1131-1231. III. Long slit spectroscopy: micro-lensing probes the QSO structure. A&A 468, 885–901. 10.1051/0004-6361:20066821
- Sluse et al. (2015) Sluse, D., Hutsemékers, D., Anguita, T., Braibant, L., and Riaud, P. (2015). Evidence for two spatially separated UV continuum emitting regions in the Cloverleaf broad absorption line quasar. A&A 582, A109. 10.1051/0004-6361/201526832
- Sluse et al. (2012) Sluse, D., Hutsemékers, D., Courbin, F., Meylan, G., and Wambsganss, J. (2012). Microlensing of the broad line region in 17 lensed quasars. A&A 544, A62. 10.1051/0004-6361/201219125
- Sluse et al. (2011) Sluse, D., Schmidt, R., Courbin, F., Hutsemékers, D., Meylan, G., Eigenbrod, A., et al. (2011). Zooming into the broad line region of the gravitationally lensed quasar QSO 2237 + 0305 the Einstein Cross. III. Determination of the size and structure of the C iv and C iii] emitting regions using microlensing. A&A 528, A100. 10.1051/0004-6361/201016110
- Wayth et al. (2005) Wayth, R. B., O’Dowd, M., and Webster, R. L. (2005). A microlensing measurement of the size of the broad emission-line region in the lensed quasar QSO 2237+0305. MNRAS 359, 561–566. 10.1111/j.1365-2966.2005.08919.x
Figure captions